




TL;DR: Trend following means joining a move after price proves it, then holding until the trend breaks instead of predicting a top. A 50-session breakout rule tested on 12 futures markets over ten years won 27.8% of trades and still finished at +64.7R. Most of the profit came from 45 trades, so the real test is sitting through long losing runs without changing the rules.
What Trend Following Means and Why Trends Exist
Trend following is a way of trading that reacts to price instead of forecasting it, and it asks you to do something that feels wrong: buy a market after it has already gone up, or sell one after it has already fallen. You wait for the market to prove it is moving, join in that direction, set a maximum loss before you enter, and stay in until the trend shows clear signs of ending. There is no price target and no need to explain why the market is moving.
The idea is old. AQR Capital Management's research paper "A Century of Evidence on Trend-Following Investing" points to the 19th-century economist David Ricardo's advice to "cut short your losses" and "let your profits run on" as an early version of the same instinct. A trend follower turns that advice into rules a computer could follow.
Why would trends exist at all? The same paper lists two kinds of explanation. Investors anchor to old prices and herd into crowded moves, so news gets priced in gradually instead of all at once. And some large participants, such as central banks and corporate hedging programs, trade for reasons other than profit, which can slow the speed at which prices adjust.
What trend following is not
Trend following is not the same as three things it often gets mixed up with:
- It is not dip buying. A dip buyer buys weakness inside an uptrend. A pure trend follower buys strength after a new high, which feels worse at the moment of entry.
- It is not momentum ranking. Cross-sectional momentum compares markets with each other and buys the strongest. Trend following (also called time-series momentum) judges each market only against its own history, so it can be short everything at once.
- It is not a way to be right often. The rule tested in this guide lost on 72.2% of its trades and still made money, because the winners were several times larger than the losers.
That last point drives everything else about trend following, including the psychology and the position sizing.
Related lesson: Momentum trading
How Trend Followers Identify a Trend
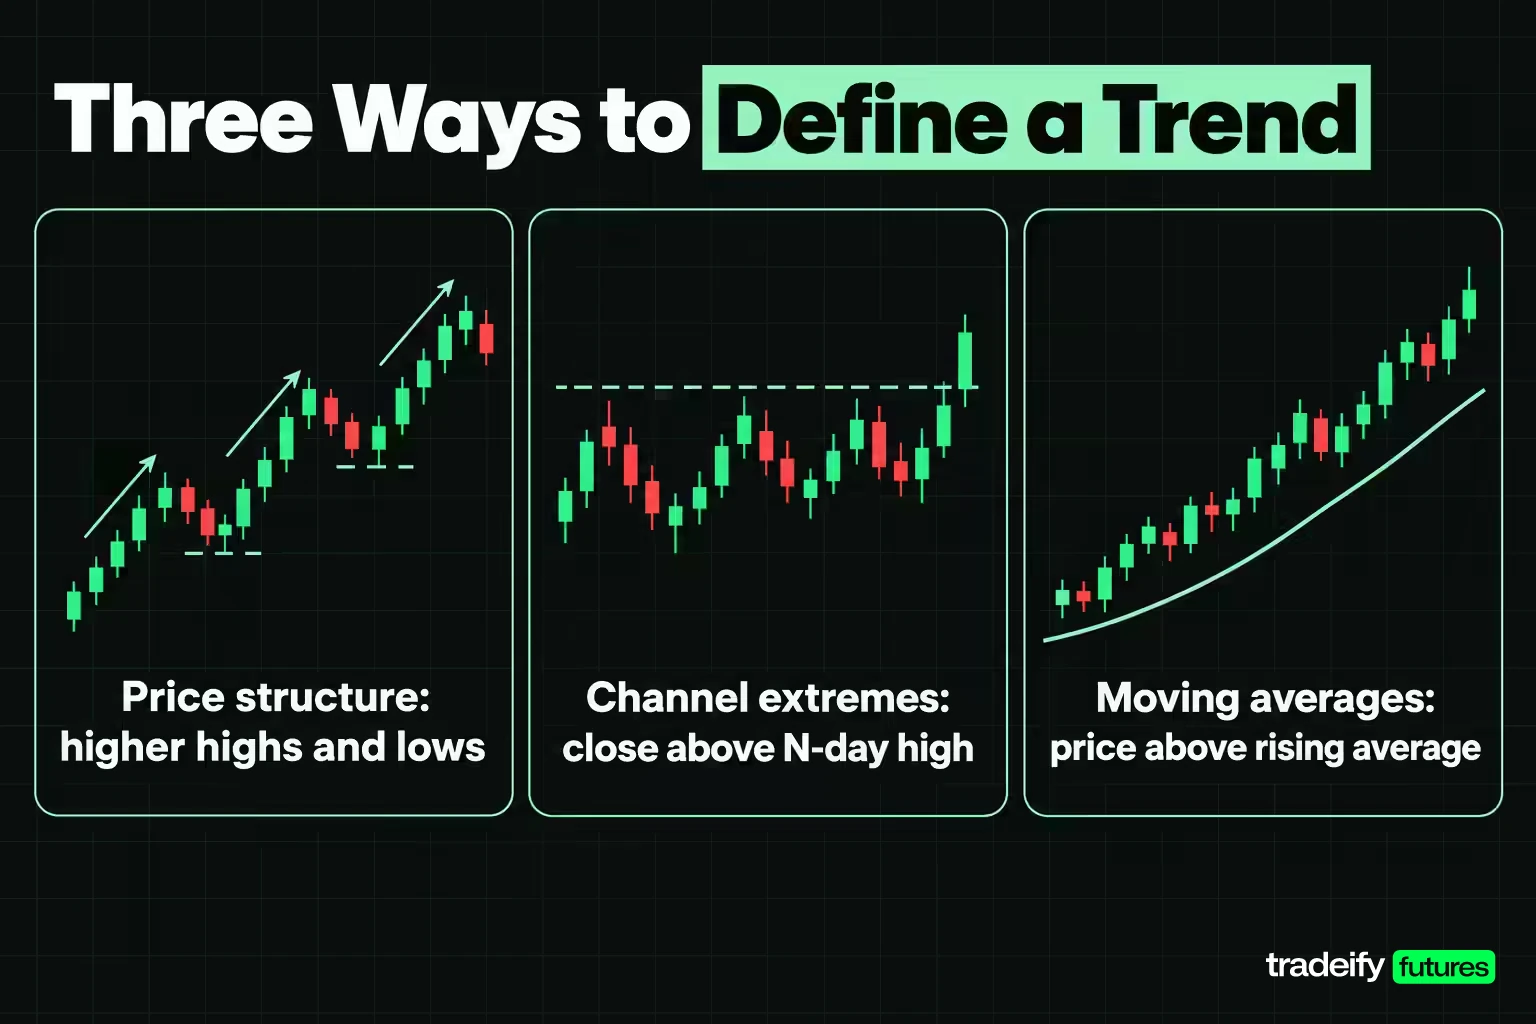
A trend follower needs a definition of "trend" that a rule can check without opinion. Three definitions cover almost every system in use.
- Price structure. An uptrend makes higher highs and higher lows; a downtrend makes lower highs and lower lows. This is the most intuitive version, but deciding which swing counts is a judgement call.
- Channel extremes. Price closes above the highest high (or below the lowest low) of the last N sessions. This is the Donchian channel breakout, and it removes the judgement entirely.
- Moving averages. Price above a rising average, or a faster average above a slower one, counts as an uptrend. Averages are smooth and easy to code, but they lag, and longer averages lag more.
Does an ADX trend filter help?
Many trend followers add a strength filter so they only take breakouts in markets that are already trending. The usual tool is the Average Directional Index (ADX), and the usual thresholds come from its creator, J. Welles Wilder, who treated an ADX above 25 as a strong trend and below 20 as no trend.
That filter sounds sensible, so it was tested on a 50-session breakout rule with a 2-ATR stop, run on twelve futures markets from November 2016 to November 2026. Each filter was run as its own test, taking only the signals that met it.
| ADX at the signal | Trades | Win rate | Total | Profit factor | Max drawdown |
|---|---|---|---|---|---|
| No filter | 504 | 27.8% | +64.7R | 1.19 | 56.0R |
| ADX 25 or higher | 319 | 27.6% | +58.3R | 1.26 | 37.4R |
| ADX 20 to 25 | 290 | 25.2% | +17.9R | 1.09 | 38.6R |
| ADX below 20 | 284 | 29.9% | +65.4R | 1.34 | 39.2R |
The "strong trend" filter did not pick out better breakouts. Breakouts that fired while ADX was below 20, when the market looked trendless, did slightly better than the ones Wilder's threshold would approve. The reason is mechanical: ADX is smoothed and lags, so by the time it reads above 25 a good part of the move has already happened. A breakout from a quiet range is often the very start of the trend that ADX will confirm weeks later.
The filters did cut the drawdown, mostly because they skipped trades. So a strength filter can be a reasonable risk choice, but this sample gives no support to the idea that it finds better trends.
Related lesson: Market structure, highs, lows and trends
Trend Following Indicators and Tools
Trend following uses a small toolkit, and each tool answers one question. Trouble usually starts when a trader asks a tool a question it was never designed to answer.
| Tool | Question it answers | Common setting | Weak spot |
|---|---|---|---|
| Donchian channel | Has price just made an N-session high or low? | 20 sessions (TradingView default); 20 and 55 days in the Turtle rules | Fires on every new extreme, including many that fail |
| Moving average | Which way is the average price drifting? | 50 and 200 sessions for long-term trend | Lags; longer averages lag more |
| Average True Range (ATR) | How far does this market normally move in a session? | 14 periods (Wilder) | Says nothing about direction |
| ADX | How strong is the trend, in either direction? | 14 periods; 25 strong, below 20 no trend | Heavily smoothed and late |
| MACD | Is short-term momentum rising or falling against the longer trend? | 12, 26 and 9 periods | Unbounded, so poor for overbought and oversold |
The Donchian channel is the classic trend following entry tool. The original Turtle Trading rules used a 20-day breakout for one system and a 55-day breakout for the other, placed stops 2N from entry (N being their version of ATR), and exited on a 10-day or 20-day breakout the other way. The rule tested in this guide is a close cousin of that design.
ATR does not tell you which way to trade, but in practice it does more work than any other trend following tool, because it sets the stop distance and therefore the position size. A trend system that ignores volatility will risk far more on a wild market than on a calm one without meaning to.
You do not need special software. Every major charting platform has these indicators built in, and most can backtest a channel or moving average rule without code. The harder part is choosing one tool per job and then leaving it alone.
Related lesson: Donchian channels
The Trend Following Breakout Rule Tested Here
Every measurement in this guide comes from one rule, written out in full so you can rebuild it or argue with it. It is deliberately plain.
| Rule part | Specification |
|---|---|
| Long signal | Daily close above the highest high of the prior 50 sessions |
| Short signal | Daily close below the lowest low of the prior 50 sessions |
| Entry | Open of the next session |
| Initial stop | 2 x the 14-session ATR (Wilder) measured on the signal day, from the entry price |
| Stop fill | At the stop, or at the open if price gaps through it |
| Trend exit | Next open after a close below the prior 25-session low (longs) or above the prior 25-session high (shorts) |
| Positions | One per market; new signals ignored while a trade is open |
| Unit of result | R, where 1R is the initial stop distance |
The data is 30,155 daily bars from November 7, 2016 to November 4, 2026 on twelve continuous front-month futures: E-mini S&P 500, E-mini Nasdaq-100, WTI crude oil, gold, silver, copper, corn, 10-Year T-Note, 30-Year T-Bond, euro FX, Japanese yen and British pound. The bars come from Yahoo Finance's continuous front-month series, which is not back-adjusted, so a contract roll can show up as a price jump. That can create a false signal now and then, which is one reason to treat these figures as an illustration rather than a forecast.
Results are measured in R because it makes markets comparable. A +3R trade made three times the amount risked, whether that was a corn trade or a Nasdaq trade. Commissions are left out of the headline figures; slippage is priced separately in the cost section.
Related lesson: Backtesting a trading strategy
Trend Following Results Across 12 Futures Markets
Over ten years the rule took 504 trades, won 27.8% of them and finished at +64.7R with a profit factor of 1.19. The average winner was 2.93R and the average loser was 0.95R. The worst run of consecutive losing trades across the whole portfolio was 22, and the deepest peak-to-trough drawdown was 56.0R.
That is not a smooth equity curve. It is a rule that lost far more often than it won and still came out ahead, and the per-market view shows where the money actually came from.
| Market | Sector | Trades | Win rate | Avg win | Avg loss | Total | Profit factor | Max drawdown |
|---|---|---|---|---|---|---|---|---|
| Gold | Metals | 33 | 33.3% | 4.92R | -0.93R | +33.7R | 2.65 | 6.3R |
| 10-Year T-Note | Rates | 35 | 37.1% | 2.93R | -0.93R | +17.8R | 1.87 | 6.7R |
| E-mini S&P 500 | Equity index | 33 | 42.4% | 2.33R | -0.89R | +15.7R | 1.93 | 5.6R |
| E-mini Nasdaq-100 | Equity index | 39 | 35.9% | 2.37R | -0.96R | +9.2R | 1.38 | 4.7R |
| Silver | Metals | 48 | 18.8% | 5.65R | -1.08R | +8.6R | 1.20 | 15.3R |
| Corn | Grains | 43 | 27.9% | 3.02R | -0.94R | +7.0R | 1.24 | 12.8R |
| WTI crude oil | Energy | 39 | 28.2% | 2.64R | -0.87R | +4.8R | 1.20 | 10.1R |
| Copper | Metals | 47 | 23.4% | 3.26R | -1.00R | 0.0R | 1.00 | 18.1R |
| Japanese yen | Currencies | 43 | 32.6% | 1.88R | -0.97R | -1.9R | 0.93 | 14.1R |
| British pound | Currencies | 46 | 19.6% | 2.56R | -0.85R | -8.4R | 0.73 | 11.2R |
| Euro FX | Currencies | 48 | 20.8% | 2.65R | -0.94R | -9.2R | 0.74 | 15.6R |
| 30-Year T-Bond | Rates | 50 | 24.0% | 1.98R | -0.95R | -12.5R | 0.65 | 15.9R |
In this guide's own backtest, seven markets made money, copper finished flat and four lost. Gold and the 10-Year T-Note together produced +51.5R, which is 79.6% of the total. Take gold out and the portfolio total falls from +64.7R to +31.0R.
The two Treasury contracts show how fragile a single-market result is. The 10-Year T-Note was the second-best market and the 30-Year T-Bond was the worst, even though both track US interest rates. Same rule, same sector, close cousins, opposite results.
Trend following results by sector
Grouped by sector, the twelve-market trend following test gives a clearer pattern.
| Sector | Markets | Trades | Win rate | Total | Profit factor | Max drawdown |
|---|---|---|---|---|---|---|
| Metals | 3 | 128 | 24.2% | +42.3R | 1.43 | 26.8R |
| Equity index | 2 | 72 | 38.9% | +24.9R | 1.61 | 10.1R |
| Grains | 1 | 43 | 27.9% | +7.0R | 1.24 | 12.8R |
| Rates | 2 | 85 | 29.4% | +5.2R | 1.09 | 20.3R |
| Energy | 1 | 39 | 28.2% | +4.8R | 1.20 | 10.1R |
| Currencies | 3 | 137 | 24.1% | -19.5R | 0.80 | 26.5R |
Currencies were the weakest group in this window, and all three lost. If you had tested this rule only on euro FX, you would have thrown it away. If you had tested it only on gold, you would have overrated it badly. Trend following makes a portfolio claim, not a single-market claim, and the evidence for it only shows up across many markets.
Related lesson: Diversification
Entry Timing for Trend Trades
Trend following entries come in three main forms: buy the breakout, buy the pullback, or wait for a moving average signal. Each one trades off how early you get in against how often you are wrong.
The breakout lookback is the main dial. A shorter lookback gets in earlier and gets faked out more often. Each version was run with an exit lookback half as long as the entry.
| Entry lookback | Exit lookback | Trades | Win rate | Avg win | Total | Profit factor | Max drawdown | Worst losing run | Profitable markets |
|---|---|---|---|---|---|---|---|---|---|
| 20 sessions | 10 sessions | 996 | 31.9% | 1.79R | +22.4R | 1.04 | 43.4R | 22 | 7 of 12 |
| 50 sessions | 25 sessions | 504 | 27.8% | 2.93R | +64.7R | 1.19 | 56.0R | 22 | 7 of 12 |
| 100 sessions | 50 sessions | 308 | 20.8% | 5.20R | +93.9R | 1.39 | 62.1R | 22 | 9 of 12 |
| 200 sessions | 100 sessions | 178 | 16.9% | 8.56R | +109.9R | 1.75 | 45.4R | 38 | 7 of 12 |
Faster was not better, even though it feels better, because a short lookback gets you in closer to where the move started and you miss less of the chart you are staring at. The 20-session version traded almost twice as often as the 50-session version and kept about a third of the total. The 200-session version made the most with the fewest trades, but it won only 16.9% of the time and once lost 38 trades in a row. Few people could keep following a rule through a run like that.
Two honest caveats. These are in-sample results: choosing the best row after seeing the table is how a backtest becomes a story. And ten years is a short sample for a slow system, since the 200-session rule averaged fewer than 18 trades a year across all twelve markets.
Breakout versus a moving average cross
A 50-session and 200-session simple moving average crossover is the other classic trend entry. It was tested with the same 2-ATR initial stop, entering at the next open after a cross and exiting on the opposite cross.
| Entry method | Trades | Win rate | Avg win | Total | Profit factor | Max drawdown | Mean hold |
|---|---|---|---|---|---|---|---|
| 50-session breakout | 504 | 27.8% | 2.93R | +64.7R | 1.19 | 56.0R | 34.5 sessions |
| 50 and 200 SMA cross | 135 | 14.1% | 7.73R | +34.4R | 1.31 | 30.1R | 67.5 sessions |
The crossover traded far less, won only one trade in seven, and held its winners much longer. It made about half the total with about half the drawdown. Neither method is "right"; they suit different tolerances for losing streaks and different amounts of patience.
Pullback entries and the long side
Pullback entries try to buy a dip inside a trend that is already confirmed, which can mean a tighter stop and a better price. They also answer the most common complaint about breakouts, which is that buying a fresh high feels like chasing. The trade-off is that the strongest trends often never pull back far enough to fill the order, and those are the trades that pay for everything else. A pullback trader has to accept missing some of the biggest moves.
One more entry finding is worth knowing. Long trades in this sample made +124.3R and short trades lost 59.7R. The window was mostly a rising market for stocks, gold and other commodities, and shorts in rising markets got stopped out again and again. Some trend followers trade only the long side of equity indices for this reason, but that is a bet on the future looking like the past, so test it rather than assume it.
Related lesson: Pullback trading
Stop Distance and Risk in a Trend Following System
The stop does two jobs in trend following. It caps the loss on the many trades that fail, and it defines 1R, so it also sets how many contracts you can trade. The 50-session breakout rule tested here places the stop a multiple of ATR away from entry, so the stop widens in volatile markets and tightens in quiet ones.
That rule was run on twelve futures markets from November 2016 to November 2026 with four stop distances.
| Initial stop | Trades | Win rate | Avg win | Total | Profit factor | Max drawdown | Worst losing run | Biggest win |
|---|---|---|---|---|---|---|---|---|
| 1 x ATR | 691 | 17.8% | 5.80R | +134.7R | 1.23 | 94.7R | 37 | +53.11R |
| 1.5 x ATR | 567 | 23.3% | 3.97R | +95.3R | 1.22 | 60.2R | 24 | +35.41R |
| 2 x ATR | 504 | 27.8% | 2.93R | +64.7R | 1.19 | 56.0R | 22 | +26.56R |
| 3 x ATR | 432 | 34.7% | 1.93R | +49.0R | 1.20 | 29.5R | 17 | +17.70R |
Read that table carefully, because R changes size between rows. With a 1-ATR stop, 1R is half the price distance it is with a 2-ATR stop, so the same move earns twice as many R. The fair comparison is profit factor and drawdown, and on those the four stops were close: profit factor between 1.19 and 1.23.
What changed a lot was the ride. The tight stop lost 37 trades in a row at its worst and drew down 94.7R. The wide stop won more than a third of its trades and never lost more than 17 in a row. If you risk the same dollar amount per trade, the tight stop produced the larger total, but it also demanded far more tolerance for pain. The stop you can actually stick with is worth more than the one that scored highest in a backtest.
Turning the stop into a position size
Because 1R is the stop distance, the position size follows from how much you are willing to lose per trade. If you plan to risk 1% of a $100,000 account, that is $1,000 per trade, and the number of contracts is $1,000 divided by the stop distance in dollars. When one contract already risks more than $1,000, the rule cannot be traded at that size in that contract. With a 2-ATR stop on a full-size equity index future, that is the normal case rather than the exception, which is why micro contracts matter so much to trend followers with smaller accounts.
Related lesson: Average true range (ATR)
How a Trend Following Exit Gives Back Profit
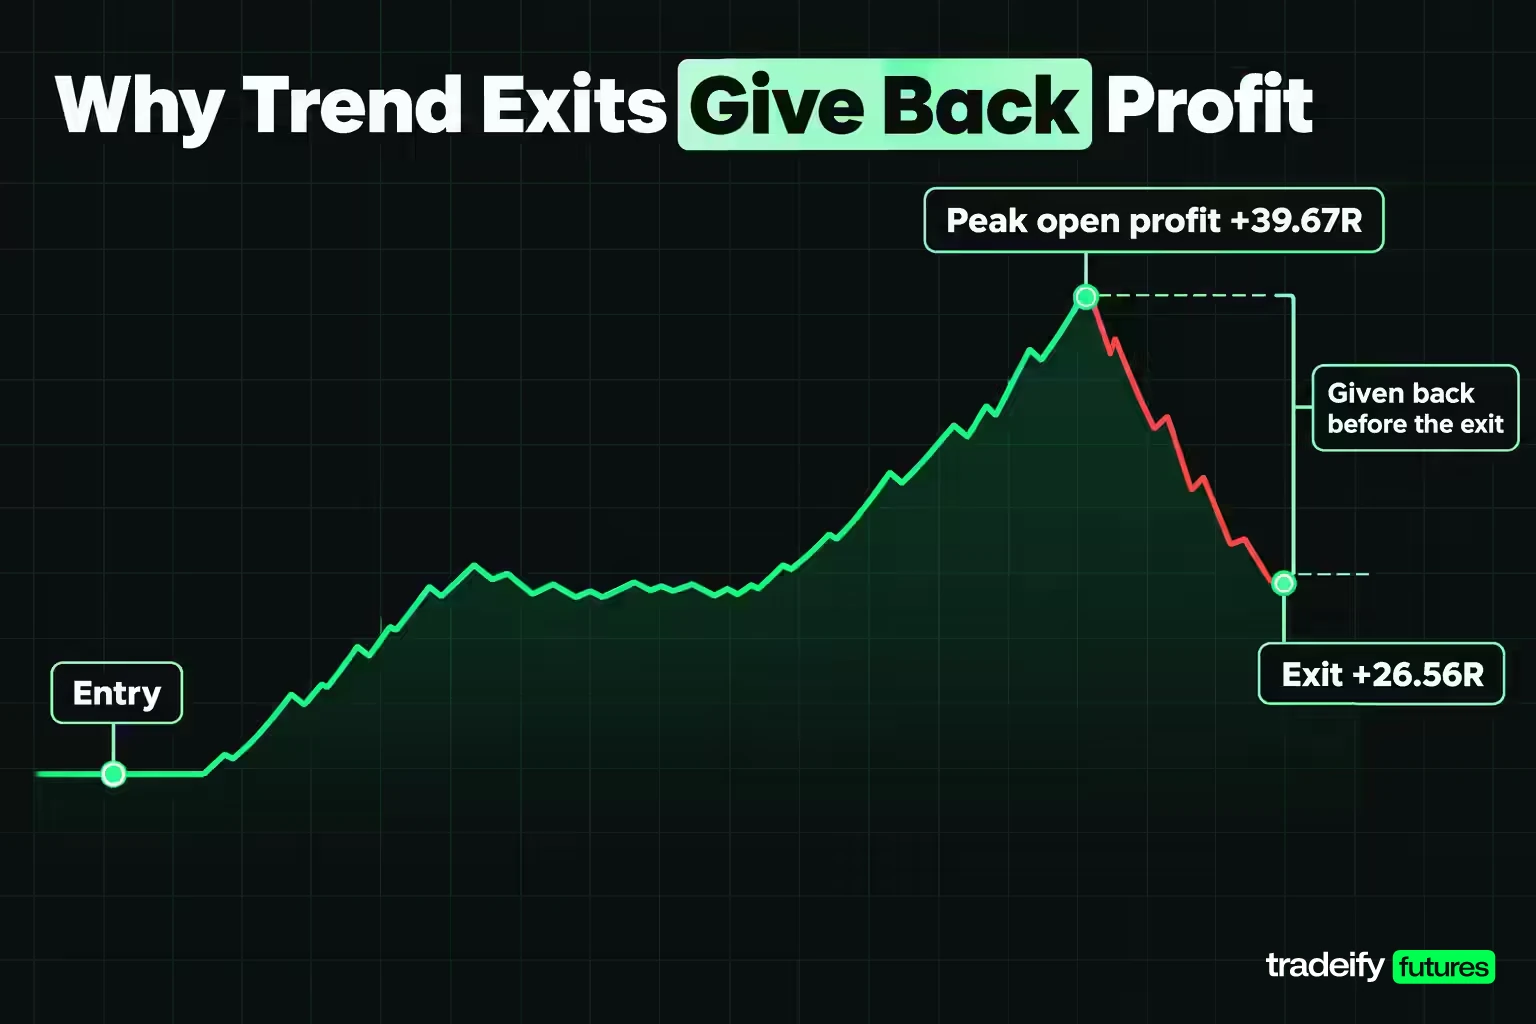
A trend following exit waits for the trend to end instead of guessing where it will end. That is why the rule catches the giant moves, and also why it always hands some of the profit back. The best trade in the sample, a long in gold, shows the trade-off at full scale.
Gold closed at 2,770.90 on January 22, 2025, above the highest high of the prior 50 sessions (2,762.00). The 14-session ATR was 35.55, so the 2-ATR risk was 71.10 points. The trade entered at the next open, 2,765.90, with the stop at 2,694.80. The worst the position got in its first weeks was a low of 2,732.00, about 0.48R against it.
| Date | Gold close or level | Open profit | What the rule was doing |
|---|---|---|---|
| Jan 23, 2025 | 2,765.90 entry | 0R | Long at the open, stop 2,694.80 |
| Feb 28, 2025 | 2,848.50 close | +1.16R | Slow start, still close to entry |
| Apr 30, 2025 | 3,319.10 close | +7.78R | First big leg |
| Jul 31, 2025 | 3,293.20 close | +7.42R | Three months of sideways drift, no exit |
| Sep 30, 2025 | 3,873.20 close | +15.57R | Second leg |
| Dec 31, 2025 | 4,341.10 close | +22.16R | Trend intact |
| Jan 29, 2026 | 5,586.20 intraday high | +39.67R | Peak open profit |
| Jan 30, 2026 | 4,745.10 close | +27.84R | One-day drop of 573.30 points, still above the exit level |
| Mar 19, 2026 | 4,605.70 close | +25.44R | Close below the prior 25-session low of 4,809.30 |
| Mar 20, 2026 | 4,653.90 exit | +26.56R | Sold at the open |
The trade lasted 292 sessions and kept +26.56R. At the peak it had shown +39.67R, so 13.11R, or 33.0% of the best open profit, went back before the rule let go.
Look at how it felt from the inside. The first month did almost nothing. Then came three months of sideways drift that would have tempted most people to take profit. Then a single session took 573.30 points off the price, and the rule still said "hold". Every one of those moments is where a discretionary trader is most likely to step in and cut the winner short.
Trailing stops versus channel exits
Trailing stops and channel exits are the two main ways to close a trend following trade, and they fail in opposite directions. In the January 2025 gold long, a tight trailing stop would have kept more of the +39.67R peak than the channel exit's +26.56R. It would also have been hit during the flat stretch in mid-2025 or the 573.30-point drop on January 30, 2026, and most traders do not re-enter after being stopped out of a long trend. No exit keeps the whole move. You choose between giving back more at the end of a big trend and getting shaken out of more trends early, and a 25-session channel exit leans toward staying in.
Related lesson: Trailing stops
Where Trend Following Profits Come From
The profit in trend following comes from a small minority of trades. This distribution is the single most important thing to understand before you trade a trend rule.
| Trade outcome | Trades | Share of trades | R contributed |
|---|---|---|---|
| Lost or broke even | 364 | 72.2% | -345.1R |
| Won less than 3R | 95 | 18.8% | +113.9R |
| Won 3R or more | 45 | 8.9% | +295.8R |
Forty-five trades out of 504 produced 295.8R of the 409.7R that all winners earned together, which is 72.2% of the gross profit. Without them the rule loses heavily. (The three rows add to 64.6R rather than 64.7R because of rounding.)
Of the 504 trades, 308 ended at the initial stop. The losers resolved quickly, with a median hold of 11.5 sessions. The winners averaged 82.3 sessions, and the 3R-or-better group averaged 120.2 sessions. So a trend follower spends most of the time taking quick small losses and a few long stretches sitting in big winners.
That has two practical consequences. First, any habit that cuts winners short (taking profit at 2R, tightening the stop after a scary day) attacks the only part of the distribution that pays. Second, skipping signals is dangerous, because you cannot know in advance which one will be the 26R trade.
Related lesson: Win rate vs. payoff ratio
Trend Following in Ranging Markets and Across Timeframes
Trend following loses money when markets move sideways. A range produces breakouts that fail, each one costs about 1R, and they come in clusters. The calendar-year results show how uneven that makes the ride.
| Year | Trades closed | Result |
|---|---|---|
| 2017 | 44 | -19.8R |
| 2018 | 46 | +15.7R |
| 2019 | 54 | -2.2R |
| 2020 | 51 | +22.0R |
| 2021 | 47 | +35.4R |
| 2022 | 49 | +27.8R |
| 2023 | 56 | -24.4R |
| 2024 | 52 | +1.5R |
| 2025 | 45 | -12.8R |
| 2026 to Nov 4 | 60 | +21.5R |
Four of the ten years lost money and one was roughly flat. The three good years in a row, 2020 to 2022, produced +85.2R, more than the whole ten-year total. A trader who started at the beginning of 2023 was still behind on November 4, 2026, at -14.2R across the four years.
Fading the breakout instead
If trend following breakouts fail so often, why not fade them? That was tested on the same twelve futures markets from 2016 to 2026: the same 50-session breakout signal days, traded in the opposite direction, with a 2-ATR stop, a 2-ATR target and a 20-session time limit. The fade took 1,061 trades, won 47.8% of them and lost 47.2R with a 68.5R drawdown.
The fade won almost half its trades, which feels much better than trend following's 27.8%. It lost anyway, because a capped target never catches the rare runaway move that wrecks the faders and pays the trend followers. This does not prove mean reversion is useless. It shows that betting against 50-session breakouts across these markets was the wrong side of this sample.
Recognizing a ranging market
A ranging market is one where price keeps returning to the middle of a band instead of extending. The usual signs are a flat moving average that price crosses back and forth, Donchian channel lines that stop expanding, and an ADX reading below 20, which Wilder treated as no trend.
The catch for trend following is that a range is easy to see after it ends and hard to see while you are in it. Every successful trend starts from some kind of range, so a rule that refuses to trade quiet markets also skips many of the best starting points. In the twelve-market test, breakouts that fired while ADX was below 20 did at least as well as breakouts from strongly trending markets. The practical answer to ranges is position size and patience, not a filter that claims to know in advance.
Choosing a trend following timeframe
Timeframe changes the problem more than the method. On daily bars the lookback is itself a timeframe choice: in the twelve-market test a 20-session breakout held trades for a mean of 20.3 sessions, and a 200-session breakout for a mean of 73.4 sessions. Daily-bar systems hold for weeks or months, trade rarely and pay little in costs relative to the stop. AQR's research builds its trend signal from 1-month, 3-month and 12-month returns and finds positive results at each horizon. Intraday trend following uses the same logic on 5-minute or 15-minute bars, but each trend is much smaller, the stop is closer to the noise, and costs take a far larger share of every trade. The checks in this guide still apply: count the trades, look at the R distribution and size from the stop.
Related lesson: Mean reversion trading
The Psychology of Trend Following
The hardest part of trend following is not the rule. It is following the rule while it is losing, which is most of the time.
Think about what a 50-session breakout rule, tested on twelve futures markets over ten years, asked of the person running it. Lose on almost three trades out of four. Sit through 22 losses in a row at the worst point. Watch the account fall 56.0R from its high, which at a fixed 1% of starting equity per trade is a 56% drop. And then, when a trade is finally working, do nothing while it hands back a third of its peak.
Each of those moments produces a specific temptation:
- After a losing run, you start skipping signals. The one you skip is often the trade that would have paid for the run.
- After a big winner, you take profit early "just this once". That converts a 20R trade into a 3R trade.
- After a sideways stretch, you tweak the parameters to fit the last six months. Now you are trading a new, untested rule.
- After a sharp one-day drop, like the 573.30 points gold fell on January 30, 2026, you exit by hand. The trend resumes without you.
AQR's paper notes that trends may exist partly because of behavioral biases such as anchoring and herding. The same biases act on the trend follower: anchoring to the peak profit makes the give-back feel unbearable, and the urge to follow the crowd makes a losing run feel like proof the method has stopped working.
Rules that keep a trend follower on the system
None of this means you are weak if you feel the pull to override a trend following rule. It means the rule is doing exactly what it was built to do, and the feeling is part of the cost. The practical defence is to decide before the drawdown, not during it. Write down how many losses in a row and how deep a drawdown your test showed, double them, and agree in advance that anything inside that range is normal. Keep a journal of every signal taken or skipped, so you can see whether your results come from the rule or from your overrides. Automate entries and stops where your platform allows it, so the decision is not made in the moment.
Related lesson: Trading discipline
Managed Futures and the Portfolio Case for Trend Following
Most professional trend following is run by managed futures firms. In the US, a commodity trading advisor (CTA) is defined by the National Futures Association as an individual or organization that, for compensation or profit, advises others on the value of or advisability of trading futures, options on futures, retail off-exchange forex or swaps. Many CTAs run systematic trend programs across dozens of futures markets, which is why "CTA" and "trend follower" are often used almost interchangeably.
The best-known long-run study of the approach is AQR's "A Century of Evidence on Trend-Following Investing" by Brian Hurst, Yao Hua Ooi and Lasse Pedersen, published in the Journal of Portfolio Management in 2017. It simulated a trend strategy across 67 markets (29 commodities, 11 equity indices, 15 bond markets and 12 currency pairs) from 1880 to 2016, using 1-month, 3-month and 12-month trend signals. Its findings, as the authors report them:
- AQR's simulated strategy delivered positive average returns in every decade since 1880, with low correlation to stocks and bonds.
- In AQR's data it made money in 8 of the 10 largest drawdowns of a 60/40 stock and bond portfolio.
- It tended to do best in large up and down years for equities, a pattern the paper calls a "smile".
- In AQR's simulation, moving 20% of a 60/40 portfolio into the strategy reduced the maximum drawdown, lowered volatility and increased returns in the simulation.
- The strategy itself still suffered drawdowns of up to 25% that lasted for extended periods.
How managed futures funds run trend following
Managed futures is the industry name for funds that trade futures for clients, usually run by CTAs. Richard Donchian, whose channel breakout is still the classic trend entry, started Futures, Inc. in 1949, described as the first publicly managed futures fund.
A professional trend program differs from one trader's chart mostly in breadth and in how it sizes risk. AQR's simulated strategy, for example, always holds a long or short position in every market it trades. It sizes each position to target the same amount of volatility, so no single market dominates, and then scales the whole portfolio to an annualized volatility target of 10%. That is the same idea as sizing from an ATR stop, applied across dozens of markets at once.
AQR also reports that time-series momentum captures the performance of managed futures indices and manager returns, including the largest funds, over the decades when data on such funds exist. Put simply, much of what the managed futures industry earns can be explained by plain trend following.
Fees matter for anyone investing through a fund rather than trading the rule themselves. The century study charges a 2% management fee and a 20% performance fee subject to a high-water mark, which it describes as typical for hedge funds. AQR's article page also flags two issues for more recent results: far more money now running the strategy, and higher correlations across markets since the credit crisis, which reduce the diversification that trend programs depend on.
Why trend following can help a portfolio
The portfolio case rests on timing. AQR's explanation is that most bear markets have unfolded gradually, with the 10 largest 60/40 drawdowns averaging about 15 months from peak to trough, which gives a trend follower time to turn short. The same paper warns that very fast crashes, such as October 1987, can arrive before a trend system has time to reposition.
Limits of the managed futures evidence
Keep three limits of the managed futures evidence in mind. AQR's century study is a simulation with assumed costs and fees (it applies a 2% management fee and a 20% performance fee to estimate what investors would have kept), not the record of a real fund. The authors work at a firm that manages trend strategies. And a fund running 67 markets with professional execution has a very different experience from one trader running two or three contracts. A ten-year, twelve-market breakout test is a small version of the same idea, and even at that size the result depended heavily on breadth: two markets produced most of its profit.
Related lesson: Correlation risk
Costs and Position Size for Trend Following Futures
Costs matter less in trend following than in fast trading, because the stops are wide and the trades are few. The 50-session breakout rule tested on twelve futures markets from 2016 to 2026 took about 50 trades a year across all of them. To price friction, each trade was charged one tick of slippage on the way in and one on the way out, using CME's published tick values. Commissions were left out because they vary by broker.
| Market | Slippage per round turn | Median 2-ATR risk | Slippage as share of risk | Gross | Net of slippage |
|---|---|---|---|---|---|
| E-mini S&P 500 | $25.00 | $6,163 | 0.41% | +15.7R | +15.6R |
| E-mini Nasdaq-100 | $10.00 | $10,700 | 0.09% | +9.2R | +9.1R |
| WTI crude oil | $20.00 | $3,823 | 0.52% | +4.8R | +4.6R |
| Gold | $20.00 | $4,814 | 0.42% | +33.7R | +33.5R |
| Silver | $50.00 | $4,054 | 1.23% | +8.6R | +7.9R |
| Copper | $25.00 | $2,924 | 0.85% | 0.0R | -0.5R |
| Corn | $25.00 | $807 | 3.10% | +7.0R | +5.6R |
| 10-Year T-Note | $31.25 | $1,051 | 2.97% | +17.8R | +16.7R |
| 30-Year T-Bond | $62.50 | $2,482 | 2.52% | -12.5R | -13.8R |
| Euro FX | $12.50 | $1,745 | 0.72% | -9.2R | -9.6R |
| Japanese yen | $12.50 | $1,319 | 0.95% | -1.9R | -2.4R |
| British pound | $12.50 | $1,086 | 1.15% | -8.4R | -8.9R |
Slippage cut the portfolio from +64.7R to +57.9R. That is real but survivable, which is the advantage of a slow rule. The same tick of slippage would be a much bigger share of a scalper's two-point stop.
The contract-size problem
Position size is where most individual traders hit the wall. Over the ten years, the median 2-ATR stop on one E-mini S&P 500 contract was $6,163 and on one E-mini Nasdaq-100 contract $10,700. As of November 4, 2026, the E-mini S&P 500's 14-session ATR was 102.03 points, so a 2-ATR stop was 204.06 points: $10,203.00 on one E-mini (at $50 a point) or $1,020.30 on one Micro E-mini (at $5 a point).
A trader risking 1% of a $100,000 account has $1,000 per trade. On that day, not even one Micro contract fit inside the budget. The choices are to accept a larger risk per trade, use a tighter stop (which brings longer losing runs), pick calmer markets, or wait. Rounding up to one contract is how a 1% rule quietly becomes a 10% rule.
Trend following on intraday prop accounts
The daily-bar breakout rule tested in this guide is a multi-day trend following strategy: 98.6% of its trades lasted more than one session, and positions were open 58.9% of the time on average across the twelve markets. On our accounts at Tradeify, every position must be closed by 4:45 PM ET and nothing can be held overnight or over a weekend, so this daily-bar rule cannot be run on a Tradeify account as written. What does carry over is the method: a defined breakout, an ATR-based stop, size from the stop, and patience with a low win rate, applied to intraday charts within a single session.
Related lesson: Position sizing for futures contracts
A Trend Following Checklist Before You Trade It
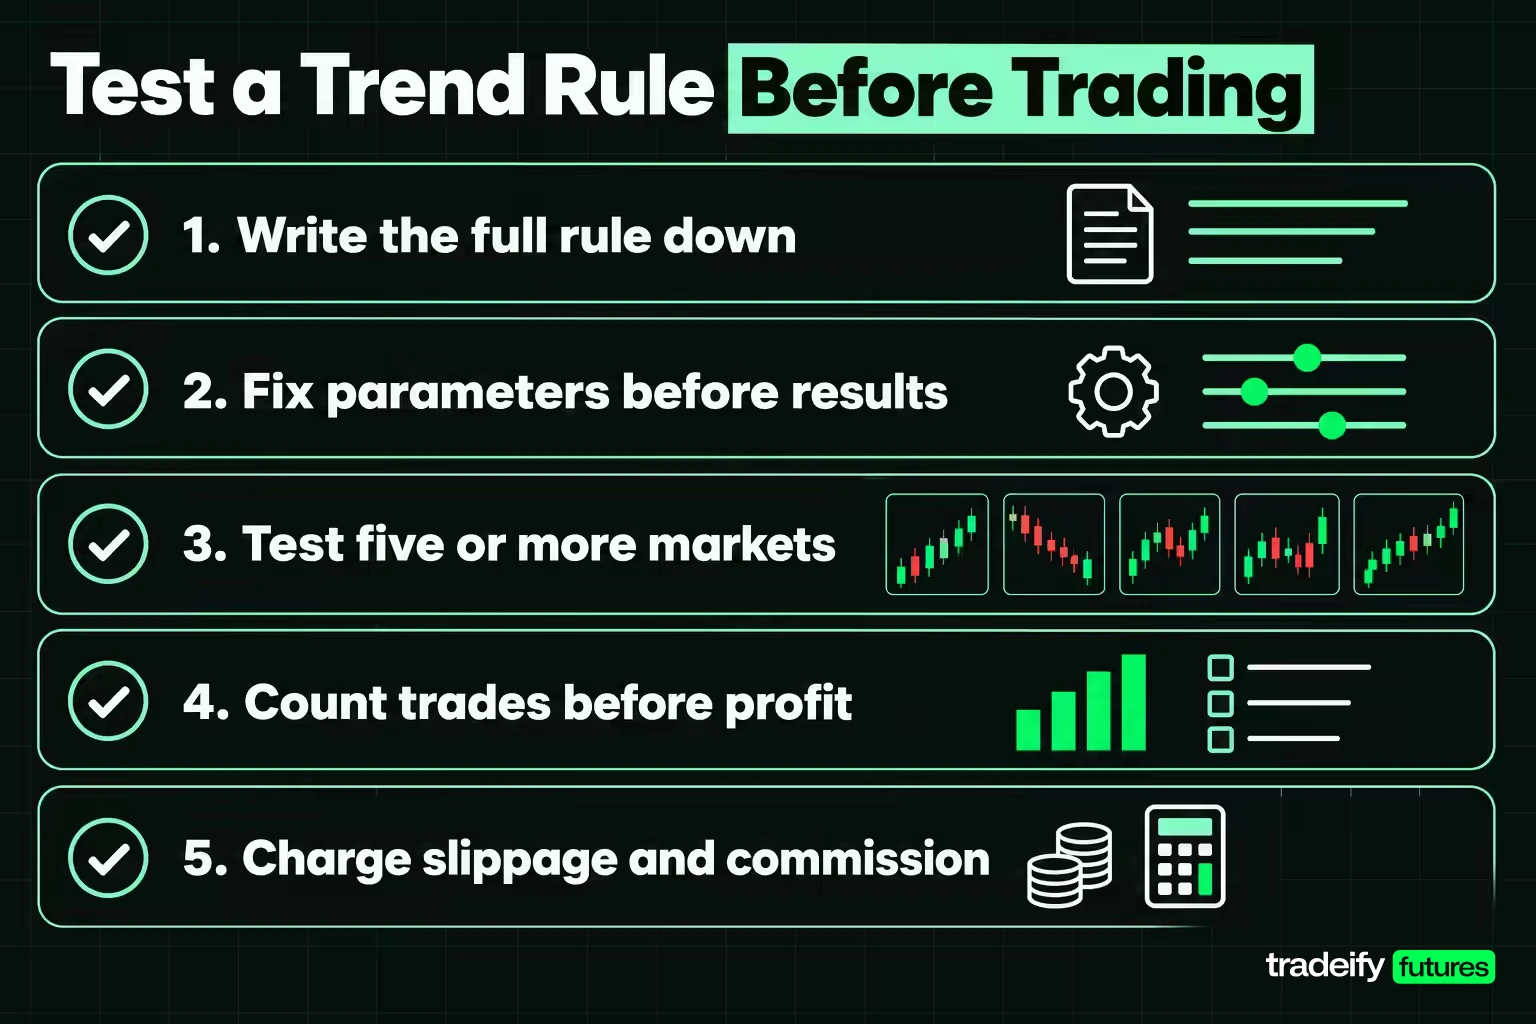
Before you put money behind any trend following rule, work through two short checklists: one to test the rule and one to decide whether you can live with it. Both take an afternoon with a spreadsheet or a charting platform's strategy tester.
Testing a trend following rule
- Write the rule down completely: signal, entry, stop, exit and position size. If a step needs judgement, it is not the rule you tested.
- Fix the parameters before you look at results, and write down why you chose them.
- Test at least five markets from different sectors. One market tells you about that market, not about trend following.
- Count the trades before you look at the profit. Under 100 trades, you have an anecdote.
- Charge slippage and commission on every trade and re-read the total.
Deciding whether to trade a trend following rule
- Find the worst losing run and the deepest drawdown in R, then decide honestly whether you would have kept going through them.
- Check that one contract fits your risk budget on every market, using today's ATR. If not, move to the micro contract or drop the market.
- Look at the R distribution, not just the total. If a few trades carry the result, plan to never skip a signal.
- Check the long and short sides separately, and each sector separately.
- Confirm your account's holding rules allow the trade length your test produced.
- Set a review date and a written condition that would make you stop, such as a drawdown twice as deep as the test showed.
Related lesson: How to keep a trading journal
Trend Following FAQ
What is trend following in simple terms?
Trend following means trading in the direction a market is already moving, after it proves the move by breaking a defined level. You cap each loss in advance and hold winners until the trend breaks, instead of aiming for a target. You expect to be wrong often and rely on a few large winners.
Does trend following still work?
Trend following still made money in this guide's ten-year backtest of a 50-session breakout on 12 futures markets, +64.7R across 504 trades, but four of ten years lost money and four of twelve markets lost. Long-run research such as AQR's century study reports positive returns in every decade since 1880, though with drawdowns of up to 25%. It works as a long-run, many-market approach, not as a reliable monthly income.
Why do trend followers lose so often?
Most breakouts fail, because markets spend much of their time moving sideways. In this guide's ten-year backtest of a 50-session breakout rule on 12 futures markets, 72.2% of trades lost or broke even and the worst losing run was 22 trades. The approach survives because its winners averaged about three times the size of its losers, and a few winners were far larger.
What is the best indicator for trend following?
There is no single best trend following indicator. A Donchian channel breakout or a moving average crossover decides direction, and ATR sets the stop and the size. In a ten-year backtest of a 50-session breakout on 12 futures markets, adding an ADX strength filter cut the drawdown but did not find better trends.
Is trend following better than buy and hold?
Neither is better in general, because they do different jobs. Buy and hold owns a market through every decline, while trend following can be short in a falling market and tends to lag at turning points. AQR's research suggests trend following is most useful as a diversifier alongside stocks and bonds, not as a replacement.
Can you use trend following in a funded account?
Yes, if the account's holding rules match the timeframe: a daily-bar trend rule holds most trades for days or weeks, so it needs an account that allows overnight positions. If the account requires every position to be closed each day, only intraday trend following fits.
Trend following and leveraged futures trading carry substantial risk of loss, including losses larger than planned when prices gap through a stop, and the backtest results here are hypothetical, exclude commissions and do not predict future results. Evaluation and funded prop-firm accounts are simulated trading environments, and nothing in this guide is investment advice or a recommendation to trade any market.


