
How to Trade the Descending Triangle with Entries & Exit Rules
TL;DR
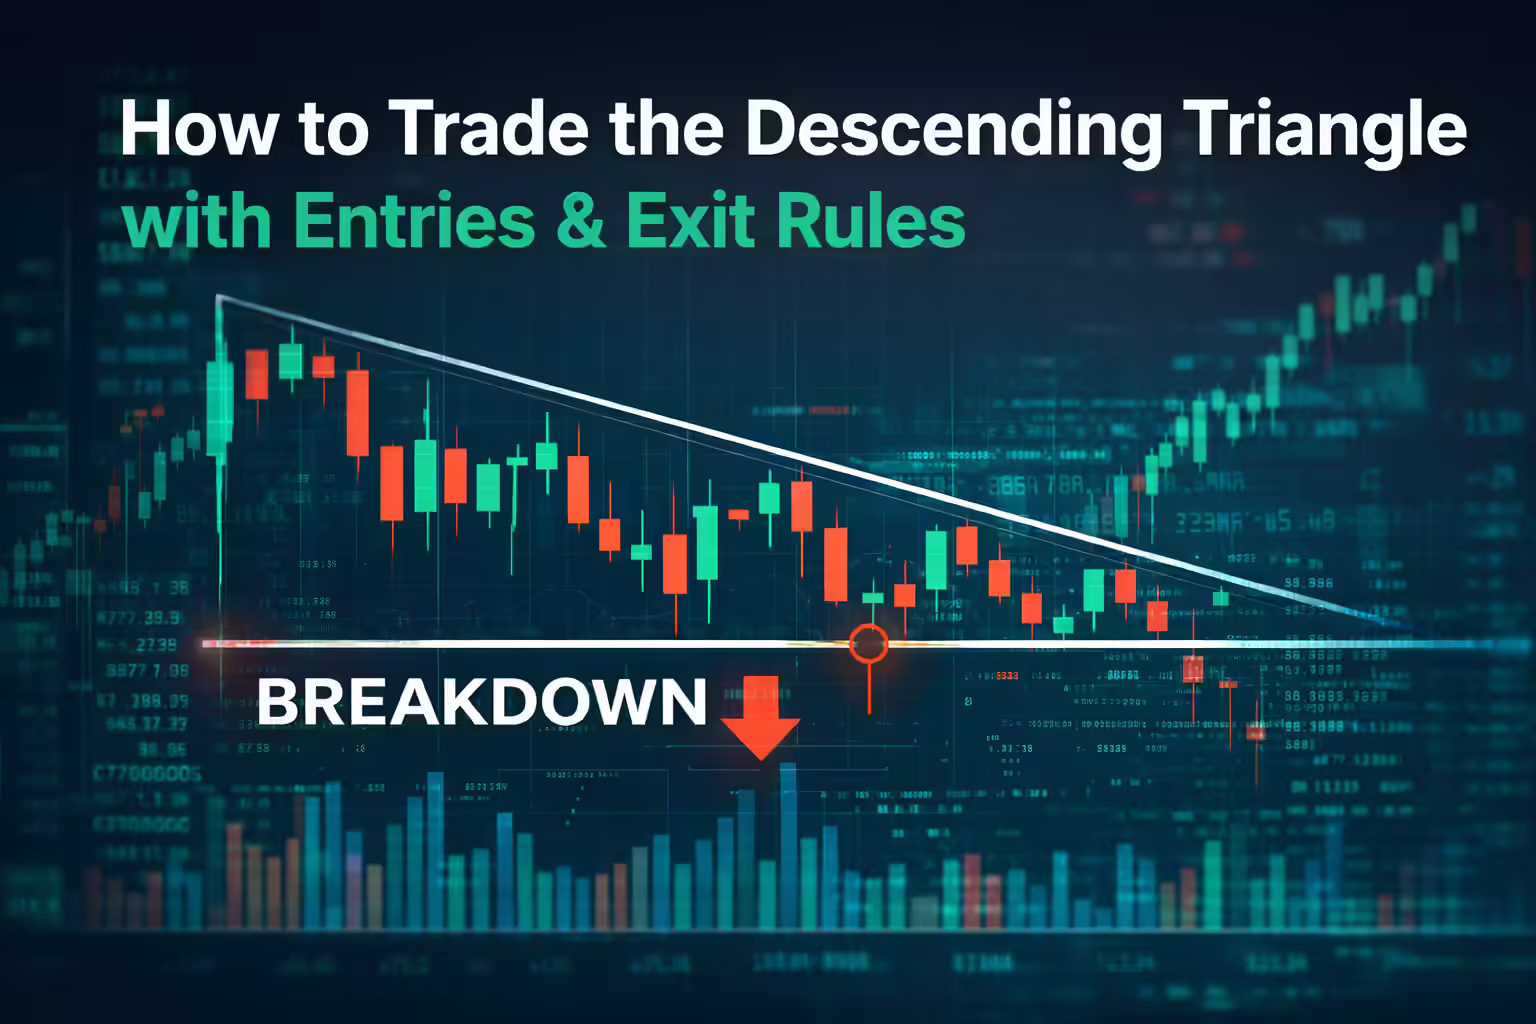
- Pattern Definition: A bearish distribution structure defined by a horizontal support line (static demand) and a descending upper trendline (aggressive supply).
- Valid Volume Profile: Volume must contract during the consolidation phase and expand by >200% above the moving average during the breakdown.
- Order Flow Mechanics: The breakdown occurs when limit buy orders at support are exhausted, followed immediately by sell-stop activation (long liquidation).
- CVD Divergence: If price breaks the low but Cumulative Volume Delta (CVD) remains flat, the move is a probable failure (absorption/bear trap).
- ES Execution: High liquidity allows Stop-Market orders with minimal slippage.
- NQ Execution: Low liquidity requires Stop-Limit orders with wide offsets (e.g., 5–10 points) to prevent adverse fills.
- Risk Parameters: Technical stop loss is placed 2–5 ticks above the most recent lower high.
- Prop Firm Constraint: Trailing drawdown rules require taking partial profits early to prevent unrealized gains from triggering liquidation thresholds during retests.
Table of Contents
- Market Microstructure of the Descending Triangle Pattern
- Structural Anatomy of the Descending Triangle
- Order Flow Mechanics in Trading the Descending Triangle
- Volume Profile and Delta Confirmation
- Asset-Specific Execution Tactics
- Proprietary Trading Rules for the Descending Triangle
- Identifying False Breakouts
- Comparative Patterns
- Risk Management
- Final Thoughts
Market Microstructure of the Descending Triangle Pattern
In the competitive environment of futures prop firm trading, specifically within the liquid markets of the E-mini S&P 500 (ES) and the Nasdaq-100 (NQ), chart patterns act as the visible footprint of inventory adjustment. The descending triangle pattern represents a specific negotiation between buyers and sellers. It visualizes a market transitioning from a state of temporary balance to one of decisive imbalance, typically favoring the sell-side.
Institutional traders view this formation through the lens of Auction Market Theory. It reveals a sequence where sellers aggressively lower offer prices to secure liquidity while buyers remain passive and absorb inventory only at a fixed price level. This dynamic creates potential energy. As time progresses and the trading range narrows, the tension between aggressive supply and passive demand reaches a critical inflection point. This report analyzes the descending triangle setup, focusing on order flow mechanics, execution for specific contracts, and risk management protocols.
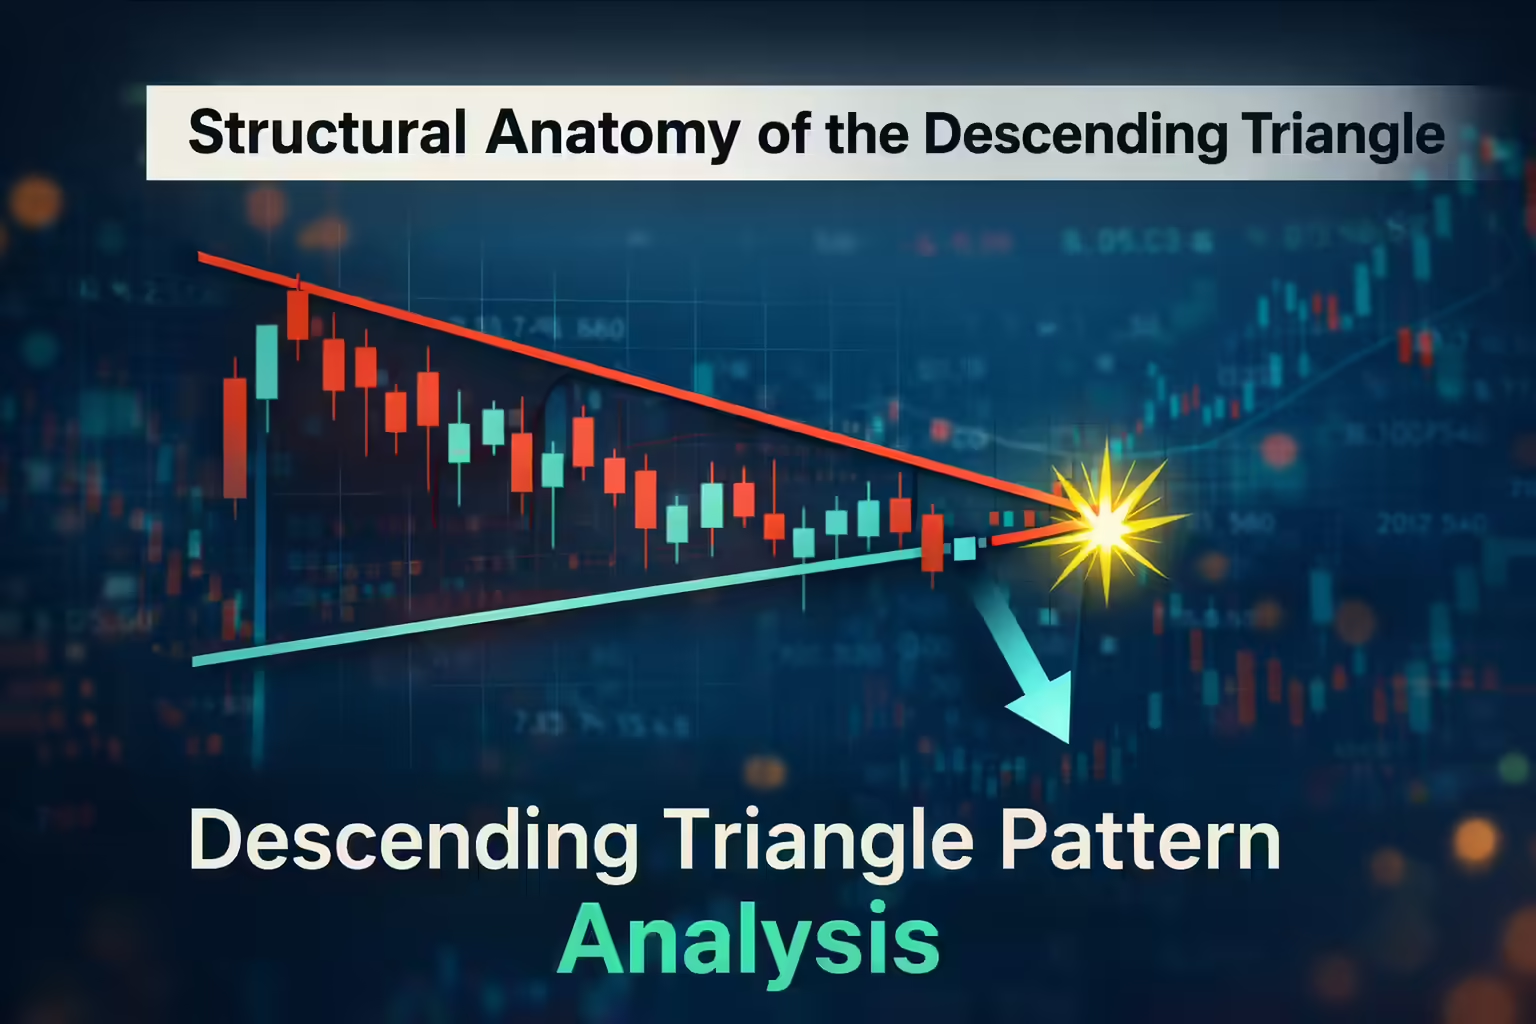
Structural Anatomy of the Descending Triangle
Identifying the Descending Triangle Pattern
The identification of a descending triangle pattern relies on the convergence of two trendlines. The lower trendline is horizontal and connects a series of swing lows that terminate at the same price level. This line represents a distinct price point where buyers perceive value or where a large participant works a limit order to accumulate a position. This horizontal support acts as a floor and temporarily arrests the price decline.
The descending upper trendline connects a series of lower highs. This slope indicates that with each rally attempt, buyers exhaust their capital earlier. Sellers step in more aggressively at lower prices to liquidate inventory. The inability of the market to revisit previous highs suggests that the fair value perception of the asset is migrating downward. Sellers are motivated to accept lower prices to ensure execution.
Timeframe Duration for Trading the Descending Triangle
The reliability of the descending triangle pattern correlates with duration and the timeframe. In the fractal geometry of futures markets, this structure repeats across all scales. However, the implications differ. Patterns on 4-hour or Daily charts generally carry higher predictive weight regarding the magnitude of the subsequent move. A pattern building for weeks represents a massive accumulation of inventory.
For the intraday trader operating in the ES or NQ, the descending triangle pattern is valid on 30-minute or 15-minute charts. These often serve as the setup for an intraday trend day. A triangle forming during the overnight Globex session often sets the stage for a breakout at the New York open. Traders must be cautious of micro-triangles on 1-minute charts during low-volume periods as these are susceptible to algorithmic noise.
Volume Analysis in the Descending Triangle
Volume analysis validates the structural integrity of the descending triangle pattern. In a standard formation, trading volume contracts as the pattern matures. This decrease indicates the current consolidation is running out of energy and a new influx of participation is required to break the deadlock.
If volume increases while the price remains trapped inside the triangle, it serves as a warning. High volume within the consolidation suggests premature absorption or hidden accumulation, raising the risk of a false breakout. The breakdown event itself requires a visible spike in volume. This surge confirms that static support has been consumed and that new sellers are entering the market. Without this volume spike, a breakdown is liable to fail.

Order Flow Mechanics in Trading the Descending Triangle
Absorption Dynamics at the Base
Effective trading of the descending triangle pattern requires analyzing the order flow. The flat support level is a functional zone of absorption within the order book. In Auction Market Theory, the horizontal support level represents a price point where passive buyers execute limit orders to absorb selling pressure.
As sellers execute market sell orders to drive the price down, the price does not displace lower because a large inventory of buy limit orders constantly refills the bid stack. On a footprint chart, this appears as high executed volume at a specific price node without corresponding price displacement. The pattern exists because this buying interest is finite. When the inventory of limit buy orders depletes, the floor disappears. The market must drop to find a new price where buyers are willing to participate.
Aggressive Selling at the Trendline
The descending upper trendline represents the behavior of aggressive sellers. Every time the market attempts to rotate higher, sellers enter with market orders or lower their limit offers. This forces the price down before it reaches the previous peak. This behavior signals a shift in valuation. Sellers are eager to exit positions and value the asset lower over time. This aggression at the ask eventually overwhelms the passive absorption at the bid.
Breakdown Mechanics of the Descending Triangle Pattern
When a descending triangle breakdown occurs, it is usually a sharp move caused by two order flow events. First, traders who accumulated long positions at the support level place sell-stop orders just below that support. As the price ticks below the line, these stops trigger and become market sell orders.
Second, momentum algorithms detect the breach of the key level and enter with new short positions. This combination of long liquidation and new selling pressure creates a liquidity vacuum below the support level. With no buy limit orders left to absorb the flow, the price gaps down significantly to find the next interested buyer.
Volume Profile and Delta Confirmation
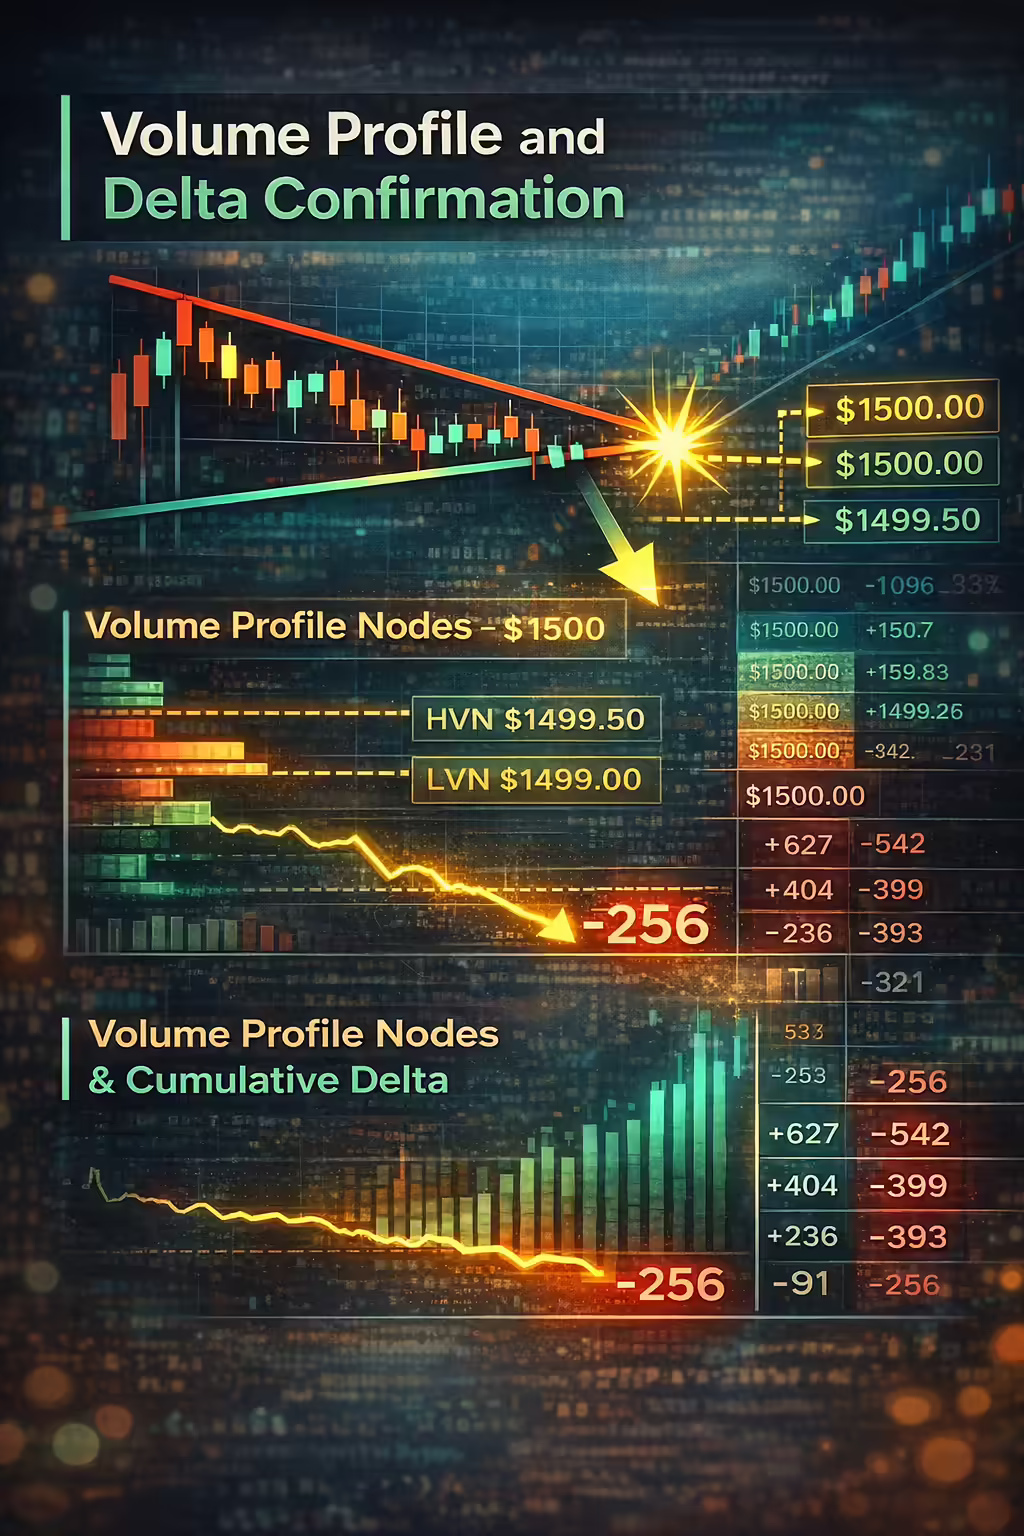
Volume Profile Nodes in the Descending Triangle
Modern trading leaves footprints decoded by Volume Profile analysis. The Point of Control (POC) or High Volume Nodes (HVN) represent areas of fair value where the market transacted heavy volume. If the price breaks down from a descending triangle pattern and attempts to re-enter the range, the HVN often acts as a magnet. If the price accepts back into the HVN, the breakdown has likely failed.
Low Volume Nodes (LVN) represent prices where little trading occurred. When a triangle breaks, the price often accelerates through LVNs because there is little historical liquidity to stop it. Traders use LVNs from previous sessions as profit targets, anticipating that price will fill these vacuums rapidly before pausing at the next HVN.
CVD Confirmation for the Breakdown
Cumulative Volume Delta (CVD) measures the difference between aggressive buying and aggressive selling. In a valid descending triangle breakdown, the price drops and the CVD drops simultaneously. This confirms that aggressive sellers are driving the move.
If the price breaks the support line but the CVD remains flat or rises, it indicates an anomaly. This divergence suggests that while the price is dropping, aggressive selling is not the primary driver. Limit orders may be pulled (spoofing) or iceberg buyers are absorbing the selling pressure. This serves as a trap signal suggesting an imminent reversal.
Asset-Specific Execution Tactics
Liquidity Profiles in ES
The E-mini S&P 500 (ES) maintains tight bid-ask spreads even during high volatility periods. Depth at the best bid and offer is substantial. This makes the ES forgiving for descending triangle breakdown entries using Stop-Market orders.
Liquidity Profiles in NQ
The Nasdaq-100 (NQ), while highly liquid in absolute volume terms, demonstrates lower relative depth. Spreads can widen during fast market conditions. For descending triangle breakouts in the NQ, traders must use Stop-Limit orders with a sufficient offset to avoid adverse fills during the initial volatility spike.
Entry Timing Variations
Traders have three primary entry strategies when trading the descending triangle pattern. The first is the immediate breakdown entry, executing as the price breaches the horizontal support. This approach maximizes profit potential but also exposes the trader to the risk of a bear trap.
The second strategy is the confirmation entry, which waits for the breakdown candle to close below support and for a subsequent candle to retest the broken support (now acting as resistance). If the price fails to reclaim the support level, it confirms the breakdown. This method filters out false breaks but sacrifices some profit potential.
This method offers a better Risk:Reward ratio because the stop loss is placed just above the rejection candle. It confirms the validity of the breakdown. The disadvantage is the risk of missing the trade. Strong trends often break and accelerate without offering a retest.
Anticipatory Positioning Within the Pattern
Advanced traders may enter within the descending triangle pattern, near the upper trendline, rather than waiting for the breakdown. If the pattern fails and breaks upward, the stop loss is small. If the pattern breaks downward, the profit potential increases because the entry is higher. The risk is that support might hold indefinitely, leading to a prolonged range trade.
Proprietary Trading Rules for the Descending Triangle
Managing Trailing Drawdown
Traders operating within proprietary trading programs face specific challenges when trading the descending triangle pattern. Most funded accounts enforce a Trailing Drawdown rule where the maximum loss limit trails the account's highest unrealized profit.
If a trade drops 40 points in favor of the trader, the trailing drawdown moves up. A sharp volatility snap-back could hit this new limit, liquidating the account even if the trade eventually works. Traders must modify their strategy by taking partial profits aggressively to lock in gains or using tighter trailing stops to protect the drawdown buffer.
Position Sizing for Prop Firm Accounts
In the evaluation phase, traders often use maximum buying power. However, the descending triangle breakdown is a high-volatility event. Using full sizing can lead to failure if slippage occurs. Risk should be calculated based on the drawdown buffer, not the account balance.
A 1% risk on a $50,000 account balance is $500, but this might represent 25% of the allowable drawdown. This aggressive sizing makes the setup dangerous for prop traders. A sustainable approach risks 1% to 2% of the drawdown, necessitating the use of Micro contracts (MES/MNQ) during the evaluation phase.
End-of-Day Drawdown Calculation
Some firms utilize an End-of-Day drawdown calculation. This model provides more flexibility for managing the descending triangle pattern through intraday volatility. The drawdown limit only recalculates at the end of each trading day based on your closing balance, rather than tracking every price movement in real-time. This gives traders room to manage positions through retest phases and volatility spikes without triggering immediate liquidation from temporary intraday swings.
Identifying False Breakouts
Mechanics of the Bear Trap
The "Bear Trap" exploits the predictability of the descending triangle pattern. Institutional traders know retail sell-stops cluster below the horizontal support. A large player may intentionally push the price through support to trigger these stops.
The triggering of sell stops creates a flood of market sell orders. The institution absorbs this panic selling with a large buy limit order. Once their liquidity needs are met, they withdraw suppression. The price rallies sharply, forcing short sellers to buy to cover, which fuels the rally.
Recovery Protocols for Failed Breakdowns
If caught in a bear trap while trading the descending triangle, capital preservation is the priority. If the price breaks down and then rapidly reclaims the support level by closing back inside the triangle, the breakdown premise is flawed.
The short position must be closed immediately. Some traders reverse their position, going long as the price re-enters the triangle. The target becomes the upper trendline or a full breakout to the upside, fueled by the trapped shorts.
Comparative Patterns: Descending Triangle vs. Similar Formations
Descending Triangle vs. Falling Wedges
Distinguishing the descending triangle pattern from falling wedges is critical. While both feature descending upper trendlines, the lower boundary differs. The descending triangle has a flat, horizontal lower trendline, indicating a bearish bias where sellers are aggressive but buyers are static.
The falling wedge features two converging trendlines that both slope down. The lower trendline slopes downwards, meaning buyers are stepping in at lower lows. This is a bullish reversal pattern. Confusing a falling wedge for a descending triangle can lead to shorting into a powerful bullish reversal.
Descending Triangle vs. Bear Pennants
The Bear Pennant is a short-term continuation pattern formed after a sharp, nearly vertical drop. The consolidation is brief and symmetrical. It represents a pause in a market crash.
The pennant forms faster than the descending triangle pattern. Pennants often resolve in days or hours, while triangles take weeks or days. The pennant indicates extreme momentum and panic, whereas the triangle indicates a grinding distribution process. Pennants generally target a measured move equal to the length of the preceding drop.
Risk Management for Trading the Descending Triangle
Stop Loss Placement
The standard technical stop loss for a descending triangle trade is placed just above the most recent lower high or above the high of the breakdown candle. If the price rallies back above the upper trendline, the structural premise is invalidated. Traders should add a buffer of ticks to account for market noise and stop hunts.
Targets and Risk:Reward Ratios
The classical target for the descending triangle pattern is calculated by measuring the widest vertical height of the triangle and projecting that distance downward from the breakout point. A more sophisticated method targets the next High Volume Node (HVN) below the breakdown.
Traders must ensure the trade offers at least a 1:2 or 1:3 Risk:Reward ratio. If the support is at 4000 and the technical stop is at 4010, the realistic target must be at least 3980. If the next support level is too close, the trade should be skipped regardless of the pattern quality.
Final Thoughts on Trading the Descending Triangle
The descending triangle pattern is a potent tool, but it presents risks. Novice traders may encounter slippage and bear traps. Professional traders who understand auction mechanics (the exhaustion of passive buyers and the aggression of active sellers) utilize it as a high-probability setup.
Success requires identifying the structure through fractal timeframes, confirming order flow via volume profile, and selecting the appropriate execution based on the asset. The market rewards those who understand the liquidity dynamics behind the lines. Key takeaways include verifying institutional intent through volume, choosing Stop-Market orders for ES and Stop-Limit for NQ, and adhering to strict drawdown rules in proprietary trading environments.
.svg)
.svg)
.svg)


.webp)

