.svg)

.svg)
.svg)

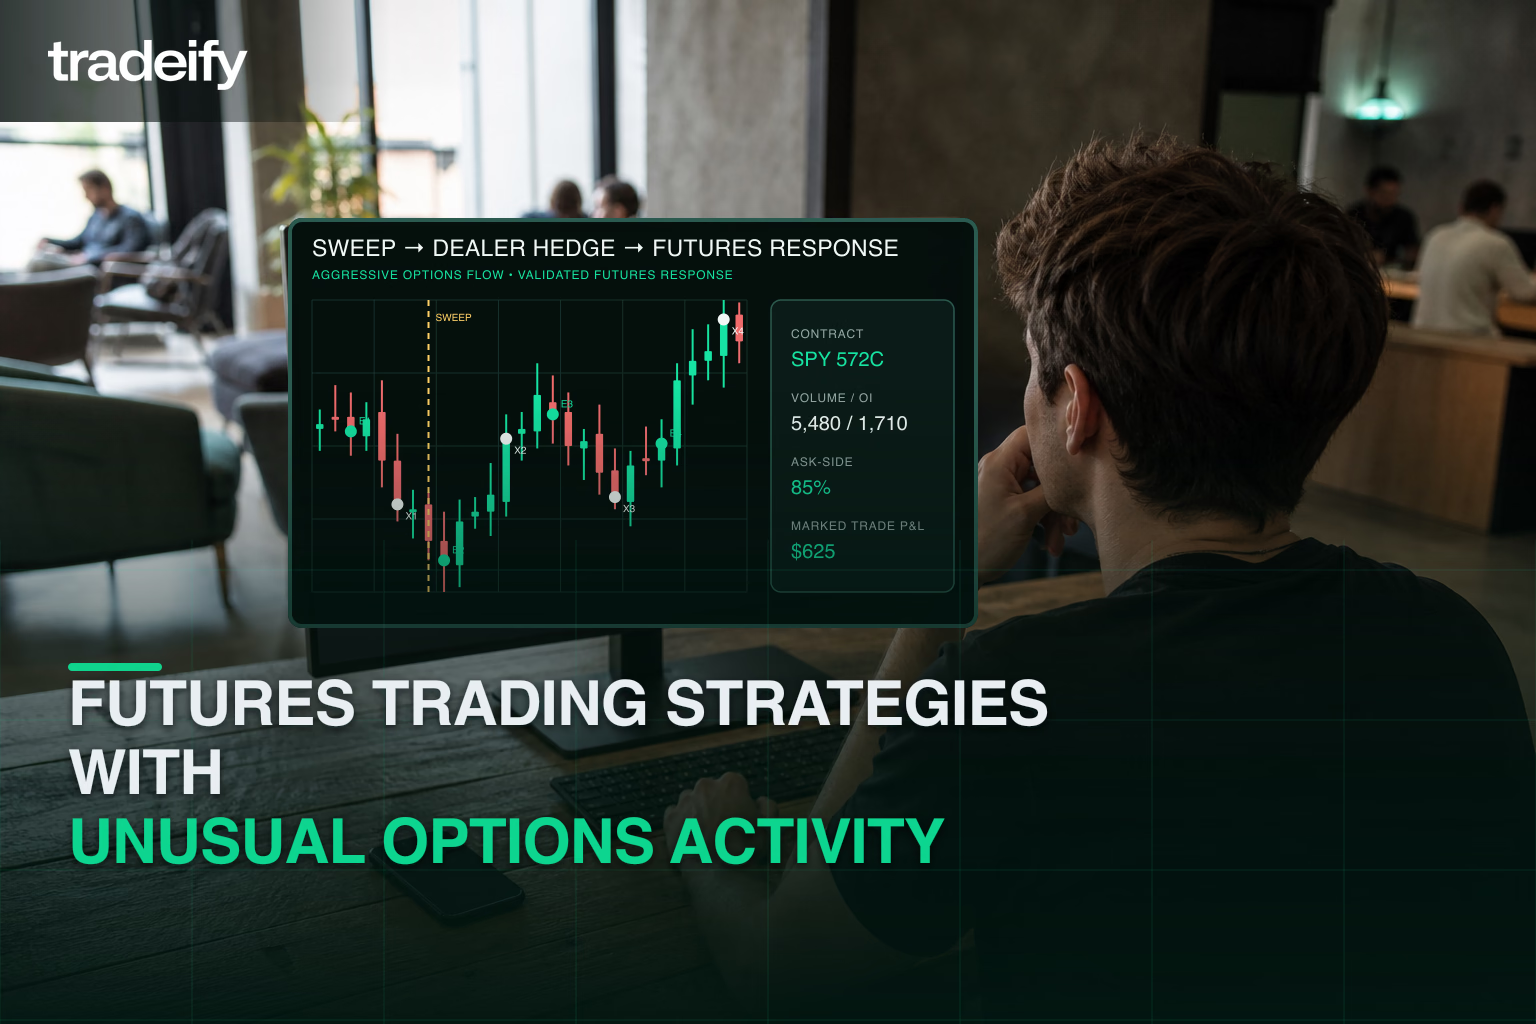


TL;DR: Retail traders can overcome institutional information asymmetry by tracking unusual options activity in major ETFs like SPY and QQQ using WealthCharts' OptionsHunter within the Tradeify ecosystem. Traders identify aggressive sweep orders and confirm them with technical indicators like the Champion Trend to predict and capitalize on subsequent ES and NQ futures movements. This approach provides a directional edge and integrates the strict risk management protocols required to pass proprietary trading evaluations.
Predicting futures moves with unusual options activity via WealthCharts
This futures trading strategy shows how retail traders can use unusual options activity—specifically institutional sweep orders and high-volume anomalies in major ETFs like SPY and QQQ—as a leading predictive indicator for ES and NQ index futures moves. Through the WealthCharts integration in the Tradeify proprietary trading ecosystem, traders access the institutional-grade OptionsHunter scanner to detect directional smart money flows and mandatory market-maker hedging in real-time. Paired with technical confirmation tools like the Champion Trend indicator and Inventory Retracement Bars, alongside Tradeify's risk monitoring for trailing drawdowns and daily loss limits, this workflow closes the information gap so prop traders can execute high-probability, cross-asset setups.

Overcoming information asymmetry in futures markets
In futures trading, information is everything. Institutions historically had deep visibility into order flow and derivatives positioning while retail traders relied on lagging technical indicators. Today, retail traders can access the same data. The integration of WealthCharts into Tradeify gives prop traders a direct look at options flow to predict moves in the futures market. This report covers the mechanics of options flow, the link between derivatives and futures pricing, and a practical workflow for Tradeify users.
Where can I find unusual options activity? Scanner roundup
Several scanners surface unusual options activity at different price points. Most of these tools focus on equity and ETF options rather than options on futures contracts, but their signal flow is still highly relevant to futures traders because dealer hedging in SPY and QQQ options chains directly drives ES and NQ futures price action. Choose the tool that matches your data needs, latency tolerance, and budget.
- Barchart Unusual Options Activity — a free daily report that ranks contracts by volume-to-open-interest ratio. Useful for end-of-day review and broad screening, but the data is delayed and lacks sweep tagging or sentiment color-coding (source).
- MarketChameleon Options Volume — a paid scanner with deeper analytics including volume vs average, implied volatility ranks, and earnings-week filters. Better for swing setups than intraday flow chasing (source).
- Unusual Whales — a paid real-time flow feed popular for sweep alerts, dark pool prints, and community-driven signals. Strong for intraday speculation, but the volume of alerts requires its own filtering discipline (source).
- WealthCharts OptionsHunter (Tradeify) — a real-time scanner included with Tradeify's WealthCharts integration. It tags sweeps, golden sweeps, and split orders, color-codes ask vs bid sentiment, and surfaces the proprietary Heat Index. The advantage for futures traders is that it sits inside the same platform as the ES and NQ execution stack, removing context-switching between flow scanner and trade ticket.
For Tradeify prop traders, the most workflow-efficient choice is OptionsHunter because flow signals and futures execution live in one workspace. Traders who want a free starting point can begin with Barchart and layer OptionsHunter in for real-time confirmation. Scanner pricing and feature sets change frequently — verify each vendor's current capabilities before committing to a paid tier.
The mechanics of unusual options activity

The options market often drives the underlying asset. When institutions take massive positions in options contracts, market makers have to hedge their exposure by buying or selling the underlying asset or its futures equivalent. This mandatory hedging activity drives price movement.
Block trades vs sweep trades
Unusual options activity comes in two main forms. Block trades are single, large orders filled at one venue, often pre-arranged between an institution and a market maker. They suggest a position-taking decision but not necessarily urgency. Sweep trades are large orders split across multiple exchanges and executed simultaneously to fill as fast as possible. Sweeps signal urgency — the buyer is paying for speed because they believe a move is imminent. For directional prediction, sweeps are the higher-conviction signal; isolated block trades are more often hedges or rolls.
Defining unusual options activity
Unusual activity involves statistical anomalies that suggest high conviction. Identify it by comparing volume to open interest: when the daily volume of a specific strike exceeds its current open interest, traders are aggressively opening new positions. Watch for sweep orders, exceptionally large orders broken into smaller blocks and executed across multiple exchanges to fill rapidly while hiding the footprint. The Heat Index is a proprietary WealthCharts metric that quantifies trade momentum by analyzing whether trades hit the bid (bearish) or the ask (bullish). A high Heat Index means institutions are willing to pay a premium to enter immediately.
The smart money premise behind options activity
Institutions like hedge funds and major banks rarely use options to gamble. For directional bets, a fund expecting a positive earnings surprise may purchase thousands of out-of-the-money calls for capital efficiency and leverage. For hedging, a fund holding a long equity portfolio may buy puts ahead of a feared crash — and the dealer hedging required to facilitate that trade involves selling futures, creating immediate bearish pressure on the broader market.
Key metrics to read in unusual options activity
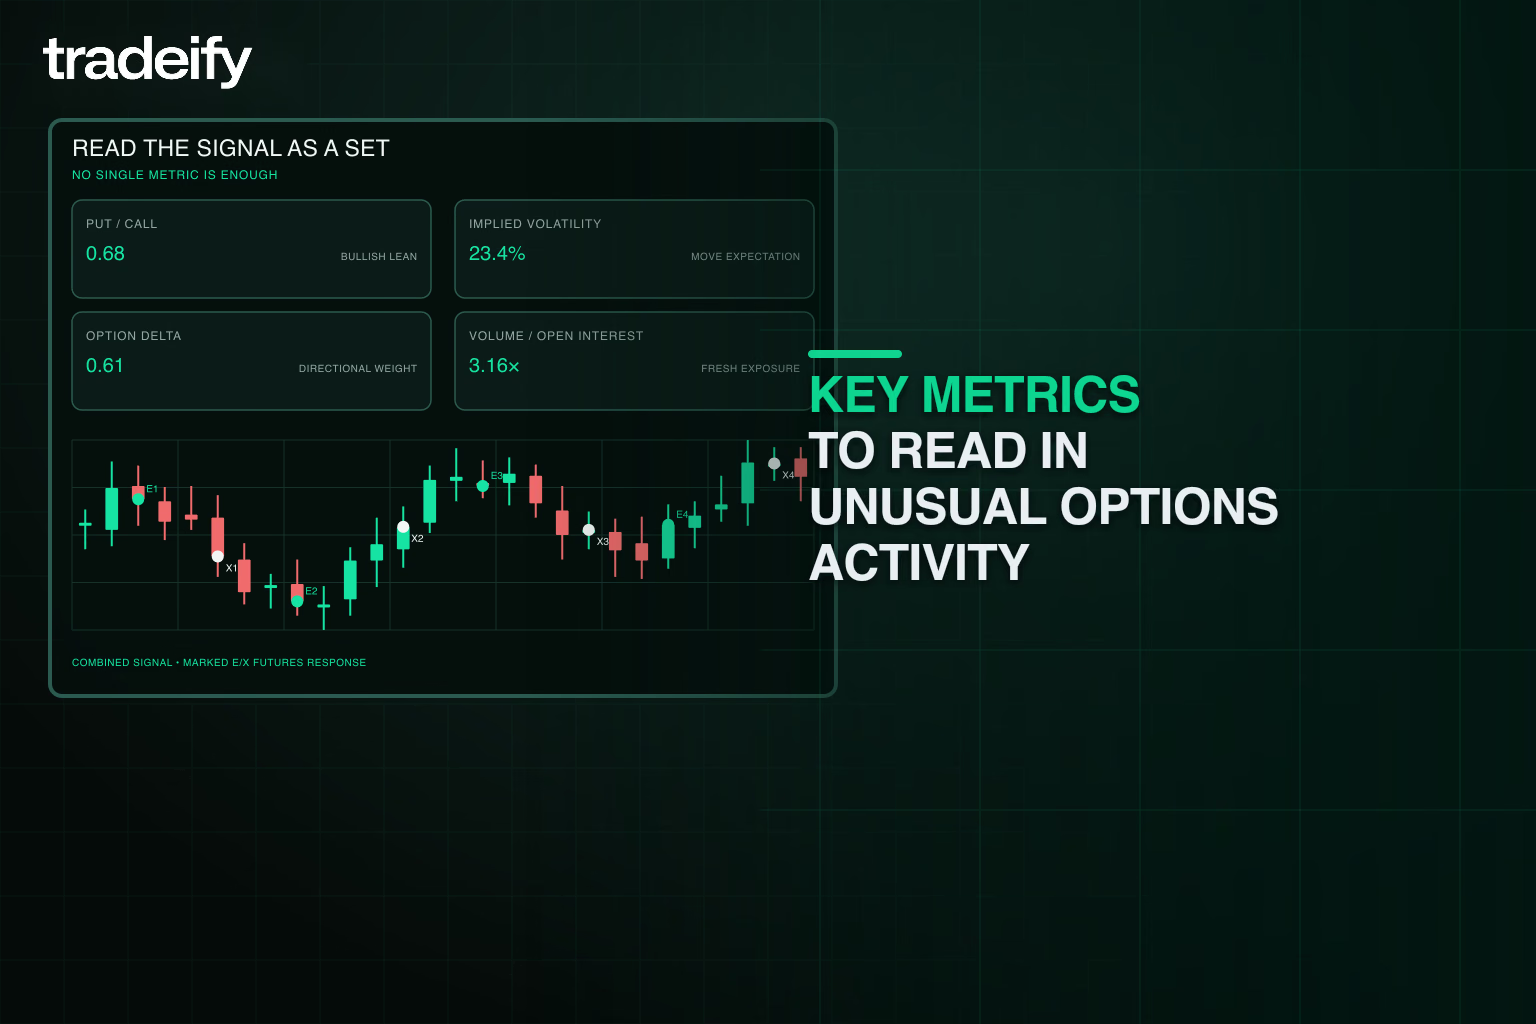
Beyond raw volume, four metrics determine whether an unusual options print is actionable for a futures trader. Read them together — no single metric is sufficient — and connect each back to a possible ES or NQ entry or exit.
- Put/call ratio — the volume of puts divided by the volume of calls. A ratio below 0.7 leans bullish; above 1.0 leans bearish. Spikes outside the normal range often coincide with sweeps in the dominant direction. For futures traders, a sustained elevated put/call print on SPY or QQQ is a useful confirmation signal before taking an ES or NQ short (source).
- Implied volatility (IV) — the market's forward expectation of price movement. A sweep on a contract whose IV is already elevated may be priced for the move; a sweep with low IV is cheaper conviction and often more informative for a futures entry timed to the next session.
- Option delta — the approximate change in option price for a one-point move in the underlying. Deltas above 0.50 (deep in the money) imply directional commitment and align with higher-conviction ES/NQ trades; far out-of-the-money sweeps (delta under 0.20) carry leverage but lower probability and are better as confirmation rather than a primary signal.
- Open interest (OI) — the total outstanding contracts at a strike. When today's volume exceeds OI, the print is opening fresh exposure rather than closing existing positions. This is the cleanest single confirmation that an institution is initiating directional exposure, which is exactly what a futures trader needs before fading or following the move.
Macro context amplifies all four. Earnings weeks, FOMC days, and CPI releases compress timing and raise the probability that aggressive flow precedes a measurable futures move within hours.
The Tradeify and WealthCharts integration for a technical edge
The integration of WealthCharts into Tradeify gives proprietary traders a structural advantage. Historically, prop traders paid out of pocket for expensive third-party feeds. Tradeify now includes WealthCharts as a core platform option, putting institutional-grade research and trade execution in one place.
OptionsHunter as the analytical engine
OptionsHunter filters millions of daily trades to surface actionable anomalies. The scanner details symbol, strike, expiration, spot price, and trade type, letting traders separate urgent sweeps from standard split orders. Visual cues like a Heat Index Fire icon flag when daily volume runs multiples above the historical average, and color-coding shows ask-side bullish flow in green and bid-side bearish flow in red.
Integrated risk management
WealthCharts includes a Liquidation Indicator that plots your trailing drawdown threshold on the chart, plus User Set Risk parameters for per-account configuration. Together they keep your distance from daily loss limits and trailing drawdowns visible in real time, which is critical for preserving funded account status.

Cross-asset strategy from SPY options to ES futures
Futures traders often monitor options tied directly to futures contracts. However, the deepest liquidity and most predictive institutional flows are in major ETF markets. Watch SPY, QQQ, and IWM to actively trade their correlated futures counterparts — the ES, NQ, and RTY.
The liquidity transfer mechanism
As the most liquid ETF globally, SPY commands massive institutional attention. When a major player executes a massive sweep of SPY calls, the market makers who sold those calls become short gamma. To remain delta-neutral, they buy the underlying — frequently ES futures, driving the futures price up in real time. The same pattern with QQQ options reliably precedes NQ futures volatility.
Analyzing flow for direction
OptionsHunter categorizes flow into actionable sentiment buckets. Bullish sweeps are large orders bought aggressively at the ask, implying long ES or NQ. Bearish sweeps are large orders sold at the bid or large puts bought at the ask, implying short ES or NQ. Golden sweeps are exceptionally high-value trades — often over $1 million in premium on short-dated weekly expirations — that suggest an immediate expected move.

Step-by-step futures trading workflow
This workflow is designed for a Tradeify trader using current Tradeify account types (for example, Growth, Select, or Lightning Funded).
1. Identify the unusual options activity
Configure OptionsHunter to isolate sweeps and target aggressive sentiment, then filter for major indices — primarily SPY and QQQ. Look for clusters: three or four sweeps targeting the same strike with a zero-to-seven-day expiration inside a ten-minute window signal concerted positioning, not a one-off hedge. Example: if SPY is at 550 and 5,000 contracts of 555 calls expiring Friday print at the ask, that is a bullish hot money signal.
2. Confirm with technicals
Apply the Champion Trend indicator to your ES or NQ chart and ensure the trend color matches the options direction (green bullish, red bearish). Then watch for an Inventory Retracement Bar — a candle that opens and closes 45% or more from the high of its range — in the direction of your flow signal. Enter on the break of that bar's high. Cross-reference AlgoHunter for additional alignment.
3. Execute the trade
Switch to the WealthCharts Trading Depth of Market and place a stop-limit order to enter as price breaks your confirmation bar. Adhere to Tradeify's contract limits. Set a hard stop at the opposite end of the signal bar, or use the WealthCharts Adaptive Trailing Stop to lock in profits on the run.
4. Manage and exit
Gamma-driven moves are fast, so target at least a 1:2 risk/reward ratio. Monitor OptionsHunter for the exit cue: if aggressive flow stalls or flips (for example, put sweeps appear), exit immediately. WealthCharts journals the trade automatically via WealthTracker; review the Heat Index of your initial signal post-trade to refine setup selection.

Risk management in the Tradeify environment
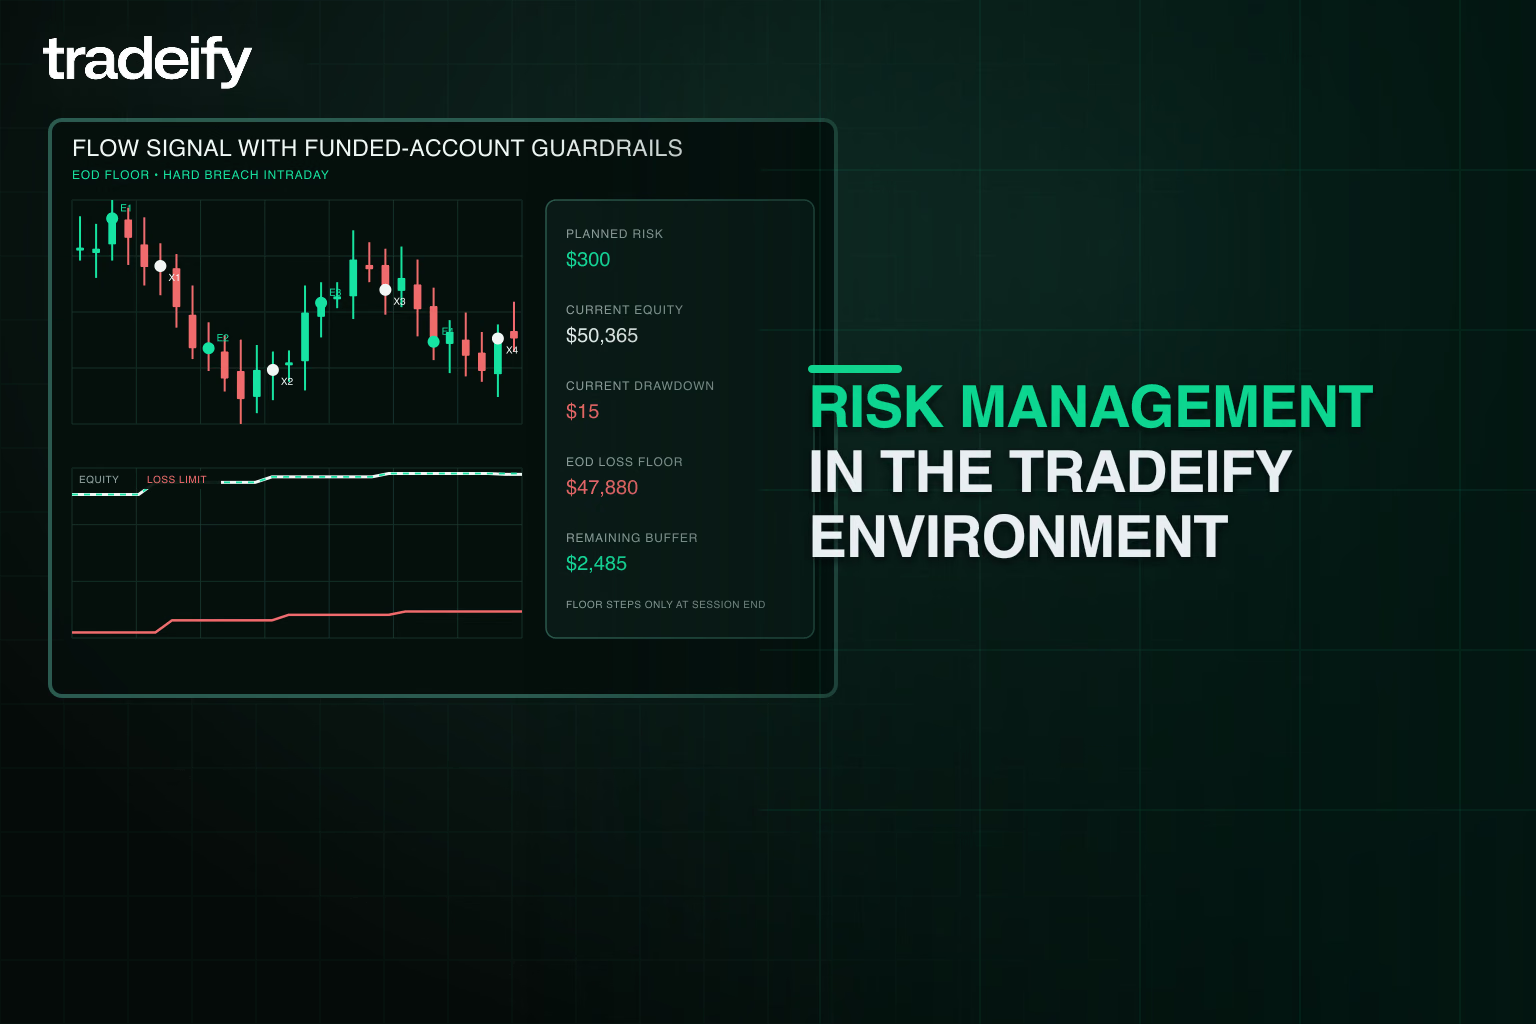
Proprietary trading requires strict adherence to drawdown rules. Because options-driven trading is volatile, risk management has to dictate every decision.
The consistency rule
Tradeify enforces a consistency rule on certain account types. Growth Sim Funded accounts follow a 35% rule (no single day's profit can exceed 35% of total profits at payout request). Lightning Funded accounts use a progressive rule starting at 20% for the first payout, 25% for the second, and 30% thereafter. SELECT Funded accounts have no consistency rule after passing evaluation. On the evaluation side, Growth Evaluation has no consistency rule and can be passed in as few as one trading day; SELECT Evaluation uses a 40% rule requiring at least three trading days. To navigate consistency requirements, avoid placing your entire balance on a single options signal — break positions into tranches or trade micro contracts like the MES and MNQ to smooth the equity curve.
End-of-day trailing drawdown
All current Tradeify accounts use End-of-Day (EOD) trailing drawdown — the limit only updates on closing balance, not intraday. EOD tracking means intraday unrealized swings do not move the drawdown line until settlement. However, hitting the trailing drawdown limit at any point is still a hard breach that permanently fails the account, so precise entry via the retracement bar setup is essential.
Avoiding false positives
Options activity is not always directional — large block trades are sometimes complex hedges. Verify in WealthCharts that the trade is marked aggressive at the ask or bid rather than a neutral cross or floor trade. Floor trades are frequently pre-arranged hedges with no directional value. OptionsHunter's advanced filters can exclude them from the feed entirely.
Frequently asked questions
What is the best scanner for unusual options activity?
It depends on budget and use case. Barchart is the strongest free starting point for daily ranking. Unusual Whales and MarketChameleon are the most-cited paid scanners. WealthCharts OptionsHunter is the most workflow-efficient choice for Tradeify prop traders because it sits inside the same platform as ES and NQ execution.
How do sweep orders predict futures movement?
Large sweeps in SPY or QQQ options force market makers to hedge by buying or selling ES or NQ futures to stay delta-neutral. That dealer hedging is mechanical, not discretionary — it produces measurable futures pressure in the minutes and hours after the sweep prints.
What does a high put/call ratio mean for futures traders?
A put/call ratio above 1.0 indicates more put volume than call volume, leaning bearish on the underlying index. For futures traders watching SPY and QQQ, sustained elevated readings raise the probability of downside pressure on the ES and NQ.
How are block trades different from sweep trades?
Block trades are single large orders filled at one venue, often pre-negotiated and frequently hedges. Sweep trades are split across multiple exchanges and filled simultaneously to maximize speed, signaling urgency. Sweeps are the higher-conviction directional signal.
Do earnings and FOMC days affect unusual options activity?
Yes. Earnings releases, FOMC announcements, and CPI prints concentrate positioning and shorten the timeline between flow and futures response. Unusual sweeps in the hours before these events are higher-signal than ordinary sessions.
Can I use this strategy on a Tradeify evaluation?
Yes. The workflow applies during evaluation and funded stages, though sizing must respect Growth, SELECT, or Lightning rules and the consistency rule. Treat unusual options activity as a signal, not a guarantee — pair every entry with the drawdown discipline described above.
Conclusion
The integration of WealthCharts gives Tradeify traders an institutional research terminal. By combining OptionsHunter with the WealthCharts Depth of Market and a defined scanner stack, retail traders can exploit the causal relationship between derivatives flows and futures prices. Track sweeps in SPY and QQQ, confirm with the Champion Trend indicator, and align futures trades with mandatory market-maker hedging — that is how Tradeify users move from interpreting flow to passing evaluations and scaling funded accounts.
Disclaimer: The materials and content provided by Tradeify Holdings, Corp. (“Tradeify”), whether on our website, through distributed documents, or other communications, including this blog post (“Article”), are intended solely for educational and general informational purposes. This Article should not be viewed as an offer or solicitation to buy or sell futures, futures-related products/derivatives, or any futures products of any kind, or otherwise constitute any type of trading or investment advice, recommendation or strategy, or an endorsement of any financial instruments, companies, or funds.
Engaging in futures and other financial trading involves significant risk and is not appropriate for all readers. Certain investment products (e.g., securities futures, forex futures, and virtual currency derivatives and products) present heightened risks which are described in the Risk Disclosure section of the Tradeify website. It is possible to lose the entire amount of your investment, or even more. Only use risk capital—money you can afford to lose without impacting your financial security or lifestyle. Trading should only be undertaken by individuals who have the necessary risk capital and fully understand the risks involved. Past trading results do not guarantee future performance. Tradeify does not warrant the accuracy or completeness of the information provided and is not responsible for any losses or damages resulting from reliance on this information.
Readers are encouraged to do their own research and consult with a qualified financial adviser before making any financial decisions. This Article does not consider your personal financial situation, risk tolerance, or investment goals.
The authors' (together with guest writers, analysts, and/or other contributors, collectively “Contributors”) views expressed in the Article are based on information the authors and Contributors believe to be accurate at the time of publication but are not guaranteed to be complete or up to date. The authors of this Article may be employees of Tradeify and receive compensation as such. In addition, the authors and/or Contributors may receive compensation (including, for example, referral fees) for soliciting and/or referring individuals to open accounts with Tradeify, both through this Article, as well as through outside activities. Because any testimonials or endorsements herein may be provided by individuals who have or may receive compensation, there is potential for bias in their statements. Such statements may not be representative of the experience of other clients and are not indicative of, or a guarantee of, future performance or success. No representation is being made that any Tradeify account will or is likely to achieve profits or losses similar to those discussed herein.
.svg)
.svg)
.svg)
.svg)




.webp)