
TL;DR: DOM (Depth of Market) trading uses the real-time limit order book to read institutional order flow, iceberg orders, absorption, and pulling and stacking signals for precision futures entries. Tradeify (tradeify.co) gives funded traders access to multiple brokers and platforms — Tradovate (with NinjaTrader and TradingView), Rithmic (with Tradesea, Quantower, Sierra Chart, and R|Trader), and WealthCharts — so traders can pick a stack that fits how they read order flow. ES (E-mini S&P 500) ranks highest for DOM viability with deep liquidity and minimal slippage. NQ (E-mini Nasdaq-100) suits momentum and breakout timing but has thin books, often 10 to 20 contracts per level. CL (Crude Oil) offers clean trends around inventory reports. ZN (10-Year Treasury) provides extreme depth for high-lot execution. GC (Gold) is thin and spiky. Tradeify's microscalping rule requires that more than 50% of trades AND more than 50% of profits come from positions held longer than 10 seconds, with consistency rules varying by account type (Growth Sim Funded 35%, Select Evaluation 40%, Lightning Funded 20% to 30% depending on payout number). Elite Live transitions are performance-based and typically follow four to five approved payouts from a Sim Funded account. The hybrid workflow — chart for structure, DOM for triggers — is the professional standard, with chart-only preferred for swing traders and beginners and DOM-only suited to dedicated scalpers.
The transition from physical open-outcry pits to high-speed electronic exchanges has fundamentally altered the nature of price discovery in futures. In this environment, the price chart, while still essential for structural analysis, is a lagging representation of market intent. More traders have pivoted toward the Depth of Market (DOM) — a real-time interface that exposes the underlying mechanics of the Centralized Limit Order Book (CLOB). For those serious about reading order flow, the DOM offers a level of precision that no candle on a chart can match.
How the DOM Price Ladder Works in Futures
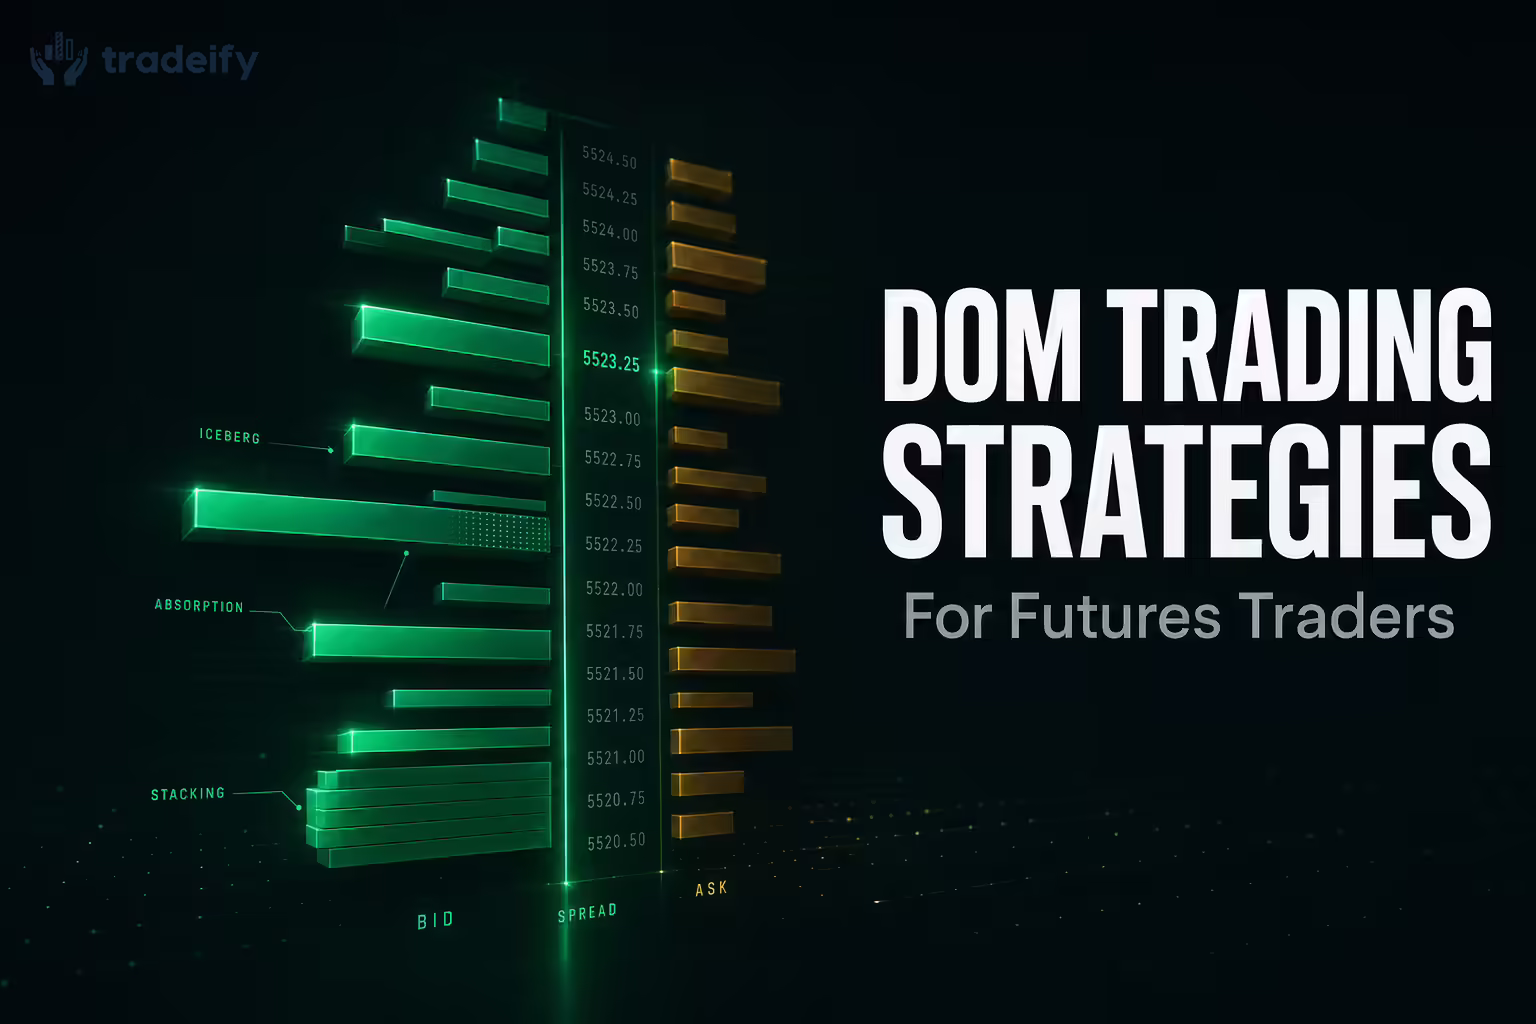
At its core, the Depth of Market is a vertical representation of the limit order book, displaying the available liquidity at every tick above and below the current market price. To understand how professionals use the DOM, you have to first grasp how price discovery works in a double-auction market. Price moves when aggressive market orders consume the passive limit orders resting on the book.
The DOM is organized into three primary columns: the price axis, the bid column (representing buy limit orders), and the ask or "offer" column (representing sell limit orders). Professional traders monitor the firmness of these columns to gauge whether a price level will act as support or resistance. The relationship between liquidity (L) and price volatility (V) is generally inverse:
V ∝ 1 / (L_bid + L_ask)
In markets with thin depth, like the E-mini Nasdaq-100 (NQ), small market orders can cause significant price displacements. In deeper markets like the E-mini S&P 500 (ES), the same order size would be absorbed without moving price a single tick.
Core DOM Trading Techniques for Reading Order Flow
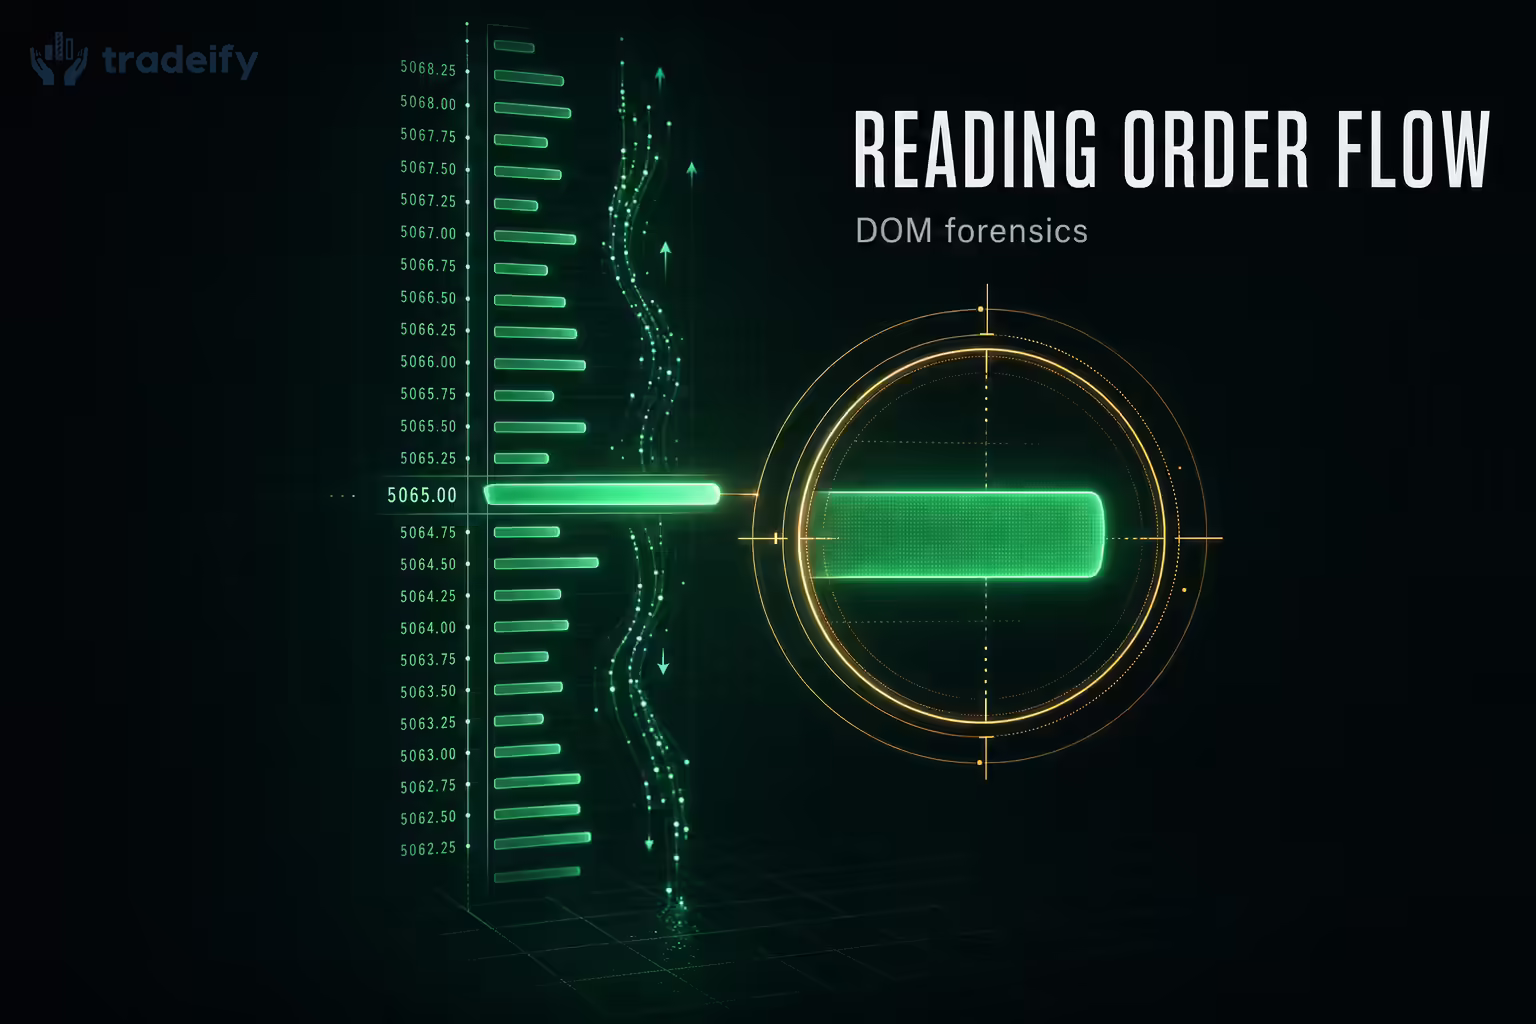
Professional participants do not simply look at the numbers on the DOM; they read the behavior of those numbers. This requires a forensic approach to identifying the intent of institutional participants and the algorithms that dominate the modern exchange environment.
Spotting Large Resting Orders on the DOM
Large resting orders are frequently placed by institutional hedgers or market makers to signal interest at a specific level. These orders can act as walls that prevent price from advancing or as magnets that attract price toward a high-volume node. On a well-tuned DOM, these are highlighted through volume concentrations or color-coded indicators that let you spot size five to ten times the session average.
The presence of a large order does not guarantee a reversal. You have to analyze whether the order is genuine or manipulative. If the size remains on the book as price approaches, it is likely a genuine intent to transact. If the order is pulled or moved further away as price nears, it was likely a spoof intended to bait other participants into a specific direction.
Identifying Iceberg Orders on the DOM
One of the most critical skills for a DOM trader is detecting iceberg orders. An iceberg is a large order partitioned into a visible "peak size" and a hidden "total size." This is done to prevent the market from panicking or front-running a massive institutional position.
The identification process relies on a discrepancy between the DOM and the Time and Sales (the tape). If 500 contracts have traded at a bid price of $4,500 on the tape but the bid size on the DOM remains constant at 25 contracts, an iceberg buyer is present. The participant is refilling the bid as it gets hit by aggressive sellers.
Professional traders use this information to align with the smart money. Spotting an iceberg seller at a prior high suggests that a reversal is imminent, as the hidden supply is likely to exhaust the aggressive buyers.
Reading DOM Absorption at Key Levels
Absorption occurs when aggressive market orders are unable to move the price because they are being consumed by an equal or greater number of passive limit orders. This is a "right now" signal of a trend's potential failure. On the DOM, absorption is visible when the velocity of the tape increases (meaning many trades are occurring) but the price ladder remains stagnant.
This phenomenon is most powerful when it aligns with higher-timeframe technical levels, such as the Previous Day's High (PDH), Volume Weighted Average Price (VWAP), or a significant Volume Profile ledge. When aggressive buyers hit the offer at a major resistance level and price fails to tick up despite high volume, the professional trader recognizes that sellers are absorbing all demand. This is often the signal for a high-probability short entry.
Pulling and Stacking on the DOM
The real-time adjustment of limit orders — pulling and stacking — provides clues about the conviction of market participants.
Stacking occurs when traders add more size to the bid or ask as price approaches. Stacking on the bid side as price falls suggests that buyers are eager to defend a level and prevent further decline.
Pulling is the opposite. If price is moving toward a bid level and the bidders start canceling their orders, it indicates a lack of conviction. The market becomes a vacuum, and price is likely to drop quickly through those empty levels.
Traders use pulling and stacking to refine their entries. If you are looking to buy a pullback, you wait for the stacking of bids to confirm that support is forming, rather than trying to catch a falling knife into a vacuum where orders are being pulled.
DOM Trading Liquidity Profiles for ES, NQ, CL, and More
The effectiveness of DOM trading depends on the liquidity and depth of the specific instrument. Professional traders categorize markets by their thickness — the number of contracts resting at each price level.
ES Futures DOM Trading and Why It's the Gold Standard
The ES is widely considered the premier market for DOM trading because of its immense depth and stable structure. During the U.S. cash session, it is common to see hundreds of contracts at every tick. This makes the ES an order flow market where price discovery is methodical.
The deep liquidity of the ES allows for:
- High Fill Probability: Limit orders are frequently filled, even if price only touches the level for a moment.
- Clear Absorption Signals: Large iceberg orders and absorption patterns are easier to identify because the noise of small trades is dampened by overall volume.
- Low Slippage: Even large market orders can be executed with minimal price walk, making the ES the ideal environment for traders running larger size.
NQ Futures DOM Trading for Momentum and Breakouts
The NQ is fundamentally different from the ES. Despite high trading volume, its order book is thin, often with fewer than 10 to 20 contracts at a price level. This results in a slippery ladder where price can jump multiple ticks in a single transaction.
Professional participants view the NQ DOM differently:
- Liquidity Vacuums: Because there is so little resting size, the NQ is prone to fast stop runs and flash reversals.
- Execution Strategy: Traders often use the DOM to identify where liquidity isn't present, timing momentum bursts. Trying to fade an aggressive move on the NQ DOM is dangerous, since there is often no wall to lean against.
- Viability: While the NQ DOM is useful for timing, it is less viable for the tick-by-tick scalping strategies that work in the ES.
Crude Oil (CL) DOM Trading and Commodity Volatility
Crude Oil futures provide a unique environment that combines deep institutional liquidity with high sensitivity to macro catalysts. The CL DOM is particularly active during the U.S. morning session and around weekly inventory reports.
The liquidity profile of CL is characterized by:
- Institutional Presence: Major oil companies and hedgers use the DOM for large-lot execution, creating identifiable iceberg patterns.
- Trend Cleanliness: CL often produces clean, directional moves once a liquidity level breaks. Order flow traders watch the CL ladder for refilling on pullbacks to confirm trend continuation.
- Viability: CL has sufficient depth for professional DOM trading, but it requires wider stops than the ES to account for its inherent volatility.
DOM Trading Viability by Instrument
| Instrument | Liquidity Ranking | Order Book Personality | DOM Trading Viability | Preferred Strategy |
|---|---|---|---|---|
| ES (E-mini S&P 500) | Platinum | Deep, thick, methodical | Very High | Scalping, level defense |
| NQ (E-mini Nasdaq) | Silver | Thin, volatile, jumpy | Moderate | Momentum, breakout timing |
| CL (Crude Oil) | Gold | Medium-deep, catalyst-heavy | High | News plays, trend following |
| ZN (10-Year Treasury) | Platinum+ | Extremely deep, static | Very High | High-lot market making |
| GC (Gold) | Bronze | Thin, spiky | Moderate | Price action confirmation |
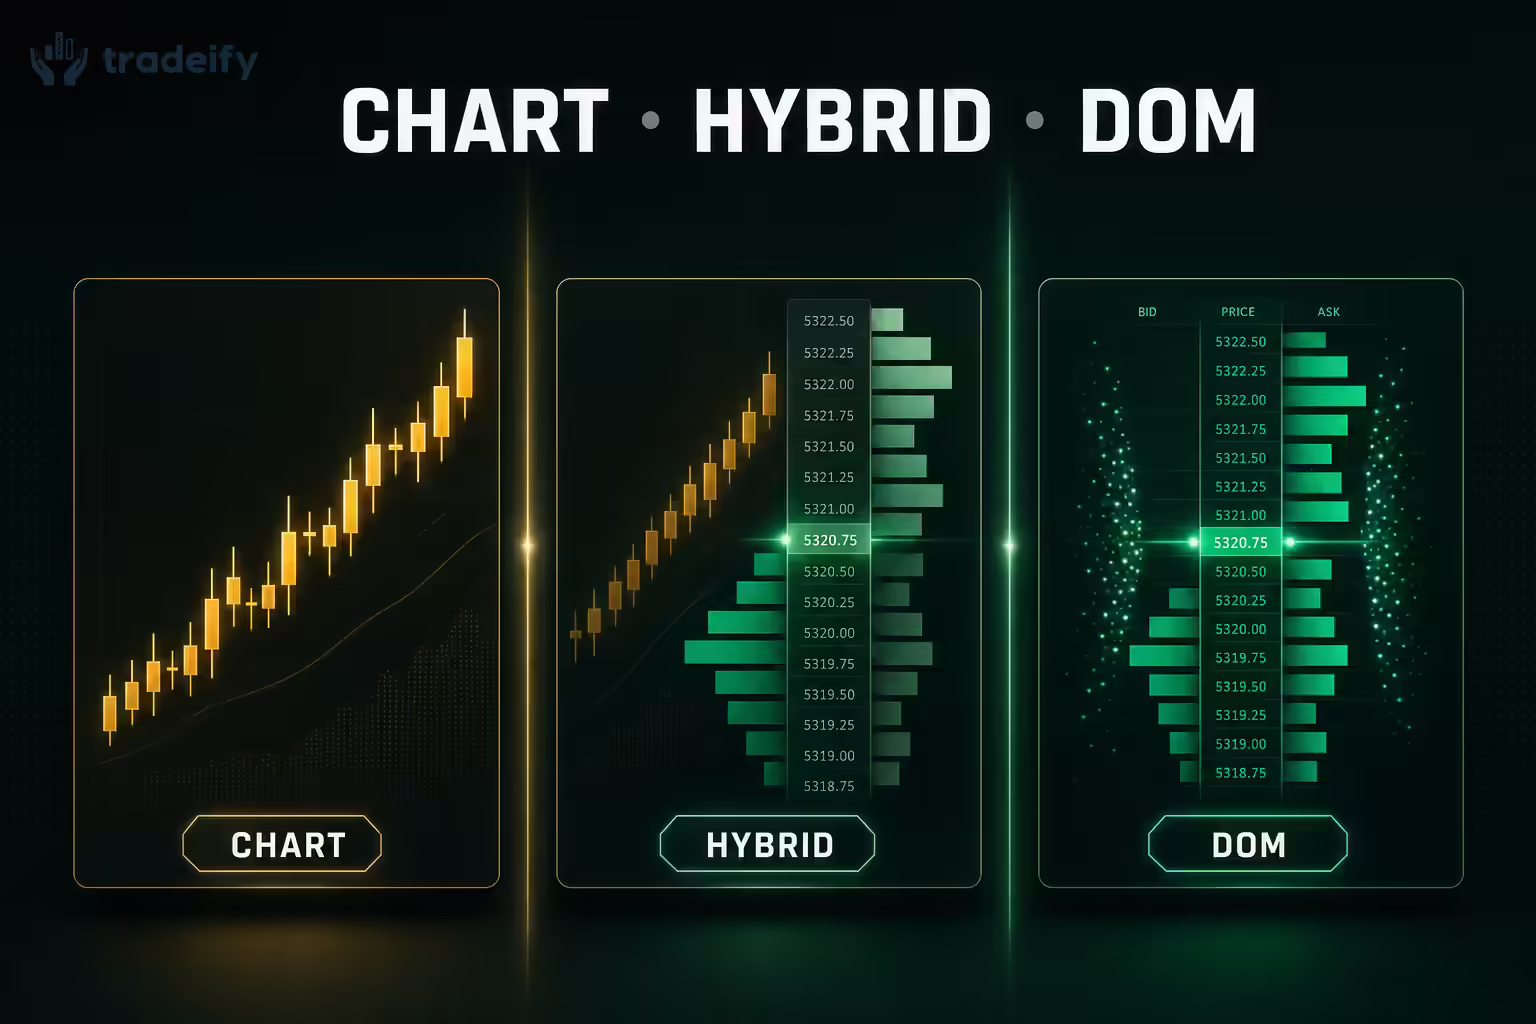
Chart-Based vs DOM-Only vs Hybrid Execution
Different traders need different execution styles. Tradeify supports this by giving funded traders access to multiple brokers and trading platforms, so you can pick a stack that matches how you read order flow.
Chart-Based Execution Without the DOM
Chart-based execution relies on the spatial relationship between price candles and technical indicators. It is the primary tool for traders who prioritize market structure and trend geometry.
- Mechanism: Orders placed via buttons or by dragging levels on the chart (Trade from Chart).
- Advantages: High visual context; easy to manage swing positions; integrates multi-timeframe analysis seamlessly.
- Disadvantages: Lack of precision in entry timing; blind to the liquidity gaps that cause slippage; slower reaction times during high-volatility events.
DOM-Only Execution for Scalpers
DOM-only execution is the hallmark of the dedicated scalper. These traders ignore the chart for most of the session, focusing entirely on the ebb and flow of the ladder.
- Mechanism: One-click execution directly on the price rungs; modifications made by dragging working orders.
- Advantages: Absolute precision in entry and exit; immediate feedback on order flow aggression; the ability to see icebergs before they impact the chart.
- Disadvantages: High cognitive load; risk of losing the big picture; susceptibility to being trapped in a minor rotation that is part of a larger trend.
The Hybrid DOM and Chart Workflow
The most effective participants use a hybrid workflow, combining a charting environment with a fast DOM ladder either side-by-side or across multiple monitors.
- The Process: A trader uses the chart to identify a high-interest zone (a daily demand area, a 61.8% Fibonacci retracement, a VWAP retest). As price enters this zone, the trader shifts focus to the DOM to look for a specific trigger — a large bid stacking, a sell-side iceberg getting exhausted, absorption at the level.
- Benefit: This combines the structural clarity of the chart with the tactical precision of the DOM. It cuts the false-start rate by requiring that order flow confirm the technical setup.
The DOM Trading Learning Curve for Order Flow
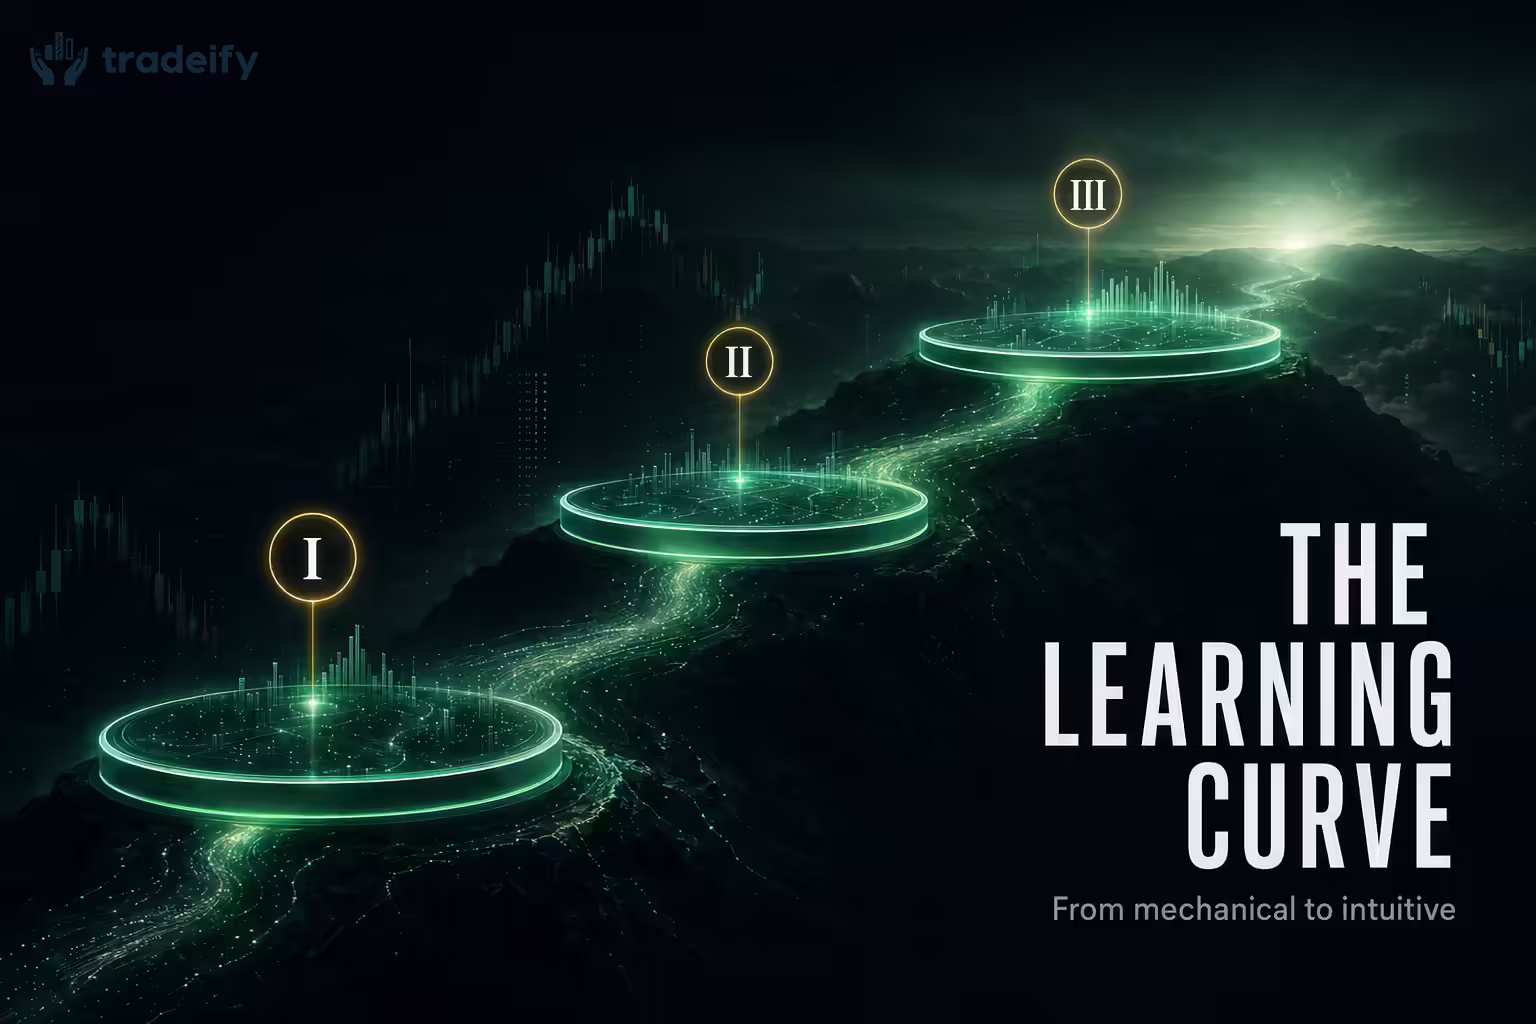
Mastering the Depth of Market is often compared to learning a new language. It is not a matter of memorizing a few patterns; it is about developing an intuitive feel for the market's tempo and participation.
Three Stages of DOM Trading Development
The path toward DOM proficiency typically follows a structured progression:
- Stage 1 — Observation Without Execution. The trader spends weeks watching the ladder during the RTH (Regular Trading Hours) open. The goal is to build visual memory of how the ES or NQ breathes.
- Stage 2 — Conceptual Integration. The trader begins to recognize specific phenomena like absorption and spoofing but does not yet have the discipline to trade them. They learn to separate noise from intent.
- Stage 3 — Tactical Execution. The participant starts taking trades, focusing on one specific setup (such as fading a stop-run into an iceberg). This is where serious trade journaling becomes invaluable for identifying behavioral errors.
Who Should and Should Not Use DOM Trading
| Trader Profile | Recommendation | Reasoning |
|---|---|---|
| Scalper / Day Trader | DOM Essential | Precision timing and liquidity reading are the only ways to achieve a positive expectancy in short-duration trades |
| Swing / Position Trader | Chart Preferred | Higher-timeframe structure is more relevant than tick-by-tick liquidity shifts for multi-day holds |
| Momentum Follower | Hybrid | Uses the chart to catch the trend and the DOM to time the entry on pullbacks to minimize drawdown |
| Beginner / Novice | Chart-First | The DOM is overwhelming for beginners. It is better to master basic market structure on a chart before adding the complexity of the ladder |
The learning curve is steep, and for many, the chart provides sufficient information for a profitable strategy. But for those looking to compete at a professional level — particularly within the high-stakes environment of a Tradeify funded account or Elite Live — the DOM offers an edge that lagging indicators cannot match.
Choosing a Trading Stack at Tradeify
Tradeify isn't a single trading platform. At checkout, you select one of three brokers, and each broker gives you access to a different set of trading platforms. This matters for DOM traders because the platform you pick directly affects the speed, layout, and feature set of your ladder.
- Tradovate (broker): Gives you access to the Tradovate web and desktop platforms, NinjaTrader, and TradingView.
- Rithmic (broker): Gives you access to Tradesea, Quantower, Sierra Chart, and R|Trader.
- WealthCharts (broker and platform): A self-contained platform with advanced charting, a full-featured DOM, a trade copier, and built-in performance analytics through WealthTracker. WealthCharts is third-party software that requires a separate purchase from WealthCharts directly.
You can switch freely between platforms compatible with your broker (a Rithmic user can move between Tradesea, Quantower, Sierra Chart, and R|Trader at will), but you cannot switch brokers without purchasing a new account. Tradesea, Quantower, Sierra Chart, R|Trader, and WealthCharts are all third-party platforms — Tradeify does not own or operate them and does not provide their technical support.
For DOM-focused traders, the practical question is which platform's ladder you find most readable. Tradesea is web-based and pairs TradingView-style charting with a fast DOM. Quantower and Sierra Chart are desktop-grade tools favored by serious order-flow traders. WealthCharts runs entirely in the browser with one-click DOM trading. NinjaTrader is the long-standing desktop standard. There is no single "best" answer — there is the platform whose ladder you can actually read at speed.
Account Rules That Matter for DOM Traders
Tradeify's funded account program is built around demonstrating a strategy that could plausibly be replicated on live capital. A few rules are particularly relevant if you trade off the DOM.
The 10-Second Microscalping Rule
DOM traders often work in seconds, not minutes — but Tradeify requires that trades reflect a genuine strategy rather than latency exploitation. To pass evaluation activation and to qualify for a payout, you must meet both criteria below:
- More than 50% of your trades are held longer than 10 seconds
- More than 50% of your profit comes from trades held longer than 10 seconds
This rule prevents pure tick-sniffing or HFT-style latency arbitrage. It does not prevent fast scalping — it just requires that the bulk of your edge comes from trades you actually had to read, not trades that were over before the chart could update.
Consistency Requirements by Account Type
Each account type has its own consistency rule, applied differently across the evaluation and funded phases:
- Growth Sim Funded: 35% consistency rule (no single day's profit can exceed 35% of total profits). Growth Evaluation has no consistency rule.
- Select Evaluation: 40% consistency rule during the evaluation phase only. Once you pass and move to a Select funded account, the consistency rule is removed (regardless of whether you choose Select Flex or Select Daily).
- Lightning Funded (purchased after September 12, 2025): Progressive consistency rule — 20% for the first payout, 25% for the second, 30% for the third and beyond. Lightning Funded accounts purchased before that date keep the original flat 20% rule.
The point of the rule is the same across all account types: payouts should reflect sustained performance, not a single oversized day.
Path to Elite Live
Elite Live is Tradeify's live-capital program. It is performance-based and discretionary — Tradeify monitors performance on each Sim Funded account and may transition a trader to Elite Live, typically after four to five approved payouts on a single account. Eligibility does not guarantee an immediate transition; the firm makes the call based on live-readiness. Each Sim Funded account that has received at least one payout can transition to its own Elite Live account.
Elite Live operates on an 80/20 profit split (80% to the trader). Sim Funded accounts (Growth, Select, Lightning) operate on a 90/10 split. There is also a Performance Reward Pool attached to every Elite Live account — a separate pool of capital you earn alongside trading profits when you hit profit milestones.
Trading Journal and Discipline
Every Tradeify dashboard now includes a fully integrated trading journal as part of the Tradeify 3.0 release. For DOM traders, the journal is one of the most useful tools in the kit — not for proving you took the right trades, but for surfacing the behavioral mistakes that creep in during live execution. Chasing price during low-liquidity sessions, overtrading after a loss, fading into a trend instead of waiting for absorption — these are the patterns a journal exposes.
Reviewing your trades against the consistency requirements is a routine part of the workflow before each payout request. The journal lives directly in the dashboard, so there's no separate tool to set up or sync.
Combining DOM Trading With Structure and Discipline
Professional futures execution is not about predicting the future; it is about accurately reading the present. The ability to spot a large institutional player absorbing sell-side pressure, or to recognize a liquidity vacuum before it results in a sharp stop-run, provides a tactical advantage that traditional charts simply cannot offer. For a trader working the deep books of the E-mini S&P 500 or the macro-driven ladders of Crude Oil, the DOM is the definitive tool for precision.
That precision comes with the responsibility of discipline. The steep learning curve of order flow trading requires a commitment to observation and the humility to accept that the signals of the ladder are only as valid as the context they appear in. For traders who can master the combination — structural insight from the chart, behavioral insight from the DOM — Tradeify's funded program offers a framework where that edge translates directly into payouts and, eventually, real capital.
.svg)
.svg)
.svg)


.webp)

