

TL;DR: Tradeify supports Tradesea, a TradingView-based platform available to traders who select Rithmic as their broker. The top indicator stacks for 2026 futures day trading cover four categories: volume-based (VWAP session standard, Volume Profile with POC/VAH/VAL, anchored VWAP), momentum (RSI 14-period standard or 9-period for NQ, MACD 12/26/9 standard or 5/13/1 aggressive, Stochastic 14-period), trend (9/20/50/200 EMAs, SuperTrend 10/3 standard or 7/2 high-vol, ADX 14-period with 20–25 threshold), and volatility (Bollinger Bands 20-period 2 StdDev, ATR 14-period for stop sizing at 1.5–2.0x, Keltner Channels 20/2.0 EMA-based). Recommended stacks by instrument: ES/MES (VWAP + Volume Profile + MACD 12/26/9), NQ/MNQ (SuperTrend 7/2 + Keltner 20/2.0 + RSI 9-period), CL/MCL (ADX 14 + EMA 20/50 + ATR 14). High-value combos include VWAP + Volume Profile for structural context, MACD + RSI for momentum filtering, SuperTrend + ADX for trend strength, and Bollinger Bands inside Keltner Channels for TTM Squeeze breakouts.
Electronic futures trading in 2026 keeps pushing institutional-grade tools further into the hands of retail traders. Modern charting engines, real-time order book depth, and integrated risk controls are now standard across the platforms most prop firms support. For the intraday participant trading the E-mini S&P 500 (ES), Nasdaq-100 (NQ), or Crude Oil (CL), filtering market noise and identifying high-probability structural setups is a baseline requirement, not a competitive edge.
Indicator selection has evolved past simple signal generation toward a broader framework of market context and quantified risk. Inside platforms like Tradesea, indicators run on the TradingView engine, so volume, momentum, trend, and volatility calculations behave the way professional traders expect them to. This guide breaks down the most effective technical indicators for 2026 futures day trading: their mathematical foundations, optimal configurations for specific asset classes, and the complementary combinations that drive consistent performance in high-volatility environments.
Volume-Based Indicators for Futures Trading
In an auction-driven market, volume is the primary driver of price discovery and the most reliable leading indicator of institutional intent. Unlike price-only indicators, volume-based tools provide a three-dimensional view of the market, revealing not just where the price has moved, but the level of capital commitment behind those movements.
Volume-Weighted Average Price (VWAP) for Futures
The Volume-Weighted Average Price (VWAP) represents the session's benchmark for fair value. It is calculated by taking the sum of price multiplied by volume for every transaction and dividing that by the total cumulative volume for the trading period. The mathematical expression is:
VWAP = Σ(Price × Volume) / ΣVolume
This formula ensures that price levels with higher trading activity exert a greater influence on the average, providing a more accurate reflection of the consensus value among market participants.
In highly liquid instruments like the E-mini S&P 500 (ES), institutional algorithms frequently use VWAP as an execution target to minimize market impact. Price behavior around the VWAP line often shows high sensitivity, acting as a magnet for mean reversion or a springboard for trend continuation.
| Instrument | Recommended VWAP Setting | Tactical Objective |
|---|---|---|
| E-mini S&P 500 (ES) | Session VWAP (Standard) | Identify institutional fair value and mean reversion points |
| Nasdaq-100 (NQ) | Anchored VWAP (to 9:30 AM Open) | Momentum confirmation and structural support in fast trends |
| Crude Oil (CL) | Session VWAP with 1 & 2 StdDev Bands | Volatility extreme identification and news-event reversals |
The primary strength of VWAP is its ability to filter low-volume noise. Price spikes on thin volume have a negligible effect on the VWAP's slope. False signals are most prevalent during the first 15–30 minutes of the trading session, when the cumulative data set is too small to provide a stable average. In range-bound markets where price oscillates around the mean, VWAP can produce whipsaws, leading traders to enter prematurely before a definitive trend emerges.
Volume Profile and Market Structural Analysis
While VWAP provides a dynamic average over time, the Volume Profile offers a vertical view of volume traded at specific price levels. This distribution reveals the underlying structure of the market, distinguishing between balance zones (High Volume Nodes) and imbalance zones (Low Volume Nodes).
The Point of Control (POC) serves as the anchor of the Volume Profile, representing the single price level with the highest volume for the session. Surrounding the POC is the Value Area (VA), typically encompassing 70% of the total volume, which defines the boundaries of market acceptance.
The interaction between price and volume shelves (the edges of High Volume Nodes) is a critical component of intraday strategy. High Volume Nodes (HVNs) act as areas of price stabilization and consolidation, where the market finds fair value. Low Volume Nodes (LVNs), by contrast, represent rejection zones; when price enters an LVN, it tends to move rapidly through the area as participants are unwilling to transact at those levels.
| Profile Component | Market Meaning | Trading Implication |
|---|---|---|
| Point of Control (POC) | Most accepted price | Strongest magnet for mean reversion |
| Value Area High (VAH) | Upper boundary of value | Bullish breakout confirmation or resistance |
| Value Area Low (VAL) | Lower boundary of value | Bearish breakdown confirmation or support |
| High Volume Node (HVN) | Consensus zone | Slower price action, strong support/resistance |
| Low Volume Node (LVN) | Rejection zone | Rapid price movement, "gap" behavior |
A common false signal occurs when a trader assumes a POC will act as support or resistance during a high-momentum trend. In those conditions, the POC acts as a speed bump rather than a wall, and price slices through it as value migrates to a new level.
Momentum Indicators for Futures Day Trading
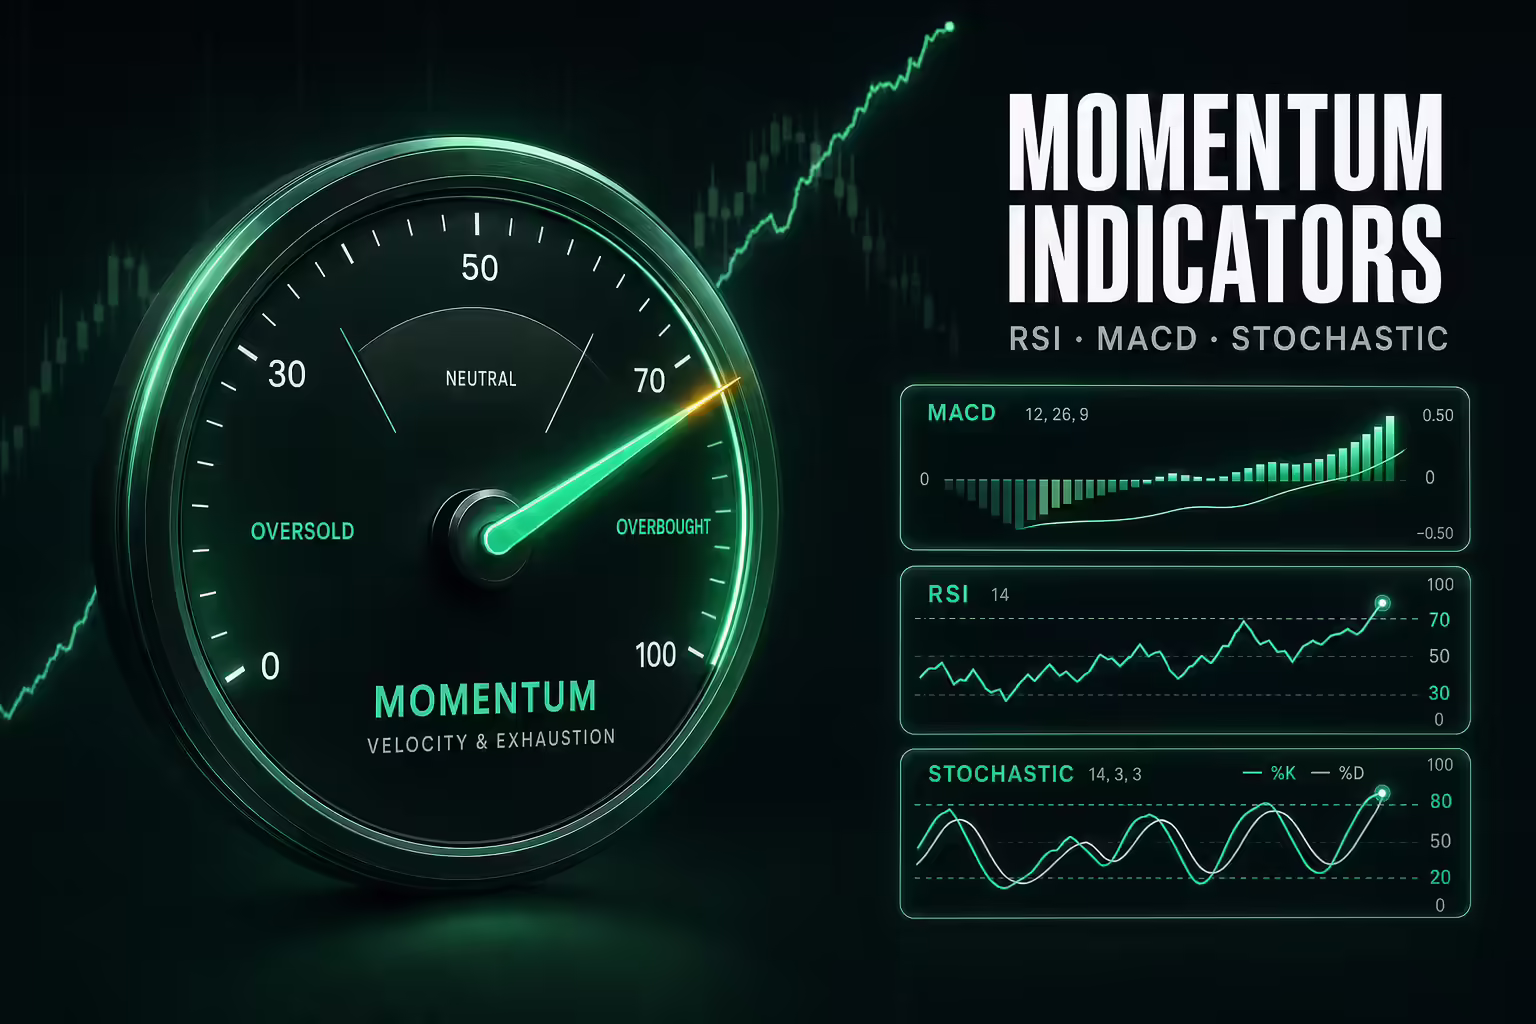
Momentum indicators identify the internal strength of a price movement and help anticipate exhaustion points before they manifest as trend reversals. In the 2026 futures market, these tools help traders manage the high volatility seen in instruments like the Nasdaq-100 (NQ).
Relative Strength Index (RSI)
The Relative Strength Index (RSI) is a momentum oscillator that measures the velocity and magnitude of directional price changes. Scaled from 0 to 100, the RSI is traditionally used to identify overbought (>70) and oversold (
RSI is also useful for trend confirmation through the 50-level pivot. A sustained reading above 50 indicates that bullish momentum is in control, while a failure to reclaim the 50-level during a rally suggests the underlying trend is weakening.
Optimization for Futures Markets
- E-mini S&P 500 (ES): The standard 14-period lookback remains the gold standard for filtering intraday noise while providing reliable reversal signals.
- Nasdaq-100 (NQ): Due to NQ's high volatility, a shortened 9-period RSI on a 5-minute chart can help identify momentum shifts more rapidly during liquidation cascades.
- Crude Oil (CL): A 14-period RSI accounts for the commodity's tendency to stay pinned at extremes during news-driven supply and demand shifts.
RSI provides highly accurate signals through divergence (price makes a new extreme but RSI does not), indicating a loss of internal strength. False signals are common in strong trending markets, where RSI can remain overbought or oversold for hours, leading counter-trend traders into significant drawdowns.
Moving Average Convergence Divergence (MACD)
The Moving Average Convergence Divergence (MACD) identifies the relationship between two moving averages (usually the 12 and 26 EMAs) to signal shifts in momentum and trend direction.
The MACD has three components: the MACD line, the signal line (a 9-EMA of the MACD line), and the histogram. In futures day trading, the histogram is the most useful component because it visualizes the rate of change between the moving averages. An expanding histogram indicates accelerating momentum, while a contracting histogram suggests a pullback or reversal is imminent.
| Setting | Type | Purpose |
|---|---|---|
| 12, 26, 9 | Standard | Balanced momentum tracking for ES/CL |
| 5, 13, 1 | Aggressive | Fast-response scalping for MNQ/NQ momentum |
| Zero-Line | Threshold | Bullish bias above zero, bearish bias below |
False signals occur most often in choppy or sideways markets, where the MACD lines repeatedly cross over each other without a clear directional move. Reviewing your trade journal to identify sessions where MACD crossover entries underperformed will help you recognize the non-trending environments where the indicator generates redundant noise.
Stochastic Oscillator
The Stochastic Oscillator measures the position of the current closing price relative to the high-low range over a specific period, typically 14 bars. It is designed to identify exhaustion at the boundaries of recent price action.
The indicator consists of two lines: %K (the fast line) and %D (the smoothed signal line). The Stochastic is highly responsive, making it well-suited to range-bound markets like the mid-day session of the ES.
The Stochastic is prone to false extremes during powerful trend days. When a market like the NQ enters a one-timeframing mode (consistently making higher highs), the Stochastic will often pin at 100 for long durations, leading traders to mistakenly fade a trend that has no intention of reversing.
Trend Indicators for Futures Trading
Trend indicators serve as the primary filter for intraday strategies, helping traders align with the higher-probability direction of the market.
Exponential Moving Averages (EMAs)
Moving averages smooth price data to provide a clearer view of the market's trajectory. For day trading futures in 2026, Exponential Moving Averages (EMAs) are preferred over Simple Moving Averages (SMAs) because they respond faster to recent price changes, which matters in fast-moving markets like NQ and CL.
Strategic EMA Configurations
- The 9/20 EMA Cross: Used to identify short-term momentum shifts and impulse legs.
- The 50 EMA: Acts as a line in the sand for intraday trend health. If price remains above the 50 EMA on a 5-minute chart, the trend is considered robust.
- The 200 EMA: Provides the macro intraday bias. Many traders only take long setups when price is above the 200 EMA and short setups when below it.
| Timeframe | EMA Period | Market Application |
|---|---|---|
| 1-Minute | 20 | Scalping entries for MNQ momentum |
| 5-Minute | 50 | Trend health verification for ES/NQ |
| 15-Minute | 200 | Definitive intraday directional bias |
EMAs are lagging indicators by nature, meaning they respond to price action rather than predict it. A common false signal occurs during consolidation, when the moving averages flatten out and price chops through them, leading to multiple failed entry attempts.
SuperTrend Indicator
The SuperTrend indicator is a volatility-adjusted trend-following tool that combines the Average True Range (ATR) with a multiplier to plot a dynamic stop-and-reverse line on the chart.
Mathematical Foundation of SuperTrend
The SuperTrend calculation uses the ATR to set bands around the price:
Upper Band = (High + Low) / 2 + (Multiplier × ATR)
Lower Band = (High + Low) / 2 − (Multiplier × ATR)
The indicator flips its bias when price closes on the opposite side of the active line.
| Market | Setting (ATR, Mult) | Characteristics |
|---|---|---|
| Standard Day Trade | 10, 3 | Balanced for most sessions |
| High Vol (NQ/CL) | 7, 2 | Faster response for aggressive scalping |
| Conservative | 14, 4 | Filters noise for long-term trend following |
SuperTrend excels in trending markets but is unreliable in sideways markets, where it flips colors multiple times within a tight range and produces repeated stop-outs. Many traders use an ADX filter to ignore SuperTrend signals when trend strength is low.
Average Directional Index (ADX)
The ADX measures the strength of a trend regardless of its direction. It is derived from the Directional Movement Index (DMI) and oscillates between 0 and 100.
ADX is primarily used as a volatility filter to prevent overtrading in stagnant conditions. A reading above 20–25 suggests a trend is strengthening and trend-following strategies are likely to succeed. A reading below 20 indicates a lack of directional conviction, suggesting that mean reversion tools (like Stochastics or Bollinger Bands) should be prioritized.
Volatility Indicators for Futures Day Trading

Volatility indicators do not predict direction. They measure the width of market movement and help traders identify when price has moved outside the statistical norm.
Bollinger Bands
Bollinger Bands consist of a middle 20-period SMA and two outer bands plotted at two standard deviations from the mean. They expand and contract based on market volatility, providing a visual representation of price dispersion.
Tactical Use Cases
- The Squeeze: When the bands narrow significantly, it signals a period of low volatility that often precedes a major breakout.
- Mean Reversion: In range-bound markets, a tag of the outer band followed by a reversal candle can signal an entry back toward the middle SMA.
A significant drawback of Bollinger Bands is that they provide no directional bias. A band tag in a strong trend is often a sign of strength rather than exhaustion, leading faders into major losses as the market walks the bands. For highly volatile contracts like the NQ, increasing the setting to 2.5 standard deviations can help filter out false extremes.
Average True Range (ATR)
The ATR is a pure measure of volatility, calculated as the average of the True Range over a set number of periods (usually 14). True Range accounts for gaps between sessions, making it superior to simple high-low measurements in the futures market.
ATR is indispensable for volatility-adjusted position sizing and risk management. Instead of using a fixed-tick stop loss, many professional traders use a multiple of ATR (for example, 2.0x ATR) to ensure that their stops are mathematically proportional to current market intensity.
Keltner Channels
Keltner Channels are similar to Bollinger Bands but use the ATR instead of standard deviation for the envelope calculation, and an EMA instead of an SMA for the centerline.
| Feature | Bollinger Bands | Keltner Channels |
|---|---|---|
| Calculation | Standard Deviation | Average True Range |
| Centerline | Simple Moving Average (SMA) | Exponential Moving Average (EMA) |
| Responsiveness | High (Elastic) | Moderate (Smooth) |
| Best For | Reversion/Squeezes | Trend Following/Breakouts |
Keltner Channels are generally considered more reliable for trend-following in markets like NQ and CL, since the ATR-based calculation is less prone to exploding during isolated price spikes and provides a steadier structural guide for trailing stops.
Complementary Indicator Combinations vs. Redundant Noise
The most common structural flaw in retail trading systems is indicator redundancy: stacking multiple indicators that use the same mathematical inputs, which leads to duplicate signals and a false sense of confirmation.
The Golden Stacks for Futures Indicators
- VWAP + Volume Profile (The Structural Anchor): Pairs price-weighted average value (VWAP) with structural distribution (Volume Profile). VWAP provides the intraday fair price, while the Volume Profile identifies the specific price shelves that will act as physical support or resistance.
- MACD + RSI (The Momentum Filter): MACD gives a view of trend direction and duration, while RSI measures the speed and extremity of the move. They work well together when a MACD crossover is confirmed by an RSI reading that is not yet overextended, which filters out exhausted entries.
- SuperTrend + ADX (The Trend Strength Matrix): SuperTrend provides a binary directional signal, while ADX quantifies whether that signal is backed by sufficient trend strength. This prevents the trader from taking SuperTrend signals in choppy environments where they are likely to fail.
- Bollinger Bands + Keltner Channels (The TTM Squeeze Logic): When Bollinger Bands contract inside Keltner Channels, it indicates a period of extreme compression. The subsequent expansion out of the bands identifies a high-probability breakout setup.
Redundant Indicator Combinations (The Noise Traps)
- RSI + Stochastic Oscillator: Both are momentum oscillators that measure similar aspects of price velocity. Using both on a chart provides no additional information and can lead to analysis paralysis during market transitions.
- SuperTrend + Parabolic SAR: Both are trend-following trailing stop tools that use ATR-like logic. They will often flip at the same time, giving the trader a false sense of double confirmation when they are actually just seeing the same math displayed differently.
- Moving Average Rainbows (e.g., 8, 9, 10, 11, 12 EMAs): These stacks create visual lag and overemphasize trend direction without identifying support or resistance levels. A simple 21/50/200 stack is more effective for clarity.
Futures Indicator Strategy Guide by Instrument

The E-mini S&P 500, Nasdaq-100, and Crude Oil markets each have unique personalities that reward specific indicator configurations.
E-mini S&P 500 (ES / MES) Futures Indicators
The ES is the world's most liquid futures market, characterized by structural integrity and frequent mean reversion to institutional levels.
| Indicator | Setting | Strategy |
|---|---|---|
| VWAP | Session | Primary pivot for all trades; entries typically occur on retests of VWAP |
| Volume Profile | 24-Hour | Use Previous Day's POC (vPOC) as a primary target or bounce level |
| MACD | 12, 26, 9 | Histogram contractions signal the end of mid-day rotations |
Nasdaq-100 (NQ / MNQ) Futures Indicators
The NQ is a momentum-driven market with high intraday volatility. Liquidity cascades can produce 100-point moves in minutes, which calls for responsive trend filters.
| Indicator | Setting | Strategy |
|---|---|---|
| SuperTrend | 7, 2 | Capture rapid momentum bursts; exit immediately if the line flips color |
| Keltner Channels | 20, 2.0 | Use as a guide rail for trailing stops during extended trends |
| RSI | 9-period | Identify climax reversals when RSI exceeds 80 or falls below 20 |
Crude Oil (CL / MCL) Futures Indicators
Crude Oil is sensitive to macro themes and geopolitical shifts, often producing powerful one-way moves during the London and New York sessions.
| Indicator | Setting | Strategy |
|---|---|---|
| ADX | 14-period | Ensure ADX > 25 before entering trend-following trades to avoid EIA chop |
| EMA Stack | 20, 50 | Buy/sell pullbacks to the 20 EMA when the 50 EMA is sloping aggressively |
| ATR | 14-period | Set stop losses at 1.5x ATR to avoid stop hunts during inventory releases |
The Integrated Advantage of Futures Indicators
Long-term success in 2026 still comes down to combining the right tools with disciplined execution. Modern platforms supply the infrastructure (TradingView-grade charting, fast DOMs, integrated risk controls, and trade journaling), but the trader has to bring the strategy.
By using volume-based indicators to establish market structure, momentum oscillators to time entries, and volatility envelopes to manage risk, traders can build a robust, data-backed approach to the futures markets. The real edge is not finding a secret indicator, but the systematic optimization of a complementary indicator stack, refined through performance data and executed with the capital available through a Tradeify funded account. Consistency, driven by quantitative insight and technological precision, remains the path forward in the modern market.
.svg)
.svg)
.svg)

.webp)

