



TL;DR: Andrews' pitchfork is a three-line channel built from three pivots, and the real decision is which line to trust. In 500 daily sessions of ES and NQ futures, the trend-side line was reached in 82.05% of forks. The median was reached in only 30.77%, and the standard fork's lines broke fast. A flatter Schiff-style fork reached its median in 87.18% of the same forks.
What Andrews' Pitchfork Is
Andrews' pitchfork is a trend channel tool made of three lines: a median line in the middle and two outer lines parallel to it, one on each side, at equal distance. It is drawn from three swing pivots, left to right on the chart, and it is credited to Alan Andrews.
The appeal is discipline. Once the pivots are chosen, the channel is fixed by geometry, so you cannot quietly widen it to fit the trade you already want. The outer lines are read as possible support and resistance, the median line is read as a gauge of trend strength, and a close outside the channel is read as a warning that the trend may be changing.
Those readings are claims, and most explainers stop at stating them. This article tests them. It builds the fork step by step, rebuilds one real E-mini S&P 500 (ES) fork row by row, and then measures how often each line was actually reached across the last 500 completed daily sessions of ES and E-mini Nasdaq-100 (NQ) futures.
Related lesson: Support and resistance
How to Draw Andrews' Pitchfork From Three Pivots

Drawing Andrews' pitchfork takes three pivots in sequence. In an uptrend that is a trough, a peak, then a higher trough. In a downtrend it is a peak, a trough, then a lower peak.
- Pick the timeframe you actually make decisions on, and read the trend from swing highs and lows rather than from an indicator.
- Mark point 1 at the swing that starts the move: a swing low for an up fork, a swing high for a down fork.
- Mark point 2 at the next swing in the trend direction: the high after point 1 in an up fork, the low after it in a down fork.
- Mark point 3 at the next retracement swing: the higher low in an up fork, the lower high in a down fork.
- Check the base. In an up fork point 3 must sit above point 1; in a down fork it must sit below. If it does not, the tool still draws three lines, but they describe a move that did not happen.
- Write down the three dates and prices. A fork you cannot rebuild exactly is an opinion, not a level.
- Redraw only when a new swing confirms, not because price stopped respecting the old lines.
Step 5 is where hand-drawn forks quietly go wrong. In this article's own count, using a five-bar swing rule on ES, 28 of 50 consecutive three-swing sequences in the 500-session sample failed it, so most raw swing triples are not valid forks at all.
The pivot rule itself should be written down too. A common mechanical choice is a five-bar fractal: a bar whose high is above the five bars on each side (a swing high), or whose low is below them (a swing low). The cost of that rule is delay, because a swing only confirms five bars after it prints.
Related lesson: Market structure highs lows and trends
Andrews' Pitchfork Calculation on a Real ES Fork
The Andrews' pitchfork calculation needs only the three pivots and a bar count. With point 1 at bar 0:
- Base midpoint price = (point 2 price + point 3 price) / 2.
- Base midpoint bar = (point 2 bar + point 3 bar) / 2.
- Slope = (midpoint price minus point 1 price) / midpoint bar, in points per session.
- Median line at any bar = midpoint price + slope x (bar minus midpoint bar).
- Line through point 2 = point 2 price + slope x (bar minus point 2 bar).
- Line through point 3 = point 3 price + slope x (bar minus point 3 bar).
Because all three lines of an Andrews' pitchfork share the slope, the gap between the median and either outer line never changes.
The worked ES fork
Here is a real up fork on the ES daily chart, from the continuous front-month series. Point 1 is the June 11, 2026 low at 7,232.25. Point 2 is the June 22, 2026 high at 7,599.25, 6 sessions later. Point 3 is the June 26, 2026 low at 7,357.25, 10 sessions after point 1, and it sits above point 1, so the base passes the check.
The base midpoint is (7,599.25 + 7,357.25) / 2 = 7,478.25, at session 8. The median rises 246.00 points over those 8 sessions, so the slope is 30.75 points a session. The line through point 2 sits at 7,660.75 on the midpoint bar, which puts the half-width at 182.50 points and the full channel at 365.00 points.
On a five-bar swing rule, point 3 only confirms 5 sessions later, on July 6, 2026. That is the first day the fork could honestly be drawn. On that day the median was 7,478.25 + 7 x 30.75 = 7,693.50, the upper line 7,876.00 and the lower line 7,511.00, with ES closing at 7,591.50.
| Sessions after July 6 | Date | High | Low | Close | Upper line | Median | Lower line |
|---|---|---|---|---|---|---|---|
| 0 | Jul 6 | 7,602.50 | 7,538.25 | 7,591.50 | 7,876.00 | 7,693.50 | 7,511.00 |
| 1 | Jul 7 | 7,601.25 | 7,529.50 | 7,551.25 | 7,906.75 | 7,724.25 | 7,541.75 |
| 2 | Jul 8 | 7,563.00 | 7,468.50 | 7,528.75 | 7,937.50 | 7,755.00 | 7,572.50 |
| 5 | Jul 13 | 7,615.25 | 7,547.25 | 7,563.00 | 8,029.75 | 7,847.25 | 7,664.75 |
| 10 | Jul 20 | 7,552.00 | 7,476.75 | 7,484.25 | 8,183.50 | 8,001.00 | 7,818.50 |
| 15 | Jul 27 | 7,524.75 | 7,416.25 | 7,448.25 | 8,337.25 | 8,154.75 | 7,972.25 |
| 20 | Aug 3 | 7,637.75 | 7,542.75 | 7,628.25 | 8,491.00 | 8,308.50 | 8,126.00 |
Every row reconciles by hand. July 8 is 7 sessions after point 3, so the lower line there is 7,357.25 + 7 x 30.75 = 7,572.50. If your platform prints a different number on the same three pivots, it is either using different bars or a different variant, and that is worth knowing before you trade off it.
How to Read Andrews' Pitchfork Lines and Signals
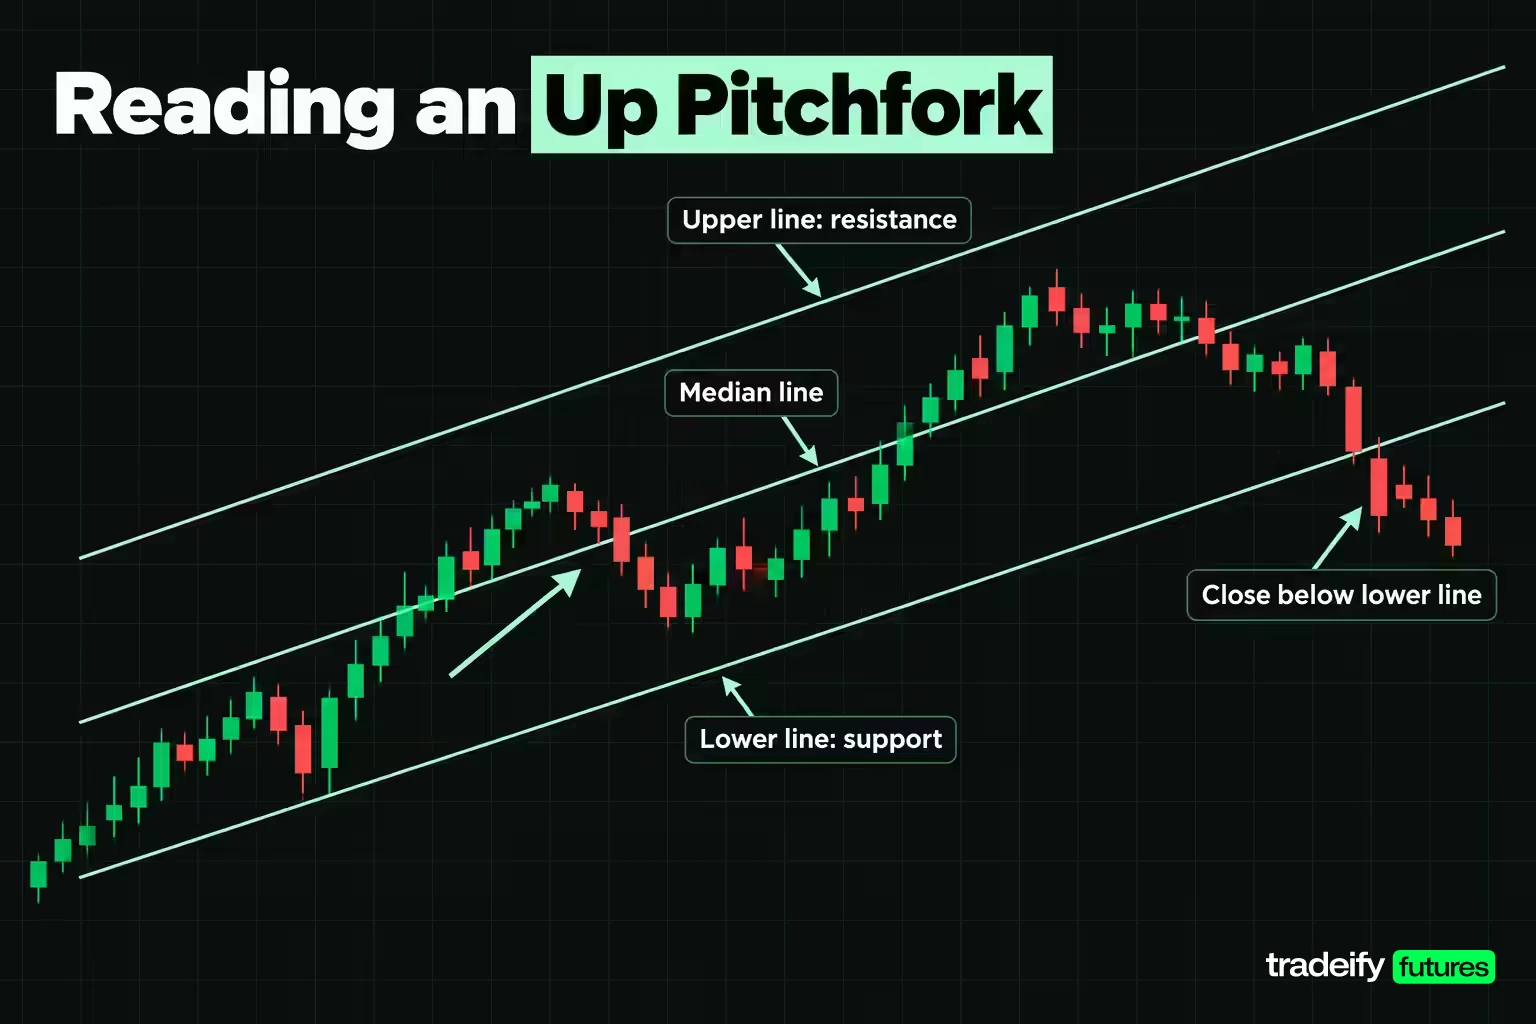
Andrews' pitchfork lines are read by position. In an up fork the lower line (through point 3) is treated as support, the upper line (through point 2) as resistance, and the median as the line price should keep reaching if the trend is healthy. In a down fork the roles flip.
- Bullish reading: in an up fork, price holding above the lower line and pushing to or above the median; in a down fork, a close above the upper line, which says the decline lost its pace.
- Bearish reading: in a down fork, price holding below the upper line and pressing the median; in an up fork, a close below the lower line.
- Trigger lines: some chartists add a line from point 1 through point 2 and a line from point 1 through point 3. A break of these earlier, flatter lines is treated as a signal before the fork itself breaks.
The worked ES fork shows how fast those readings get tested. On July 7, one session after the fork could be drawn, ES dipped to 7,529.50 under the lower line at 7,541.75 but closed above it at 7,551.25, which looks like support holding. The next day it closed at 7,528.75, below the lower line at 7,572.50. The lower line was rising 30.75 points a session and price was not.
So the bullish read lasted one session. That is the trap with a steep fork: the support line climbs away from price whether or not buyers keep up. Price never came near the median in the next 20 sessions; the highest high was 7,637.75 on August 3, with the median at 8,308.50.
How Often Price Reached Each Pitchfork Line in 500 Sessions
The Andrews' pitchfork study in this article used every valid fork in the last 500 completed daily sessions of ES and NQ, November 7, 2024 to November 3, 2026, from the continuous front-month series.
How the 500-session pitchfork study was run
The pitchfork study behind this article's figures was run on ES and NQ daily bars with these rules.
- Pivots: five-bar fractal swings, with consecutive same-type swings collapsed to the more extreme one.
- Forks: every consecutive three-swing sequence that passes the base check (point 3 above point 1 in an up fork, below in a down fork). That gave 21 testable forks on ES (14 up, 7 down) and 18 on NQ (10 up, 8 down), 39 in all.
- Start: the confirmation bar, 5 sessions after point 3, so the test never uses a swing before it could be known.
- Window: the next 20 sessions. A line counts as reached when a bar's high or low gets to it.
Pitchfork line reach rates on ES and NQ
| Line | ES forks reached | NQ forks reached | Combined |
|---|---|---|---|
| Trend-side line (through point 3) | 17 of 21 (80.95%) | 15 of 18 (83.33%) | 32 of 39 (82.05%) |
| Median line | 7 of 21 (33.33%) | 5 of 18 (27.78%) | 12 of 39 (30.77%) |
| Far line (through point 2) | 3 of 21 (14.29%) | 2 of 18 (11.11%) | 5 of 39 (12.82%) |
In this study the Andrews' pitchfork channel was symmetric on the chart and lopsided in practice. Point 3 is the most recent swing, so the line through it starts close to price and keeps moving toward it at the fork's slope. The far line starts a full channel width away. At confirmation, price was still inside the fork in 31 of 39 cases (79.49%), and the median full channel was 4.64% of price wide on ES and 7.34% on NQ.
A looser three-bar swing rule produced 69 forks and the same shape: trend-side line 61 of 69 (88.41%), median 16 of 69 (23.19%), far line 4 of 69 (5.80%). The ordering did not depend on the pivot rule.
Related lesson: Trendlines and channels
Testing the 80% Median Line Claims
Two 80% figures circulate about the Andrews' pitchfork median line, and the Quantified Strategies page on the pitchfork carries both. The first says price gravitates to the median about 80% of the time. The second says that once price gets through the median, it goes on to retest the far side of the channel about 80% of the time. Neither comes with a sample or a method.
The first claim did not hold for the standard fork in this article's 500-session ES and NQ study. The median was reached within 20 sessions in 12 of 39 forks (30.77%), and in 16 of 69 (23.19%) on the three-bar rule.
The second claim could not be settled. Median crossings were rare, because the median itself was rarely reached: the first close across the median produced only 11 cases, and 8 of 11 (72.73%) reached the outer line on that side within 20 sessions. That is close to the claim, and 11 cases are too few to confirm or reject it.
The honest conclusion is narrower than either claim. On a standard fork drawn from consecutive daily swings, a median crossing is an uncommon event, so a plan that depends on it will sit idle most of the time.
Pitchfork Trading Strategies at the Trend-Side Line and Median
Pitchfork trading strategies inside the channel usually come down to three plans: buy a test of the trend-side line in an up fork, sell a test of it in a down fork, and use the median as the first target. The sample says the first two need more care than most guides give them.
In this article's 500-session study of ES and NQ daily forks, 32 forks touched the trend-side line, and the touch bar closed back inside the fork 23 times (71.88%). That is the moment the line looks like support. But a close beyond the line followed on the touch bar or within the next five sessions in 26 of 32 (81.25%). A touch that held on the day usually failed within a week. That is exactly when a trader who bought the line feels most confident and is least protected.
A cleaner plan uses the line as a location, not a trigger:
- Entry: wait for the touch and for the next bar to close inside the fork, not just the touch bar.
- Invalidation: a close beyond the trend-side line, plus a buffer sized from the instrument's typical daily range, so normal noise does not stop the trade.
- Target: the median, with the far line treated as a low-probability extension.
- Redraw rule: decide before entry what new swing would replace the fork.
The same logic serves position management. If you already hold a trade in the trend's direction, the trend-side line is a reasonable place to review it, and a close beyond it is a reasonable place to reduce or exit. Moving a stop up the line each session is riskier, because on a steep fork the line rises faster than price.
Related lesson: Average true range atr
Trading Outside the Pitchfork
Trading outside the pitchfork means acting on closes beyond an outer line of an Andrews' pitchfork. There are two kinds. A close beyond the trend-side line goes against the fork, which is the classic warning of a trend change. A close beyond the far line goes with the fork and says the trend is accelerating past the channel.
In this article's 500-session ES and NQ study, almost every Andrews' pitchfork produced the first kind. Within 20 sessions of confirmation, the first close outside the fork was beyond the trend-side line in 37 of 39 forks. In 1 it was beyond the far line (an ES fork, which closed back inside), and 1 fork never closed outside at all.
What happened after those 37 closes outside:
| After a close beyond the trend-side line | Count | Share |
|---|---|---|
| Closed back inside the fork within 10 sessions | 14 of 37 | 37.84% |
| Traded a further half channel width beyond the broken line within 10 sessions | 30 of 37 | 81.08% |
The break usually kept going. That supports the textbook reading that a close outside the channel deserves respect. It also shows how often a standard fork breaks in the first place, which says more about steep forks than about trend changes.
A rule set for outside closes:
- Treat the first close outside as information, not an automatic reversal entry.
- Look for the old line to act as resistance (or support) on a retest before trading the new direction.
- If price closes back inside within a few sessions, stand aside; in the ES and NQ study that happened after 37.84% of outside closes, often enough to matter.
- Consider redrawing with a flatter variant, because a fork that breaks in two sessions was probably too steep.
Related lesson: Breakout trading
Why Point 1 Makes the Pitchfork Subjective
Point 1 sets the slope of Andrews' pitchfork, and nothing in the method fixes it. Chart guides openly say there are no hard rules for point placement, and that steep forks break easily while flat ones miss the trend.
This article's 500-session ES and NQ study puts a number on that. For each fork, point 1 was swapped for the previous swing of the same type, as long as the base check still passed, while points 2 and 3 stayed put. Twenty sessions after confirmation, the median moved by a median of 93.04% of the channel width on ES and 74.17% on NQ. In 23 of 30 cases it moved by more than half the channel width, and on the widest ES case by 214.05%. The slope direction never flipped.
Two chartists who agree on points 2 and 3 can therefore end up with medians nearly a full channel apart. The fix is not to search for the correct point 1. It is to write the rule (for example, "the swing immediately before point 2") and never change it after seeing the result.
Schiff and Modified Schiff Pitchfork Variants
Schiff and modified Schiff pitchforks move the origin of the median line away from point 1 to flatten the standard Andrews' pitchfork. Platform documentation does not agree on the names. One major charting platform describes both of its Schiff tools as starting halfway between points 1 and 2 on price and time. Another describes Schiff as moving the start halfway toward the base and modified Schiff as shifting it by half the price difference. Check what your own platform does before you compare forks across platforms.
This study tested both constructions by what they do, not by name:
- Variant A: origin halfway between points 1 and 2 in price, on point 1's bar.
- Variant B: origin halfway between points 1 and 2 in both price and time.
| Fork | Slope vs standard | Width vs standard | Median reached | Trend-side line reached | Far line reached |
|---|---|---|---|---|---|
| Standard | 1.00 | 1.00 | 12 of 39 (30.77%) | 32 of 39 (82.05%) | 5 of 39 (12.82%) |
| Variant A, price shift | 0.264 to 0.276 | 0.775 | 34 of 39 (87.18%) | 31 of 39 (79.49%) | 18 of 39 (46.15%) |
| Variant B, price and time shift | 0.412 to 0.414 | 0.828 to 0.833 | 26 of 39 (66.67%) | 33 of 39 (84.62%) | 15 of 39 (38.46%) |
Variant A cut the slope to about a quarter of the standard and made the channel about 22% narrower. On those flatter forks, the median was reached in 34 of 39 cases. That is the version that comes closest to the "price returns to the median" idea. All variants kept the standard slope direction on all 39 forks, because a valid base keeps the median pointing the same way.
Schiff pitchfork on the worked ES fork
On the worked ES fork from June 2026 (points at 7,232.25, 7,599.25 and 7,357.25), the price-shifted Schiff fork (origin halfway between points 1 and 2 in price, on point 1's bar) starts at 7,415.75 on June 11 and rises 7.81 points a session instead of 30.75, with a half-width of 136.63. Its median read 7,532.94 on July 6, and ES closed on both sides of it five times in the next eight sessions, which is what a median that price "gravitates to" looks like. Its lower line held on a closing basis for 12 sessions, until July 23, when ES closed at 7,445.00 against a line at 7,497.88. By August 3 price was back inside at 7,628.25. The standard fork on the same pivots broke on day 2.
Using Andrews' Pitchfork on Intraday Futures Charts
Andrews' pitchfork works on any chart with clear swing pivots, including intraday futures charts. The geometry is the same; only the bar changes. This study used daily bars, so its percentages describe daily forks, not 5-minute ones, and an intraday trader should re-measure on their own timeframe before trusting any of the rates.
A practical way to combine the two is to let a daily fork define location and an intraday chart define timing. If a daily trend-side line sits near today's range, that is a level to watch, and the entry, stop and target still come from the intraday structure and your own risk rules.
On our accounts, every position is closed by 4:45 PM ET and nothing is held overnight, so a daily fork can frame the day but never justifies carrying a trade into the next session. You can draw pitchforks on supported platforms such as Tradovate, NinjaTrader, TradingView through the Tradovate connection, Quantower, Sierra Chart or WealthCharts, and WealthCharts' Chart Replay lets you practise marking pivots on historical bars before using a fork live. Evaluation and funded accounts are simulated.
Related lesson: Multiple timeframe analysis
Limits of the 500-Session Pitchfork Study
These Andrews' pitchfork results come from two US equity index futures markets over 500 daily sessions, so they say nothing direct about single stocks, forex, crypto, commodities or intraday charts.
- Pivot rule: a different swing definition gives different forks. The three-bar check kept the same ordering, but the exact rates moved.
- Point 1: as measured, point 1 alone can move the median by most of a channel width, so any rule that picks it differently will shift the touch rates.
- Sample size: 39 forks, 11 median crossings and 37 outside closes are small counts. Treat the percentages as descriptions of this sample, not constants.
- Data: the series is a continuous front-month chart, which joins contracts at each roll and can show small jumps at the seams. That suits a pattern question like this one and would not suit a full trading backtest.
- Regime: ES rose from 6,003.75 to 7,596.75 and NQ from 21,224.75 to 28,305.75 over the sample, which favors up forks (24 of the 39). A long downtrend or a range could produce different rates.
Andrews' Pitchfork FAQ
What is Andrews' pitchfork in trading?
Andrews' pitchfork is a channel drawn from three swing pivots. A median line runs from the first pivot through the midpoint of the second and third, and two parallel lines pass through those pivots. Traders use it to frame trend direction and to mark possible support and resistance.
Who invented Andrews' pitchfork?
The tool is credited to Alan Andrews, and it carries his name. The Schiff and modified Schiff variants are named versions that move the starting point of the median line to flatten the fork.
How do you draw Andrews' pitchfork?
Mark a swing low, the next swing high, and the next higher low for an up fork, or the mirror for a down fork. The median runs from point 1 through the midpoint of points 2 and 3, and the outer lines run parallel through points 2 and 3. Write down the three pivots so you can rebuild the fork.
Does price return to the median line 80% of the time?
Not on standard Andrews' pitchfork drawings in this article's ES and NQ study. The median was reached within 20 sessions in 12 of 39 ES and NQ forks (30.77%). A flatter Schiff-style fork reached its median in 34 of 39 (87.18%).
Is Andrews' pitchfork better than a regular channel?
Andrews' pitchfork is not automatically better, but it is more rule-based than a hand-drawn channel, because its median and width come from three pivots. It also adds a middle line. Its weakness is point 1: in this article's ES and NQ study, swapping point 1 alone moved the median by 93.04% of the channel width on ES in the median case.
Which pitchfork variant should you use?
No single pitchfork variant is correct for every market, so use the one you have tested on your own chart. In this article's 500-session ES and NQ study, standard forks were usually too steep and broke quickly. A price-shifted Schiff fork reached its median in 34 of 39 forks (87.18%) and contained price longer.
This article is for education only and is not trading advice. Futures are leveraged and losses can exceed what you expect, especially when a level breaks quickly. The measurements describe past ES and NQ data under one stated rule set and do not predict future results. Evaluation and funded trading accounts are simulated.


