




TL;DR: Trendlines and channels turn swing points into two prices, the level where your idea is wrong and the level price already reached. A trendline needs a third touch before it predicts anything, and a break needs a close beyond it, not a wick. Put stops beyond the line with a buffer, and use the opposite boundary or the measured move as the target. Choose wicks or closes once, because that choice can move a break signal by several bars.
Most traders draw their first trendline the same way. They see price bounce twice, connect the two lows, and buy the next time price comes back. Sometimes it works. Often the line breaks on the very bar they bought, and nobody can say afterwards whether the line was wrong, the entry was wrong, or the market simply did something lines cannot describe.
Trendlines and channels are worth learning properly because they answer two questions every trade needs answered before entry: where the idea stops being true, and where price has a structural reason to go. The method here goes in the order the decisions happen: mark the swings, draw and test the line, project the channel, choose how to enter, and size the risk. One illustrative channel on Micro E-mini S&P 500 (MES) futures runs through every step bar by bar, including the trade that gets stopped out, because that trade teaches more than the one that works.
What Trendlines and Channels Are
A trendline is a straight line drawn through swing points in the direction of the trend. In an uptrend it connects rising swing lows and acts as support. In a downtrend it connects falling swing highs and acts as resistance. The line does not create the trend. An uptrend is a sequence of higher highs and higher lows, and the line is just a compact way of describing where those higher lows have been forming.
A trading channel adds a second line, parallel to the first, on the other side of price. In an uptrend the parallel runs through the swing highs; in a downtrend it runs through the swing lows. Price then trades inside a band with a floor and a ceiling that both move at the same slope.
That band does two jobs in technical analysis, and both matter more than the drawing itself:
- Invalidation. The trendline marks the price at which the trend description stops fitting. If you bought because higher lows were holding, a close through the line is the market telling you the reason for the trade is gone.
- Projection. The parallel line marks where price has repeatedly travelled within the same structure, which makes it a target with a reason behind it rather than a number picked after entry.
A single trendline gives you only the first job. A channel gives you both, which is why traders who start with trendlines usually end up drawing channels. Having the target decided before entry also removes one of the harder in-trade decisions, the one where a winning position tempts you to grab profit early or hold for more.
Related lesson: Market structure highs lows and trends
Finding the Swing Points a Trendline Needs
A trendline is only as good as the swing points under it, so mark the swings before you draw anything. Drawing first and then looking for points that fit is how a trader ends up with a line that confirms whatever they already wanted to do.
Use a fixed rule so the same chart gives the same swings every time. A common one: a swing low is a bar whose low is lower than the lows of the two bars on each side of it, and a swing high is a bar whose high is higher than the highs of the two bars on each side. Some traders use three bars each side for fewer, more significant swings. The exact number matters less than using the same number every time.
That rule has a cost worth knowing. A swing low with two bars on each side is only confirmed two bars after it prints, because you need those two later bars to see that price did not go lower. A trendline anchored on an unconfirmed low can move as soon as the next bar trades through it.
In the illustrative MES series used in this guide, the two-bars-each-side rule marks swing lows at bar 6 (low 5002.00) and bar 22 (low 5026.00), and swing highs at bar 14 (high 5035.00) and bar 30 (high 5059.00). Each higher low and higher high confirms an uptrend before a single line is drawn. If you cannot point to that sequence first, a line connecting two lows is just a line.
How to Draw a Trendline Step by Step
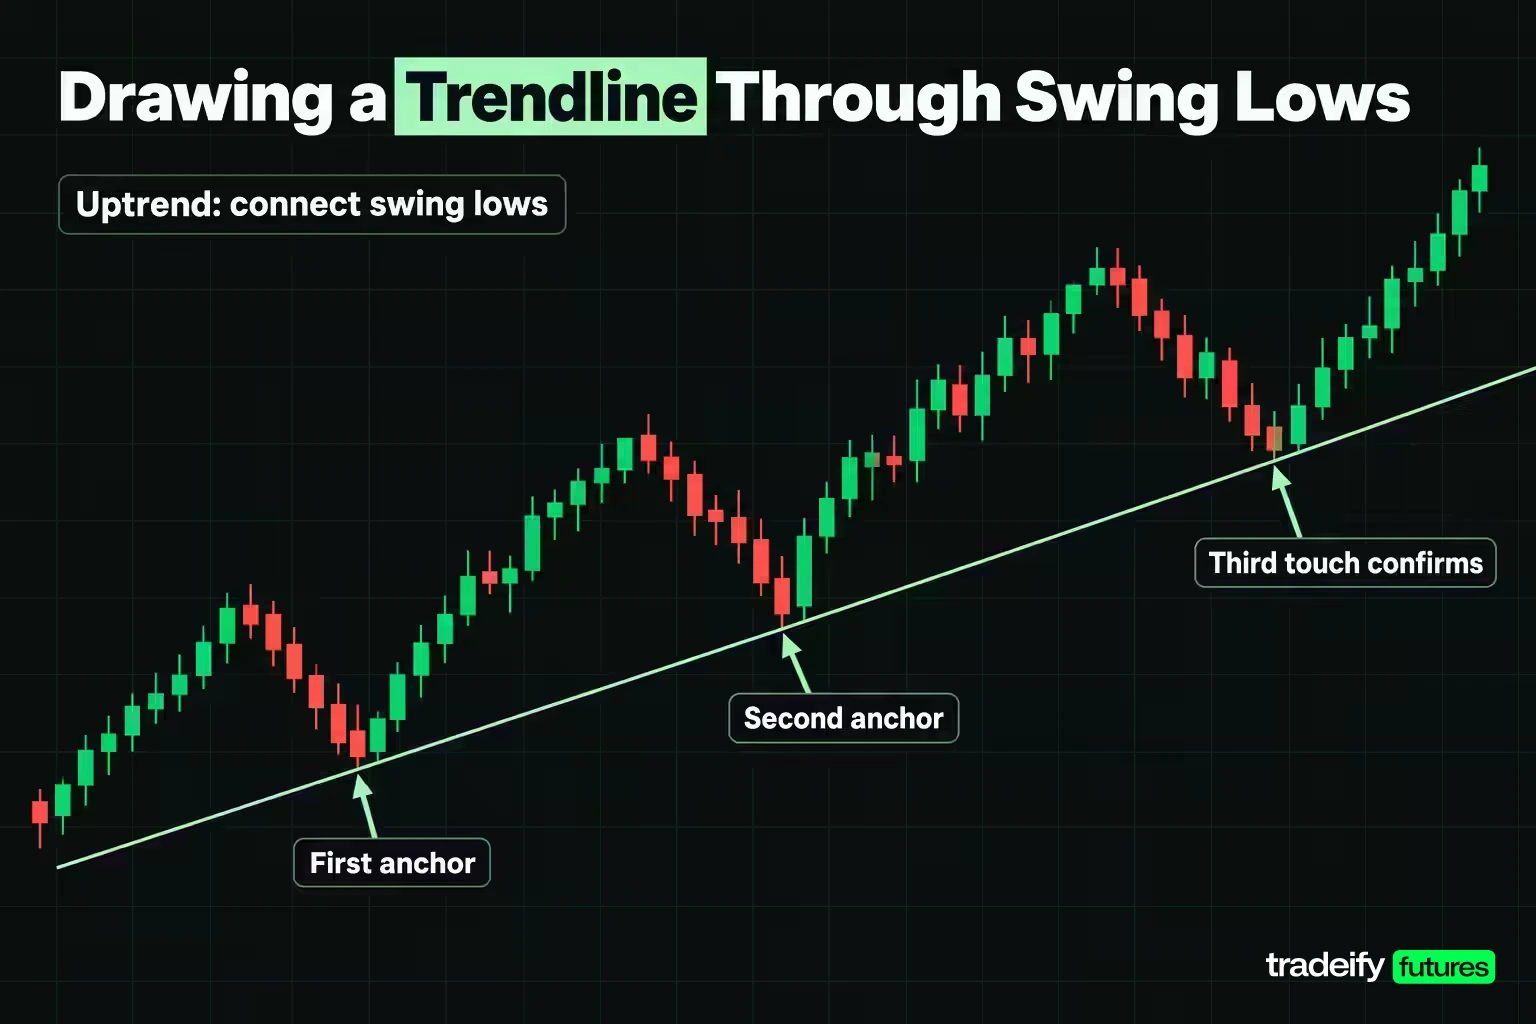
Drawing a trendline involves four decisions. Make each one before you look at where the line lands, and apply it the same way on every chart.
- Choose the side. In an uptrend, connect swing lows. In a downtrend, connect swing highs. The line goes on the side price is leaning against, because that is where the trend description can fail.
- Choose the anchors. Use the two most significant confirmed swing points of the current trend, usually the lowest low of the move and a later higher low. Do not skip a swing that does not fit the line you want.
- Choose wicks or closes. Wick extremes capture every price traded, including spikes that were rejected at once. Closing prices capture where price settled and ignore brief spikes. Both are defensible, and they produce different lines.
- Set a tolerance. Write down in ticks how close price must come to count as a touch. A trendline is a zone, not an exact price, and if you set the tolerance after seeing the bar you will set it to match the answer you wanted.
For the illustrative MES trendline in this guide, the tolerance is 2 ticks. MES moves in ticks of 0.25 index points worth $1.25 each, so 2 ticks is 0.50 points or $2.50 per contract.
The third touch and what it proves
Two points always make a line, which is geometry, not evidence. The first touch after the two anchors is the first time the line predicts anything, because price arrived at a level it had never traded and reacted there. Until that third touch, treat the line as a hypothesis and size it like one.
In the illustrative series, the line through bar 6 at 5002.00 and bar 22 at 5026.00 rises 1.5 points per bar. It projects to 5050.00 at bar 38, and bar 38 prints a low of exactly 5050.00. That is the third touch. More touches after that suggest more traders are watching the same line, which is part of why lines with several touches tend to draw stronger reactions, and also why the stops sitting under them can get hit all at once.
Slope, scale and redrawing a trendline
Steep lines break sooner than shallow ones, because a steep trendline asks price to keep accelerating. When the first line is very steep, many traders wait for a second, shallower line to form before relying on it.
Chart scale changes the line too. On a linear scale, equal price distances look equal; on a logarithmic scale, equal percentage moves look equal. Over a few hours of intraday bars the difference is tiny, but over months on a fast-moving market a line drawn on one scale can sit far from the same anchors drawn on the other. Pick a scale and keep it.
Redraw only for a reason you could write down in advance, such as a new confirmed swing low that sets a new anchor. Redrawing a line after it breaks, so that the trade you are in still looks valid, is the trendline version of moving a stop.
Building a Channel From a Trendline
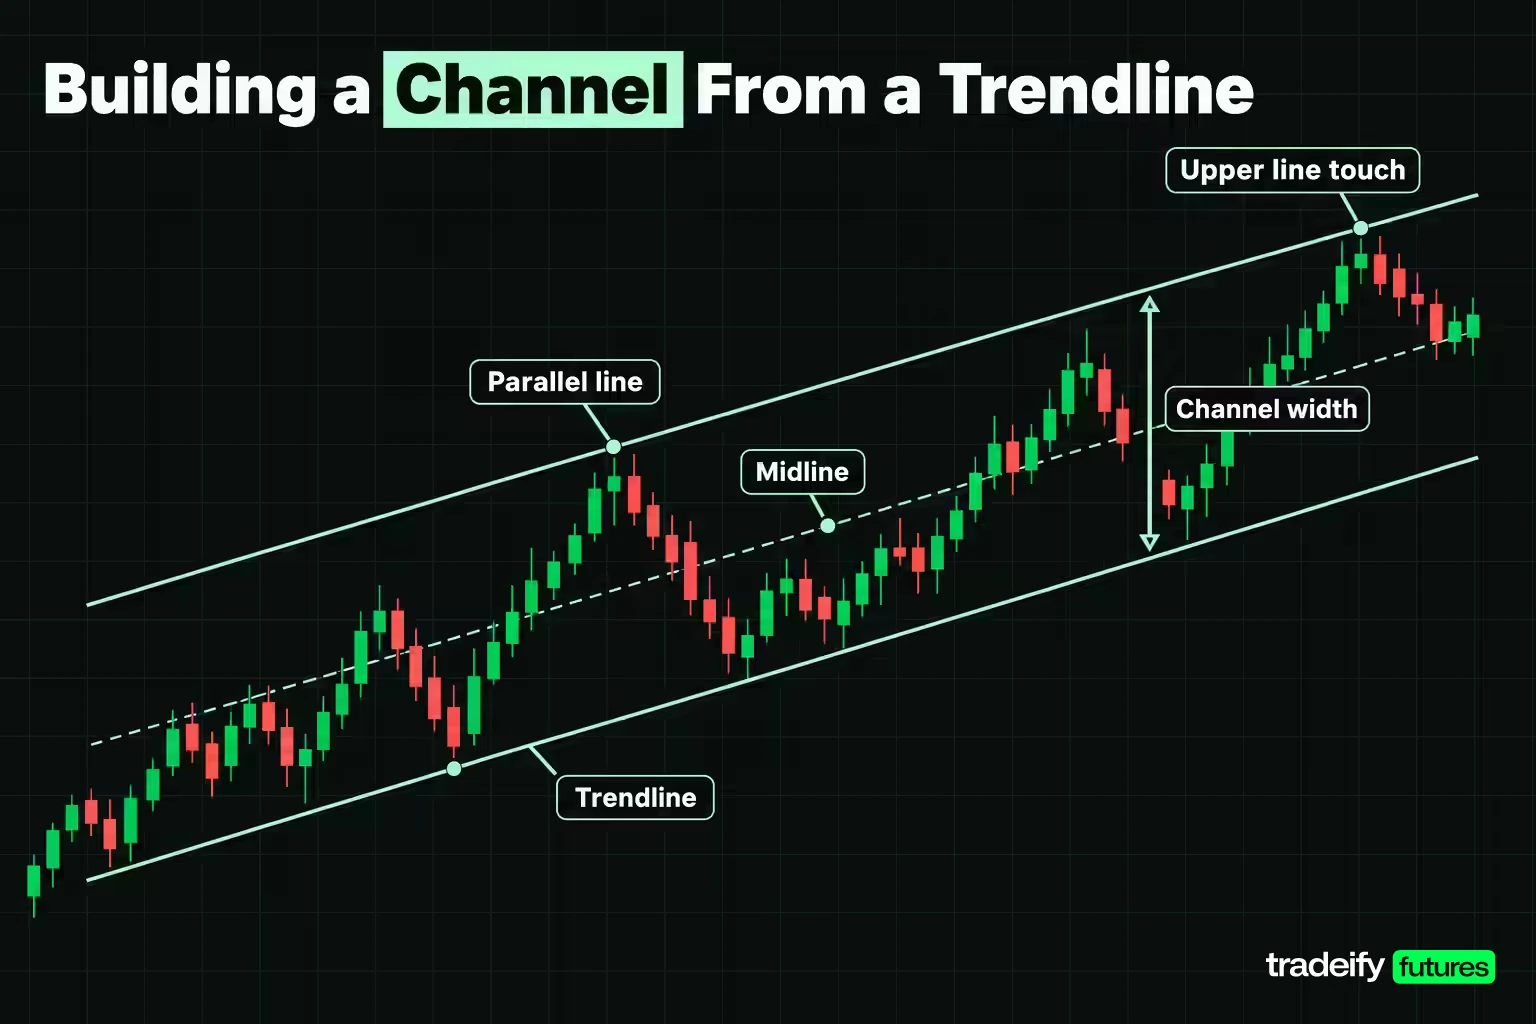
Once the trendline is drawn, the channel is a copy of it moved to the other side of price. In an uptrend, place the parallel through the highest swing high between the two anchors; in a downtrend, through the lowest swing low between them. Most charting platforms have a parallel channel tool that does this with three clicks: two anchors and the opposite swing.
In the illustrative MES series, the trendline sits at 5014.00 at bar 14, and bar 14 is the swing high at 5035.00. That puts the parallel 21.00 points above the trendline at every bar. Bar 30 then prints a high of exactly 5059.00, which is where the upper line projects to at bar 30, so the upper boundary earns its own confirming touch.
Channel width in points, ticks and ATR
Width is what turns a channel into numbers you can trade. Measure it two ways:
- In points or ticks, so you can compare it directly with your stop distance and target. The illustrative channel is 21.00 points wide, which is 84 ticks, or $105.00 per MES contract from boundary to boundary.
- In multiples of average true range (ATR), so you can compare channels across markets and sessions. Using a simple 14-bar average of true range, ATR at bar 38 is about 3.70 points, so the channel is about 5.7 average bars wide.
A channel several ATRs wide gives a stop beyond one boundary room to sit outside ordinary bar noise while the other boundary still offers a meaningful target. A channel only one or two ATRs wide is mostly noise, and a stop beyond its boundary is likely to be hit by the next routine bar.
The midline and the measured move
The midline sits halfway between the two boundaries. Inside a healthy channel, price often pauses there, and some traders use it as a first target or as the point where a stop moves to breakeven.
The width also supplies a projection after a break. A common practice is to measure the channel width from the price where the break closed, on the reasoning that price has shown it can travel that distance inside the structure. Treat that measured move as one hypothesis about the next leg, not as a rule the market owes you.
Ascending, Descending and Horizontal Channels
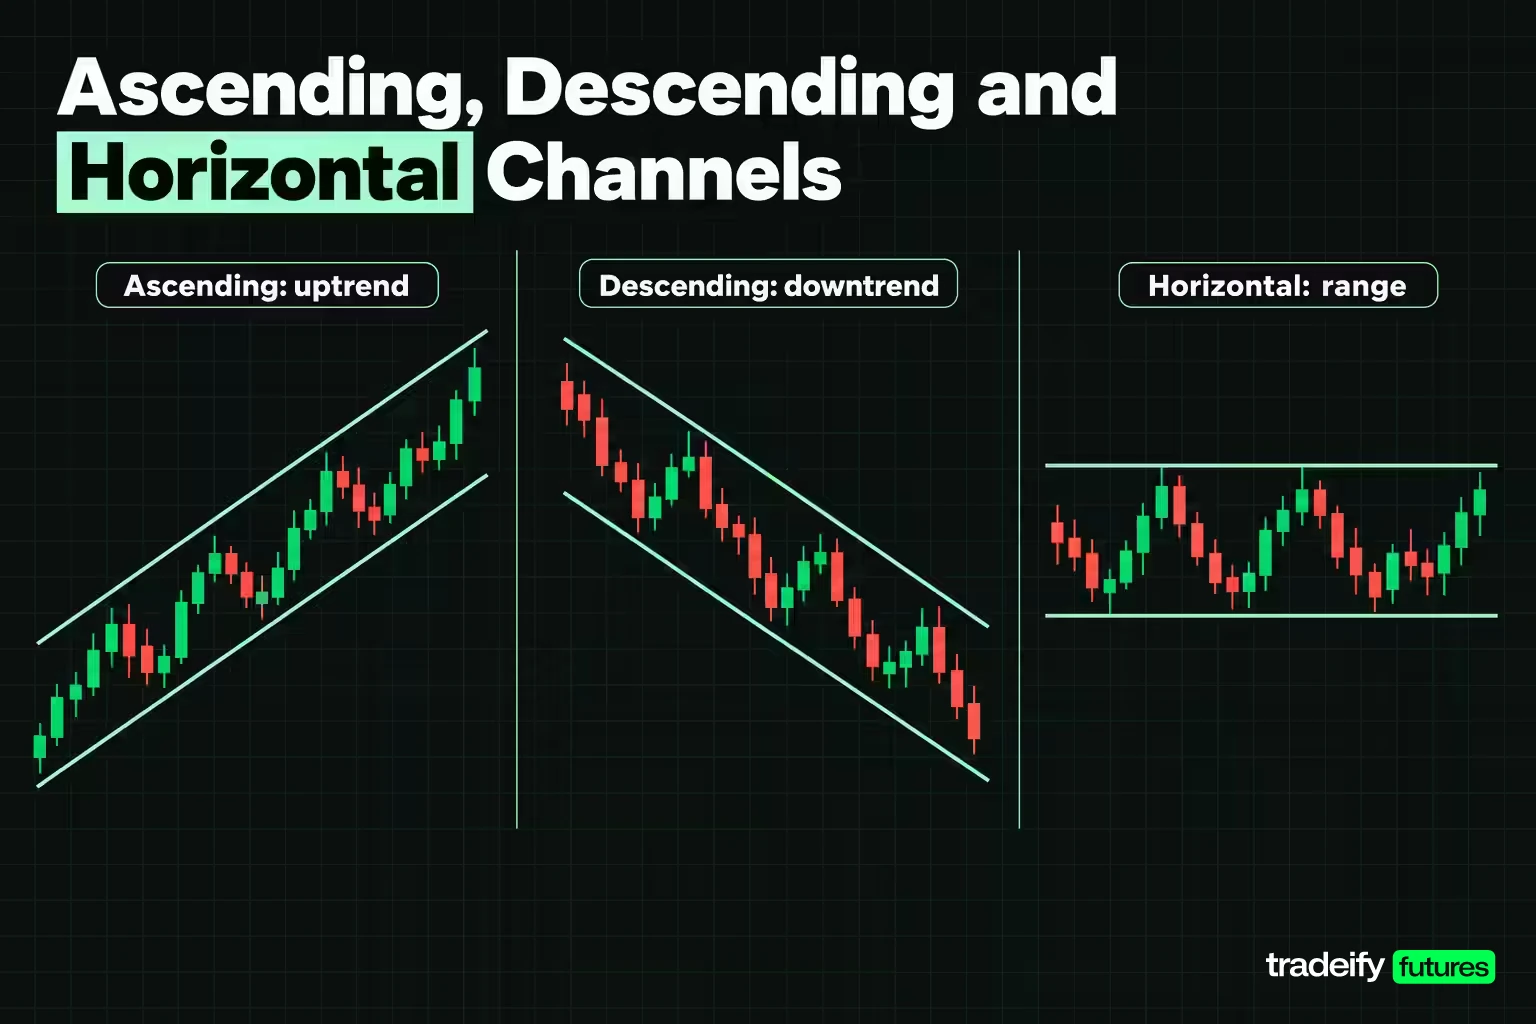
Channels come in three types, defined by the slope of their boundaries. Each one tells you which boundary is working with the trend and which against it.
| Channel type | Boundaries | What it describes | With-trend boundary |
|---|---|---|---|
| Ascending channel | Rising support and parallel rising resistance | Uptrend, higher highs and higher lows | Lower line, buying pullbacks |
| Descending channel | Falling resistance and parallel falling support | Downtrend, lower highs and lower lows | Upper line, selling rallies |
| Horizontal channel | Flat support and flat resistance | Range, no trend | Neither, both edges are fades |
An ascending channel is a description of an uptrend, but it is not automatically bullish from every point inside it. Buying near the upper boundary of an ascending channel means buying where price has repeatedly stalled. A descending channel works the same way in reverse.
A horizontal channel is really a trading range drawn with parallel lines. Ranges behave differently from trends: there is no directional structure for the lines to describe, so they tend to be tested repeatedly from both sides and to break in either direction. Treating a range as a channel is fine, as long as you remember the edges are support and resistance levels, not a trend.
Related lesson: Support and resistance
Some traders also draw channels with converging lines, such as wedges and triangles. Those are separate patterns with different expectations, because the narrowing range changes how breaks behave. A channel in the strict sense has parallel boundaries.
Channel Trading Strategies That Use Both Lines
Channel trading strategies fall into two families: trading the bounce inside the channel, or trading the break out of it. Which one fits depends on the channel type and on which boundary price is testing.
Bounce strategies inside a channel
- With-trend bounce. In an ascending channel, buy at or near the lower boundary; in a descending channel, sell at or near the upper boundary. This is the highest-quality bounce because it agrees with the trend the channel describes. The stop goes beyond the boundary and the target is the midline or the opposite boundary.
- Counter-trend fade. In an ascending channel, short at the upper boundary; in a descending channel, buy at the lower boundary. These trades bet against the trend, so they usually deserve smaller size and nearer targets such as the midline. A trend that is accelerating can run through the opposite boundary rather than reversing at it.
- Range trading in a horizontal channel. With no trend, both edges are fades: buy near support, sell near resistance, and exit near the opposite edge or the middle. Range trades fail when the range ends, so a close outside the range is the exit.
Breakout strategies from a channel
- Break and close. Enter after a bar closes beyond a boundary by more than your tolerance. This catches moves early but takes every false break that closes beyond the line before reversing.
- Break and retest. Wait for price to break, then come back to the broken line, and enter when the old boundary acts as the opposite kind of level. Broken support turning into resistance (or the reverse) is one of the more repeatable behaviours in this topic. The cost is the trades where price never comes back.
A channel trader also has a third choice that is easy to forget: do nothing. A bar in the middle of the channel offers neither a nearby invalidation level nor a reason to expect direction, so it usually offers a poor trade.
Related lesson: Breakout trading
Trading a Pullback to the Channel Line
A pullback setup in a channel means waiting for price to retrace to the with-trend boundary and entering as it reacts there. There are two common ways to enter, and they produce very different trades from the same bars.
The illustrative MES ascending channel in this guide has a lower trendline rising 1.5 points per bar, sitting at 5050.00 at bar 38. Both entries use a $50,000 illustrative account risking $150 per trade (0.3%), and MES is worth $5 per index point.
Resting limit versus confirmation close on a channel pullback
Entry A: resting limit at the line. Place a buy limit 0.50 points above the projected line, at 5050.50, with a stop 2.00 points under the line at 5048.00. Risk is 2.50 points, or $12.50 per contract, so the $150 budget buys 12 contracts. Bar 38 fills the order. Bar 39 then trades down to 5046.50, 20 ticks through the line, and fills the stop. The loss is the full $150. Bar 39 closes at 5051.50, exactly on the line, which is the frustrating part: the stop was hit on a bar that ended up holding.
Entry B: confirmation close. Wait for a bar to close back above the line after testing it, and enter on that close. Bar 39 closes on the line, not above it, so the trader waits. Bar 40 closes at 5054.25, above the line at 5053.00, and the trader buys there with a stop 1 tick under the bar 39 low, at 5046.25. Risk is 8.00 points, or $40.00 per contract, so the budget buys 3 contracts ($120 at risk). The exit rule is a close through the line by more than 2 ticks. Bar 42 closes at 5053.00, 12 ticks under the line, and the trader exits for a loss of 1.25 points on 3 contracts, or $18.75.
Neither entry is always better, and the choice usually says more about the trader than the chart. The resting limit gets the best price and the largest size, and it is the one that suffers when a line gets poked before it holds. The confirmation entry pays a worse price and takes smaller size, but it lets a bar like bar 39 show its hand first. In this series the line eventually failed anyway, and the confirmation trader's exit rule cut the damage to a fraction of the limit trader's.
Stop Loss and Take Profit in a Channel
A channel gives you both exit levels before you enter, and that is its main practical value. The near boundary defines the stop. The far boundary, the midline or a measured move defines the target. The ratio between them tells you whether the trade is worth taking.
Where the stop goes in channel trading
Put the stop beyond the boundary, not on it. A stop sitting exactly on a widely watched line sits where many other stops sit, which is often where price reaches just before reversing. A buffer pushes the stop past the zone where ordinary noise around the line plays out.
Size the buffer in relation to volatility rather than as a fixed number. In the illustrative MES channel, ATR at bar 38 is about 3.70 points. A 2.00-point buffer is about 0.54 ATR, and the full 2.50-point stop on a long bought at the bar 38 third touch (entry 5050.50, stop 5048.00) is about 0.68 ATR. Bar 39 then traded 5.00 points under the line, more than a full ATR, which shows how thin a buffer of half a bar really is. A stop that wide is not wrong, but it should be chosen knowing that one normal-sized poke can reach it.
Take profit levels in a channel
Three take profit targets come straight from a channel. The examples use an illustrative MES ascending channel 21.00 points wide, where a long (Entry A) bought the trendline's third touch at 5050.50 with a 2.50-point stop at 5048.00.
- The midline, a nearer target that suits counter-trend fades and partial exits.
- The opposite boundary, the natural target for a with-trend bounce. For Entry A, the upper line at bar 38 sits at 5071.00, which is 20.50 points above the 5050.50 entry, or 8.2 times the 2.50-point risk.
- The measured move, the channel width projected from a break, for breakout trades.
A target 8.2 times the risk looks great on paper. Tight stops buy that ratio with a lower chance of being right, and Entry A paid that price one bar later. A reward-to-risk ratio only means something next to an honest estimate of how often the stop gets hit.
Sizing a channel trade from the stop
Position size comes from the stop distance, not the other way round. Divide the dollar risk budget by the stop distance in points times the point value, and round down. Widen the stop and size falls, which is the correct response to a wider invalidation level, not a reason to keep the size and hope.
Related lesson: Position sizing
How Long a Channel Swing Usually Takes
A channel tells you where price might go, and the history of the channel also tells you roughly how long it has taken to get there. Count the bars between previous touches of opposite boundaries, and you have a working estimate of how long the next swing could take.
In the illustrative MES series, price moved from the lower line at bar 6 to the upper line at bar 14, then back to the lower line at bar 22, up to the upper line at bar 30, and down to the lower line at bar 38. Every leg took 8 bars. On 5-minute bars, that is 40 minutes from boundary to boundary.
That rhythm gives a long entry at bar 38 a time expectation as well as a price target: if the channel keeps behaving the same way, the upper boundary would be due around bar 46, where it projects to 5083.00. It also gives a time stop. If a with-trend trade from the lower line has made little progress toward the midline after the full duration of a normal leg, the channel is behaving differently than before, and that is a reason to reduce or exit even if the price stop has not been touched.
Do not treat the bar count as a schedule. Channels slow down and speed up, especially around session opens, scheduled data and the end of a session. The estimate is a check on whether the trade is behaving like the channel you drew, nothing more.
A Worked Channel Trading Example on MES Futures
This worked channel example uses an illustrative series of 47 five-minute MES bars, constructed so every level can be checked by hand. It is a method demonstration, not market history and not a backtest. MES moves in ticks of 0.25 points worth $1.25, or $5 per index point, and the illustrative account is $50,000 risking $150 per trade.
Building the worked MES channel from four swings
- Swing lows: bar 6 at 5002.00 and bar 22 at 5026.00. The trendline rises 24.00 points over 16 bars, or 1.5 points per bar.
- Swing high for the parallel: bar 14 at 5035.00, with the trendline at 5014.00 on that bar, so the channel is 21.00 points wide.
- Upper boundary confirmation: bar 30 prints a high of 5059.00, exactly on the upper line.
- Third touch of the trendline: bar 38 prints a low of 5050.00, exactly on the lower line.
- Volatility: ATR (simple 14-bar average of true range) at bar 38 is about 3.70 points, so the channel is about 5.7 ATR wide.
What happened after the third touch
| Step | Bar | Level | Reading |
|---|---|---|---|
| Second anchor | 22 | 5026.00 | Line drawn, two points only |
| Upper boundary touch | 30 | 5059.00 | Channel width of 21.00 confirmed |
| Third touch, Entry A filled | 38 | 5050.50 | Long 12 MES, stop 5048.00 |
| Poke through the line | 39 | 5046.50 | Stop filled, $150 loss, bar closes on the line at 5051.50 |
| Entry B on confirmation close | 40 | 5054.25 | Long 3 MES, stop 5046.25 |
| Lower swing high | 41 | 5057.25 | First swing high under the bar 30 high of 5059.00 |
| Break close | 42 | 5053.00 | 12 ticks under the line, whole bar under it, Entry B exits for $18.75 loss |
| Retest of the broken line | 45 | 5060.50 | High touches the old line, close 5058.50 is 8 ticks under it |
| Short on the retest | 45 | 5058.50 | Short 5 MES, stop 5064.00, target 5032.00 |
| End of series | 46 | 5049.00 | Short is 9.50 points ahead, 17.00 points from target |
Two details are easy to miss on a live chart. First, bar 41 made a swing high of 5057.25, under the bar 30 high of 5059.00, while price was still above the trendline. That lower high was a structural warning one bar before the line broke. Second, the break bar did not just poke through. Bar 42 closed 12 ticks under the line with its high 1 tick under it, so the entire bar traded under the line.
The breakdown trade and the measured move
In the illustrative MES ascending channel, 21.00 points wide with a trendline rising 1.5 points per bar, bar 42 broke the trendline with a close at 5053.00, and bar 45 retested the broken line at 5060.50 before closing 8 ticks under it. After a break, the channel width projects the next target. The measured move is the 5053.00 break close minus the 21.00-point width, or 5032.00.
The short on the retest enters at the bar 45 close of 5058.50, with a stop 2.00 points above the old line's bar 46 level of 5062.00, at 5064.00. Risk is 5.50 points, or $27.50 per contract, so the budget allows 5 contracts and $137.50 at risk. The target is 26.50 points away, about 4.8 times the risk.
By the bar 46 close of 5049.00, the short is 9.50 points ahead, or $237.50 on 5 contracts, and has covered about 36% of the distance to the target. The series ends 17.00 points short of the measured move. That is the realistic version of a pattern target: a reason to hold, not a promise of arrival.
One more number is worth sitting with. A trader who bought 12 contracts at the bar 38 third touch (5050.50, stop 5048.00), ignored the stop when bar 39 hit it, and held to the final close of 5049.00 would have lost $90 instead of $150, so ignoring the stop "worked" here. It worked on one constructed series. The stop was there because the reason for the trade was the line, and when price traded 20 ticks through the line, that reason was gone. Holding through stops is a habit that only has to meet one line that does not come back.
Wick Trendlines Versus Close Trendlines
Drawing a trendline on wicks or on closing prices is often presented as a matter of taste. On the illustrative MES series, the same two swing-low bars produce two lines that disagree about when the trend broke.
The wick trendline runs through the bar 6 low of 5002.00 and the bar 22 low of 5026.00. The close trendline runs through the closes of those same bars, 5004.75 and 5028.75. Both rise 1.5 points per bar, so they are parallel, but the close line sits 2.75 points (11 ticks) higher at every bar.
| Reading | Wick trendline | Close trendline |
|---|---|---|
| Anchors | Bar 6 at 5002.00, bar 22 at 5026.00 | Bar 6 at 5004.75, bar 22 at 5028.75 |
| Slope | 1.5 points per bar | 1.5 points per bar |
| Line level at bar 38 | 5050.00 | 5052.75 |
| Bar 37 | Low 9 ticks above the line, no test | Close 1 tick under the line, a touch within tolerance |
| Bar 38 | Low exactly on the line, third touch | Close exactly on the line, another touch |
| Bar 39 | Close exactly on the line, still intact | Close 11 ticks under the line, a break |
| First close beyond the tolerance | Bar 42, 12 ticks under | Bar 39, 11 ticks under |
The close-line trader reads bar 39 as a break, three bars before the wick-line trader does. Under the close convention, bar 39 is a sell signal; under the wick convention, bar 39 is a successful test. The bars did not change. The drawing convention did.
Neither convention is wrong. The error is switching between them on the same chart, or between sessions on the same market, and then comparing results from what feels like the same signal. Write your convention into your trading plan and test it the same way every time.
When a Trendline or Channel Break Is Real
No test can say in advance which breaks will follow through, but several signals separate breaks that deserve attention from pokes that are mostly noise.
- A close beyond the line, not a wick. In the illustrative MES series, bar 39 traded 20 ticks through the wick trendline but closed exactly on it. Bar 42 closed 12 ticks under it with the whole bar beneath the line. Those are different events.
- The retest. After a real break, price often comes back to the broken line. If the old trendline now rejects price from the other side, as bar 45 did by touching 5060.50 and closing 8 ticks back under it, the break has passed its first test.
- Structure agreeing with the line. A lower swing high before the break, like bar 41 at 5057.25 under the bar 30 high, suggests the trend was weakening before the line gave way.
- A reason beyond the line. Breaks that come with a session open, a scheduled data release or a clear jump in volume have more participants behind them than a break during a quiet stretch.
- The higher timeframe. A line on a 5-minute chart is watched by far fewer traders than one on a daily chart. A lower-timeframe break against a higher-timeframe channel deserves more suspicion.
Related lesson: Multiple timeframe analysis
Auditing a trendline with a close count
Claims that "the line is holding" are usually made from memory. A simple audit replaces memory with a count. Measure each bar's low (for a support line) against the line in ticks, classify it with your stated tolerance, and count closes on the wrong side.
| Bar | Bar low | Line level | Low vs line in ticks | Reading |
|---|---|---|---|---|
| 35 | 5051.75 | 5045.50 | +25 | No test |
| 36 | 5050.50 | 5047.00 | +14 | No test |
| 37 | 5050.75 | 5048.50 | +9 | No test |
| 38 | 5050.00 | 5050.00 | 0 | Touch, third touch |
| 39 | 5046.50 | 5051.50 | -20 | Poke, closed on the line |
| 40 | 5053.50 | 5053.00 | +2 | Touch within tolerance |
| 41 | 5054.75 | 5054.50 | +1 | Touch within tolerance |
| 42 | 5051.75 | 5056.00 | -17 | Break, closed 12 ticks under |
Run that same measure across the 18 bars from bar 22 (the second anchor) to bar 39 and the result is a count rather than an impression: two touches within 2 ticks (bars 22 and 38), one poke (bar 39), and zero closes under the line. The first close under the line arrives at bar 42, and bars 42 through 46 all close under it, five closes in a row. Before bar 42, the line had never been closed through, which is the evidence that it was still acting as support. After bar 42, that evidence was gone.
Risks and Limitations of Trendlines and Channels
Trendlines and channels are useful because they force a plan, but they come with real weaknesses. Knowing them is what keeps a line from turning into a reason to stay in a bad trade.
- Subjectivity. Give ten traders the same chart and you will get several defensible lines. Anyone treating a 3-tick difference as meaningful has forgotten that a different anchor or convention would have moved the line further than that. The wick and close trendlines on the same illustrative MES bars sit 11 ticks apart.
- False breaks. Price pokes through lines regularly before resuming the trend. Entering every break of every line means paying for many of those pokes.
- Stops at obvious levels. The more visible a line is, the more stops sit just past it. A fast move through a crowded level can fill stops with slippage, so the loss can be larger than the distance you planned.
- Curve fitting. Choosing anchors because the resulting line supports a trade you already want gives the line no independent value. Mark swings first, then draw.
- Redrawing after the fact. Moving a line after it breaks so the position still looks valid is the same as widening a stop.
- Narrow channels. A channel only one or two ATRs wide leaves no room between noise and the stop. Measure width against volatility before trading it.
- Ranges mistaken for trends. Flat boundaries describe a range, which breaks in both directions repeatedly.
- Hindsight. Lines look perfect on finished charts because the swings that did not fit have already been ignored. A line has to be drawn with only the bars available at the time to say anything about a live decision.
- No guaranteed edge. Trendlines and channels organise decisions; they do not by themselves make a strategy profitable. Any rule built on them needs to be tested on your own market and timeframe before it gets real risk.
Trendline Channels Compared With Indicator Channels
Hand-drawn trendline channels are one of several ways to put a band around price. Indicator channels calculate their boundaries from a formula, which removes the drawing judgement but adds lag. The definitions in this table follow the standard calculations as documented in TradingView's indicator help pages.
| Method | How the boundaries are set | Strength | Weakness |
|---|---|---|---|
| Trendline channel | Drawn through confirmed swing points, parallel lines | Built from actual structure, fixed levels you can plan around | Subjective, depends on anchors and wick or close choice |
| Donchian channel | Highest high and lowest low of the last N bars, often 20 | Objective breakout levels | Flat steps, reacts only when a new extreme prints |
| Keltner channel | Moving average, often a 20-period EMA, plus and minus a multiple of ATR, often 2 | Width adapts to volatility | Lags a turning market, curves rather than straight lines |
| Bollinger Bands | 20-period simple moving average plus and minus 2 standard deviations | Shows volatility expansion and contraction | Bands move every bar, so they are not fixed levels to plan stops around |
| Horizontal support and resistance | Flat levels at prior swing highs and lows | Simple and widely watched | Says nothing about trend slope |
The practical difference is planning. A trendline channel gives fixed straight levels you can project into future bars, which makes stops, targets and time estimates easy to set before entry. Indicator channels update every bar, so a target you set at entry may have moved by the time price gets there. Many traders combine them: a drawn channel for structure, with an ATR-based measure to judge whether the channel is wide enough to trade.
Related lesson: Keltner channels
Practising Channel Drawing With Chart Replay
Drawing lines on finished charts feels productive and teaches very little, because you already know which swings mattered. The faster way to get better at trendlines is to draw them on bars you have not seen yet. Load a past session, hide everything after a chosen bar, mark swings with your fixed rule, draw the line and channel, write down your tolerance and your entry, stop and target, then step forward one bar at a time. Record each third touch, each poke through the line and each close beyond it, as a count of bars measured against your stated tolerance. After a few dozen channels you will have your own count of how often your lines held, which is worth more than any rule of thumb.
On our accounts, the WealthCharts platform includes trend line and channel drawing tools along with Chart Replay, which rewinds a chart to a past date and replays price action at adjustable speeds, so this kind of practice can happen on the same charts you trade. Every position on our accounts has to be closed by 4:45 PM ET, so a channel trade there is a same-session trade, and a channel drawn on a daily chart serves as context for intraday entries rather than a level to hold a position toward overnight.
Common Questions About Trendline Channels
What are the different types of trendlines?
An uptrend line connects rising swing lows and acts as support. A downtrend line connects falling swing highs and acts as resistance. A horizontal line connects swing points at about the same price and describes a range rather than a trend.
Is an ascending channel bullish or bearish?
An ascending channel describes an uptrend, so its lower boundary is the with-trend place to look for longs. It is not bullish from every point inside it, because buying near the upper boundary means buying where price has repeatedly stalled. A close below the lower boundary ends the ascending description.
How many touches does a trendline need?
Two touches are enough to draw a line, but any two points make a line. The third touch is the first evidence that the line predicts anything. Further touches suggest more traders are watching it, which can strengthen reactions and also crowd stops beyond it.
Should you draw trendlines on wicks or closing prices?
Either works if you use it consistently. On the same chart, a close-based line can sit several ticks away from a wick-based line and signal a break bars earlier or later. Choose one convention, write it into your plan, and apply it to every chart.
Do trendlines work on every timeframe?
Trendlines form on every timeframe, but they carry different weight. A line on a daily chart is watched by more participants than one on a 5-minute chart, and short timeframes tend to produce more false breaks. Check the higher timeframe before acting on a lower-timeframe line.
What is a channel breakout?
A channel breakout is a close beyond one of the channel's boundaries by more than your tolerance. Many traders then watch for a retest of the broken line before acting. The channel width projected from the break gives a measured-move target, which is a hypothesis rather than a guarantee.
This article is educational and is not investment advice or a recommendation of any instrument or strategy. The worked example is an illustrative constructed series, not market history, not a backtest and not account performance. Futures are leveraged, and losses can exceed what you planned, especially when stops fill with slippage in fast markets. Evaluation and funded prop accounts are simulated, and results in them do not reflect live market fills.


