



TL;DR: Breakout trading means acting on a close beyond a level that held price, and the real decision is how you survive the failures. Over five years of E-mini S&P 500 and Nasdaq-100 daily data, 60.00% of fresh 20-session breakouts closed back inside within five sessions. A strong close and a break with the trend lowered that rate the most, while volume helped less. Set the stop in ATR terms first, then size, because a half-ATR stop was touched in 86.67% of windows.
Breakout trading sells a simple idea. Price has been held by a level, it finally closes through, and you go with it. Spotting the break is the easy part. The hard part is the week after, when about six in ten of those breaks slide back inside the level. That is what this guide's own study of five years of E-mini S&P 500 and Nasdaq-100 daily bars from Yahoo Finance showed when one breakout trading rule was applied mechanically.
That number is not a reason to avoid breakouts. It is a reason to stop sizing them as if they rarely fail, and to stop reading every failed one as a personal mistake. This guide defines the setup, shows where breakout levels come from, then measures how often breakouts fail, which confirmation filters changed the odds, what a retest entry did, how wide the stop needs to be and how to size around it.
What Breakout Trading Is and What Counts as a Breakout
Breakout trading is a strategy that enters when price moves beyond a level that had been containing it. That level can be resistance above the market, support below it, the edge of a trading range, or the highest high or lowest low of a set number of sessions. A long breakout trader buys strength through resistance. A short breakout trader sells weakness through support.
The logic behind it is about the other side of the trade. Traders who sold at resistance expecting it to hold are now losing, and their buy stops sit just above the level. When those stops fill, they add buying in the direction of the break. Breakout traders are betting that this forced flow, plus new buyers reacting to the move, carries price further than the noise around the level.
The close decides whether a breakout happened
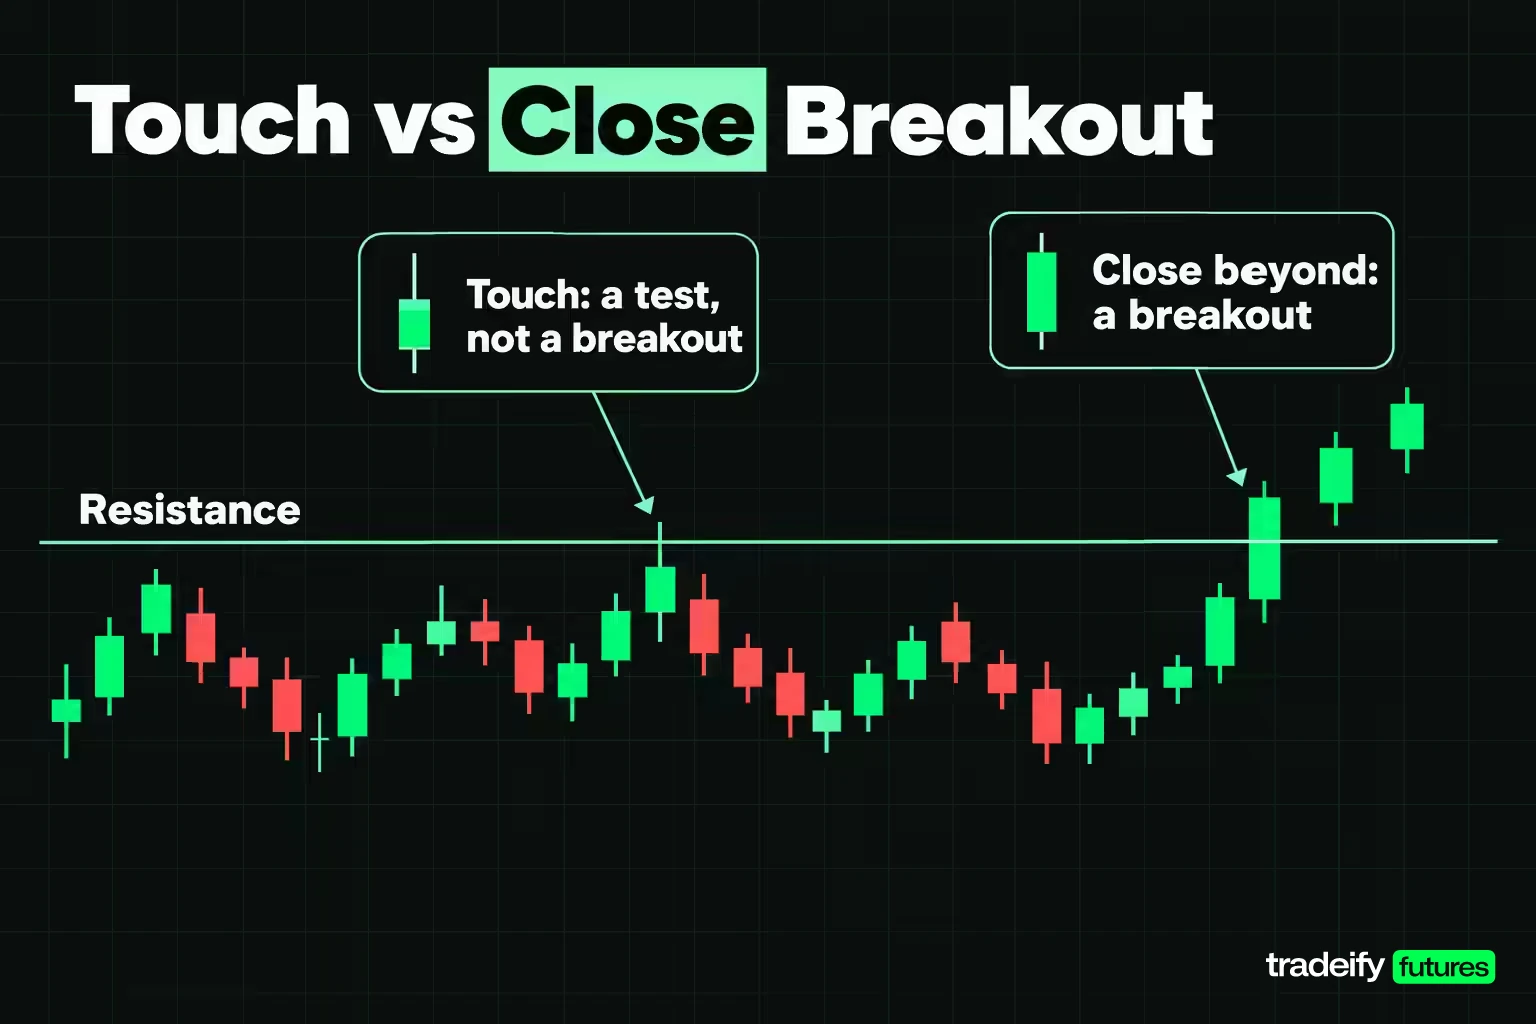
For anything you size in breakout trading, define a breakout on the close, not the touch. A wick through resistance that finishes back inside the range is a test of the level, not a breakout. On daily bars that means a session close beyond the level. On a 5-minute chart it means a 5-minute close.
A break should also be fresh. It counts once, on the first close beyond the level after a close at or inside it. Without that rule, a market that stays above its old high for three weeks produces fifteen "breakouts", and any statistic built on them just repeats one event.
Failure and heat in breakout trading
Two terms carry the measurements in this guide. A failed breakout is one that closes back at or inside the broken level within five sessions. Heat is the deepest move against your entry during the holding window, measured in multiples of the average true range (ATR), so markets with very different point values can be compared.
Failure describes the market. A stop-out describes your order. They are different events, and a breakout trader needs a rule for each.
Related lesson: Average true range
Finding the Support, Resistance and Ranges a Breakout Needs
In breakout trading, a breakout is only as meaningful as the level it breaks. If you cannot say in one sentence where the level is and why other traders are watching it, there is no breakout to trade, only a price that went up.
The common sources of breakout levels:
- Horizontal support and resistance. Prices where the market turned more than once. Prior day, week and month highs and lows are the most visible versions, because almost every chart shows them.
- Swing highs and lows. The last significant peak or trough. A break of the last swing high in a downtrend is often the first sign the trend is changing.
- N-session extremes. The highest high or lowest low of the last 20 or 55 sessions. These need no judgement, which is why the measurements in this guide use them.
- Trading ranges. A box with a clear ceiling and floor. The longer price stays inside, the more traders anchor to its edges.
- Trendlines and channels. Diagonal levels drawn across highs or lows. They are useful, but two traders rarely draw them identically, so a trendline breakout is harder to define and to test.
How to judge a breakout level before the break
A level is worth trading through when it is visible on the timeframe you trade, it has turned price more than once, and it is a line rather than a zone price has already sliced through repeatedly. Check the room on the other side too. A breakout that runs straight into the next resistance a few points away has little space to pay for its stop.
Related lesson: Support and resistance
Breakout Chart Patterns and the Level Each One Defines
Breakout chart patterns are trading ranges with a recognisable shape, and they supply many of the levels breakout trading relies on. For a breakout trader the shape matters less than what it hands you: a level to trade through and a place where the idea is wrong.
| Breakout pattern | Shape | Breakout level | Usual reading |
|---|---|---|---|
| Ascending triangle | Flat top, rising lows | The flat top | Often continuation in an uptrend |
| Descending triangle | Flat bottom, falling highs | The flat bottom | Often continuation in a downtrend |
| Symmetrical triangle | Highs falling, lows rising | Either converging line | Direction unresolved until the break |
| Rectangle | Flat top and flat bottom | Either edge of the box | Either direction |
| Flag | Short sloped channel after a sharp move | The channel edge in the trend direction | Continuation |
| Pennant | Small triangle after a sharp move | The pennant edge in the trend direction | Continuation |
| Rising wedge | Two rising lines converging | The lower line | Often a bearish reversal |
| Falling wedge | Two falling lines converging | The upper line | Often a bullish reversal |
| Channel | Two parallel sloped lines | Either line | Continuation or reversal |
Many traders project a target by adding the pattern's height to the breakout level, often called a measured move. Treat it as a reference point, not a forecast. Pattern recognition is also subjective. Two traders can look at the same chart and see a flag and a channel, which is one reason a mechanical level such as a 20-session high is easier to test.
Related lesson: Triangles
How the Breakout Failure Rate Was Measured
The breakout trading failure rates in this guide come from one rule applied identically to two markets, so the numbers can be compared with each other rather than stitched together from different studies. The computation was done in Python on November 4, 2026.
| Breakout study item | Setting |
|---|---|
| Markets | E-mini S&P 500 (ES) and E-mini Nasdaq-100 (NQ) front-month continuous futures |
| Data | Yahoo Finance daily bars, 1,257 completed sessions per market, November 5, 2021 to November 4, 2026 |
| Contract rolls | Quarterly roll gap removed by shifting earlier bars by the roll-session open gap |
| Breakout levels | Highest high or lowest low of the prior 20 sessions, and of the prior 55 sessions |
| Signal | First close beyond the level after a close at or inside it, long and short |
| Entry | Close of the breakout session |
| Failure | Any close back at or inside the level within the next 5 sessions |
| Volatility unit | 14-session ATR with Wilder smoothing, read on the breakout session |
| Holding window | 20 sessions after entry for reward, heat, stop and target counts |
| Volume test | Breakout-session volume against the median of the prior 20 sessions, expiry-week signals excluded |
| Trend test | Direction of the 100-session change in the close |
Signals without 20 sessions of data after them were left out, so the last breakout counted is from October 6, 2026. When a session touched both a stop and a target, the stop was counted first, which is the conservative reading.
Limits of the breakout measurement
This breakout failure-rate measurement is not a backtest. There are no commissions, no slippage and no trade management, so nothing here is a return figure. The two markets are closely related, the windows overlap, and the period was a rising one: on unadjusted closes ES rose 64.61% and NQ rose 74.70% over the sample. Removing the roll gap also removes whatever real move happened over that one weekend, four times a year, and the front-month volume Yahoo reports falls in expiry week, which is why those signals were dropped from the volume test.
How Often Breakouts Fail on E-mini S&P 500 and Nasdaq-100
In this guide's study of Yahoo Finance ES and NQ daily bars, breakouts failed about six times in ten. A false breakout, or fakeout, is not a rare event that better pattern reading removes. In this sample it was the normal outcome.
| Market | Lookback | Breakouts | Failed within 5 sessions | Failure rate | Median best move | Median heat |
|---|---|---|---|---|---|---|
| ES | 20 sessions | 188 | 113 | 60.11% | 2.05 ATR | 1.92 ATR |
| NQ | 20 sessions | 187 | 112 | 59.89% | 2.19 ATR | 1.93 ATR |
| Both | 20 sessions | 375 | 225 | 60.00% | 2.07 ATR | 1.92 ATR |
| ES | 55 sessions | 106 | 63 | 59.43% | 2.24 ATR | 1.91 ATR |
| NQ | 55 sessions | 120 | 74 | 61.67% | 2.28 ATR | 1.98 ATR |
| Both | 55 sessions | 226 | 137 | 60.62% | 2.27 ATR | 1.94 ATR |
The longer lookback did not help. A 55-session high sounds more important than a 20-session high, and it produced fewer signals, but they failed at almost the same rate. The reward and heat columns explain why breakouts feel uncomfortable even when they work. The median breakout moved about 2 ATR in its favour at its best point and about 1.9 ATR against the entry at its worst, so the move has to cover its own noise.
Breakout failure rate by year
A single average can hide one bad stretch. Splitting the 20-session breakouts from both markets by year shows the failure rate stayed in a band rather than coming from one period.
| Year | Breakouts | Failures | Failure rate |
|---|---|---|---|
| December 2021 and 2022 | 81 | 47 | 58.02% |
| 2023 | 77 | 47 | 61.04% |
| 2024 | 74 | 43 | 58.11% |
| 2025 | 77 | 51 | 66.23% |
| 2026 to October 6 | 66 | 37 | 56.06% |
Why breakouts fail
Breakouts fail for a handful of recognisable reasons, and most of them show up before the entry:
- The level was a liquidity pool. Stops and breakout buy orders cluster just beyond obvious levels. When they fill, the move can run out of new buyers in the same session.
- Nothing new happened. A drift through a level on a quiet day has no new information behind it, so the old range often reasserts itself.
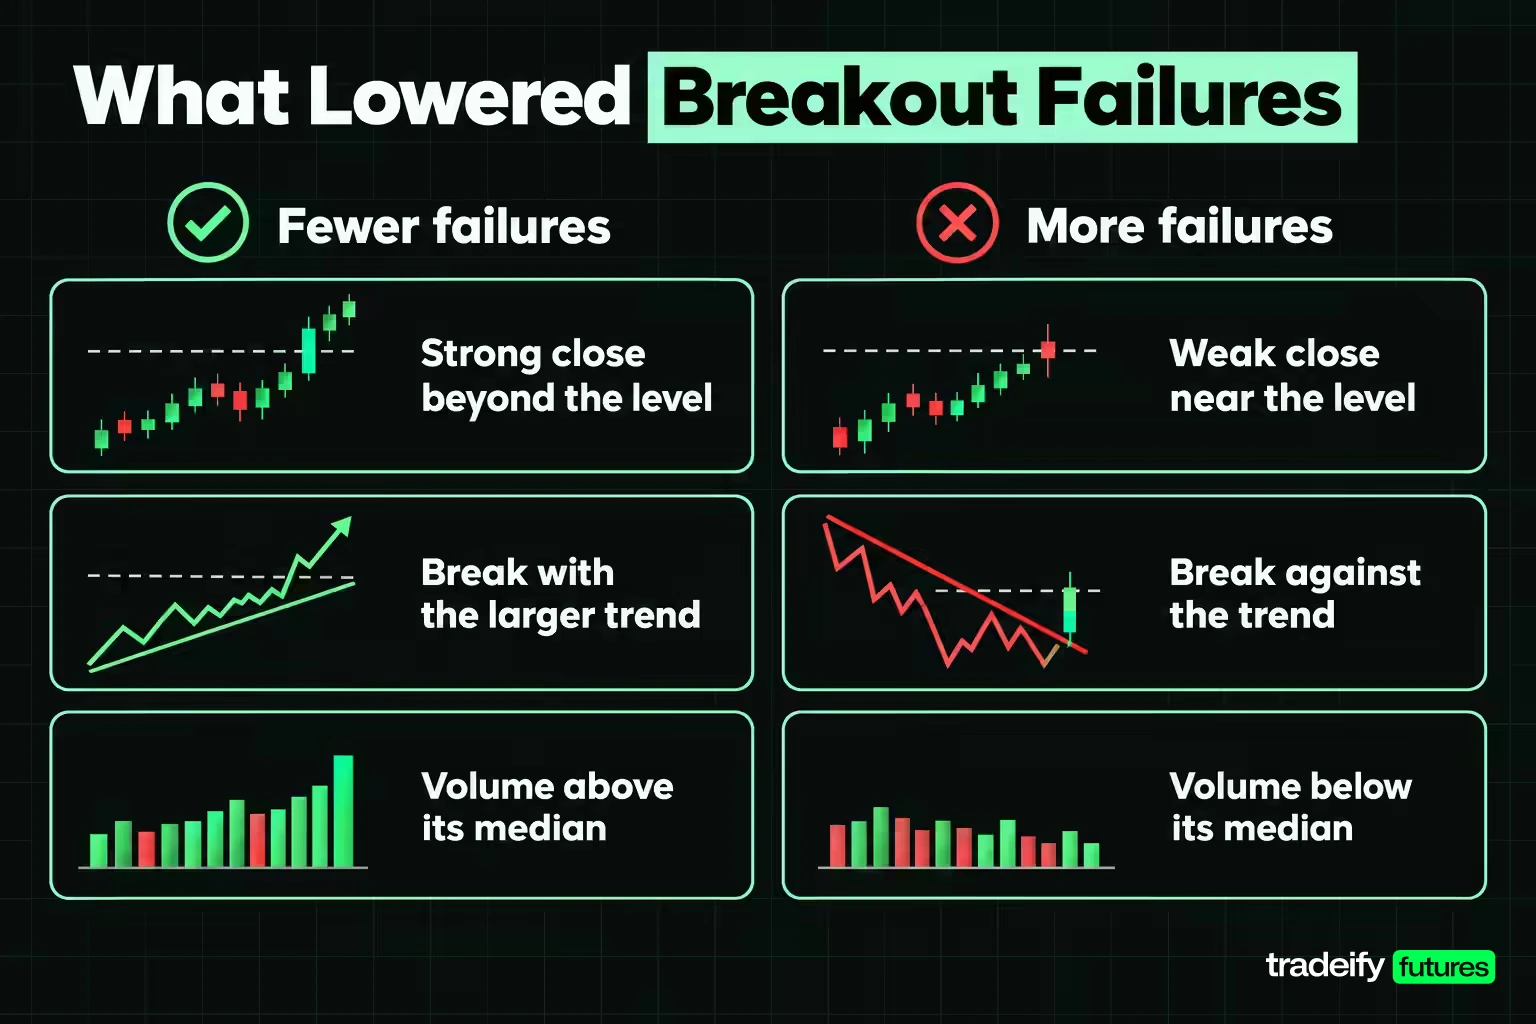
- The break went against the larger trend. Reversal attempts failed far more often than continuation breaks in this guide's ES and NQ study.
- The close barely cleared the level. A close a few ticks beyond a level is one bad print away from being back inside.
A failed breakout is not the same as a losing trade
Failure here means a close back inside the level within five sessions. It does not mean the trade lost. In this guide's ES and NQ data, of the 225 failed 20-session breakouts, 145, or 64.44%, still reached 1 ATR beyond the entry at some point in the next 20 sessions. Among the 150 that held, 143 did, or 95.33%.
That matters for your exit rule. A trader who exits on the first close back inside cuts some trades that would have worked later. A trader who holds to a fixed stop rides those failures and pays the heat. Neither is wrong, but you need to choose before the entry, not while price sits on the level.
Related lesson: Liquidity sweeps and stop runs
Breakout Confirmation With Volume, Close Strength and Trend
The most repeated breakout trading advice about confirmation is that the move needs volume. The next is that price should close decisively beyond the level, and the third is to trade with the trend. All three were tested on the same 20-session breakouts in ES and NQ.
| Confirmation filter | Group | ES failure rate | NQ failure rate | Both markets | Breakouts in group |
|---|---|---|---|---|---|
| Breakout-session volume | At or above 20-session median | 57.14% | 55.06% | 56.11% | 180 |
| Breakout-session volume | Below 20-session median | 65.00% | 67.07% | 66.05% | 162 |
| Close beyond the level | More than 0.25 ATR | 50.00% | 48.08% | 49.03% | 206 |
| Close beyond the level | 0.25 ATR or less | 72.09% | 74.70% | 73.37% | 169 |
| Larger trend | Break in the 100-session direction | 55.38% | 56.30% | 55.85% | 265 |
| Larger trend | Break against it | 74.00% | 74.42% | 74.19% | 93 |
In this guide's calculation, close strength was the strongest single filter. A breakout session that closed more than a quarter ATR beyond the level failed 49.03% of the time, against 73.37% for closes that barely cleared it. The gap was almost identical on both markets, which is what you want to see before trusting a filter.
Volume helped in this guide's ES and NQ test, but less than its reputation suggests. Above-median volume lowered the failure rate by about ten points, and the gap held on both markets and at the 55-session lookback too (53.33% against 67.35% on ES, 58.82% against 67.27% on NQ). It is a useful tie-breaker, not a gate that turns a breakout reliable.
Stacking filters helped further in the same Yahoo Finance data but did not cross a line. A strong close in the direction of the 100-session trend failed 45.64% of the time across 149 breakouts. A weak close against the trend failed 85.42% of the time across 48. No combination tested got failures near zero, so confirmation shifts the odds rather than removing the risk. Momentum indicators such as RSI or MACD were not tested here, so any claim for them needs its own measurement.
Continuation versus reversal breakouts
A continuation breakout breaks in the direction of the existing trend. A reversal breakout tries to break against it. In this guide's ES and NQ daily study the difference was large: breaks with the 100-session direction failed 55.85% of the time and breaks against it 74.19%.
The long and short split in the same study tells the same story. Long breakouts failed 55.51% of the time and short breakouts 69.42%, in a period when both indexes rose. That does not mean short breakouts are broken. It means a reversal breakout needs more evidence, such as a lower high already in place or a break of the last swing low, before it deserves the same size.
What waiting one session for confirmation costs
Some traders wait one more session and enter only if it also closes beyond the level. Measured in this guide's study on the same 20-session ES and NQ breakouts, that rule dropped 105 of 378 signals (27.78%) and lowered the failure rate from 60.00% to 49.82%.
The trade did not get better, though. In the same calculation, the share of entries touching a 1 ATR stop rose from 72.80% to 75.46%, and a 1 ATR target was reached before that stop 47.25% of the time instead of 52.27%. The later entry is further from the level, so it filters out events without protecting the position.
Related lesson: Trade setups and confirmation
Break and Retest Entries Compared With the Breakout Close
The break and retest strategy waits for price to come back to the broken level, then enters there with a stop on the other side. The appeal is obvious. You buy at the level instead of chasing the close, and your stop is closer to the idea.
In this guide's study of 375 ES and NQ breakouts at the 20-session lookback (Yahoo Finance daily bars), price came back to the level within five sessions in 291 cases, or 77.60%. In the other 84, or 22.40%, it never returned, and none of those failed. A retest-only trader misses exactly the breakouts that worked most cleanly.
In the same data, of the 291 breakouts that retested the level, 225, or 77.32%, also closed back inside it and counted as failures. Only 66, or 22.68%, touched the level and held on a closing basis. A retest is often the first step of a failure rather than a second chance.
| Breakout entry | Entry price | 1 ATR target before 1 ATR stop | 2 ATR target before 1 ATR stop |
|---|---|---|---|
| Breakout close | Close of the breakout session | 52.27% | 32.27% |
| Retest limit | The broken level, on the first touch within 5 sessions | 49.48% | 33.33% |
The odds came out roughly the same. The retest gave a better price, not a better probability. If waiting for the pullback feels safer, that feeling is about the entry price, and the data says the trade itself barely changed. If you prefer retests, a stricter version waits for the retest session to close back beyond the level before entering, which trades some of the price advantage for evidence that the level held. That variant was not measured here.
Breakout Trading Entries, Targets and Exits
Breakout trading entries come in four common forms, and each trades one risk for another:
- Stop order beyond the level. Fills as soon as price trades through. It catches every move but also every wick, and a stop order becomes a market order when triggered, so the fill can slip in a fast market.
- Close beyond the level. Waits for the session close. It avoids wicks but enters further from the level.
- Next-session confirmation. Waits for a second close. It filters events but enters later still.
- Retest limit. Buys back at the level. It gets the best price but misses the breakouts that never come back.
Breakout targets against their break-even win rates
A target only makes sense next to the stop it pays for. The same 375 breakouts were run with a fixed 1 ATR stop and four targets over 20 sessions.
| Breakout target | Reached at any point | Reached before a 1 ATR stop | Win rate needed to break even |
|---|---|---|---|
| 1 ATR | 76.80% | 52.27% | 50% |
| 1.5 ATR | 62.93% | 39.20% | 40% |
| 2 ATR | 52.53% | 32.27% | 33.33% |
| 3 ATR | 31.47% | 19.73% | 25% |
The break-even column is plain arithmetic: a 2-to-1 target needs to win one time in three before costs. Every row sits within a few points of its own break-even line, on either side. A mechanical breakout with no filter and no management is close to a fair coin at its own odds, before commissions and slippage. Any edge has to come from the filters, the management and the costs, which is the honest place to put your effort.
The gap between the two middle columns is the cost of the stop. In this guide's data, a 3 ATR target was touched in 31.47% of windows, but only 19.73% of breakouts got there without hitting the 1 ATR stop first.
Breakout exit rules worth deciding in advance
- Failure exit. Close the trade on the first close back inside the level.
- Stop exit. A fixed stop in ATR terms that ignores closes back inside.
- Target exit. A fixed multiple of ATR, chosen from the table rather than from hope.
- Time exit. Close the trade after a set number of sessions if neither has hit, so a stalled breakout cannot tie up risk forever.
Related lesson: Entry and exit strategies
Breakout Stop Placement and Position Sizing
In breakout trading, the stop is the price where the breakout idea is wrong. The useful question is not what width feels safe. It is what share of comparable breakouts traded through that width before going anywhere.
| Breakout stop distance | ES windows touched | NQ windows touched | Both markets |
|---|---|---|---|
| 0.5 ATR | 86.17% | 87.17% | 86.67% |
| 1 ATR | 73.40% | 72.19% | 72.80% |
| 1.5 ATR | 61.70% | 59.89% | 60.80% |
| 2 ATR | 48.40% | 47.59% | 48.00% |
In this guide's ES and NQ study, a half-ATR stop was touched in 86.67% of 20-session windows. That is not really a stop. It is an exit that fires almost every time, and it is where many traders conclude breakouts "don't work" when the stop was the problem. Even 2 ATR was touched in nearly half. The popular "stop just under the breakout level" is often a half-ATR stop or tighter, because many breakouts close only a little beyond the level, and 77.60% of breakouts came back to the level within five sessions.
Sizing a breakout in micro futures
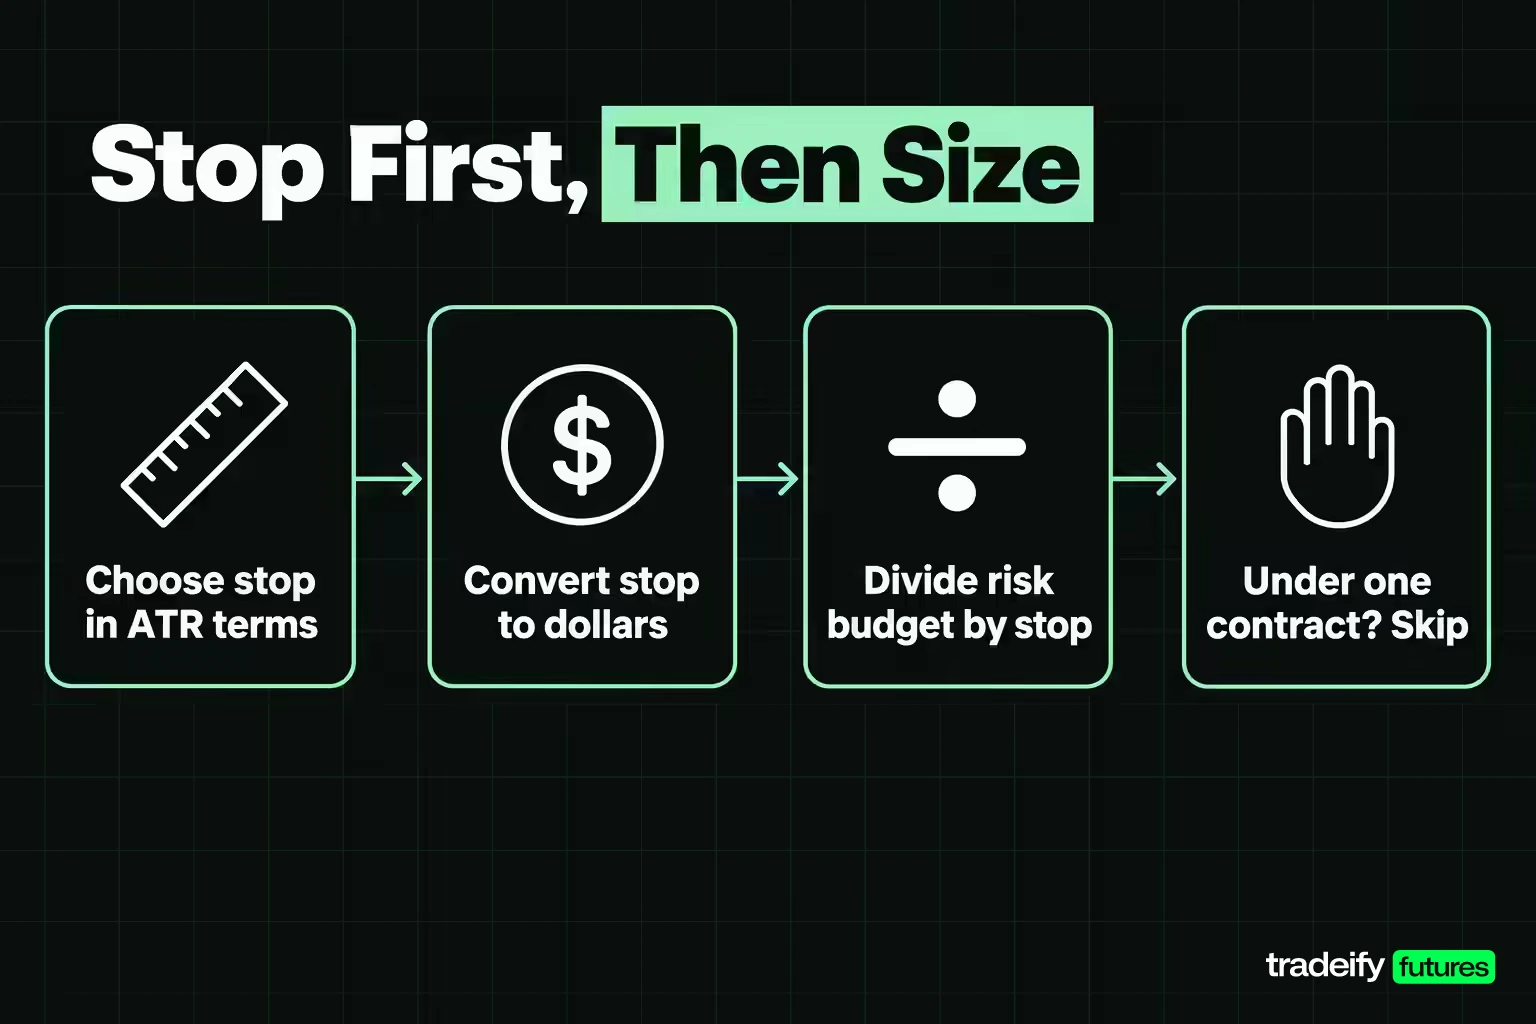
Run the sizing arithmetic in the order that respects the stop. Pick the stop multiple, convert it to points with the ATR, convert points to dollars with the contract multiplier, then divide your risk budget by it.
The Micro E-mini S&P 500 (MES) is $5 times the index, with a 0.25-point tick worth $1.25. The Micro E-mini Nasdaq-100 (MNQ) is $2 times the index, with a 0.25-point tick worth $0.50. The full-size ES is $50 per point and NQ is $20 per point.
| Contract | Dollars per index point | Daily ATR as of November 4, 2026 | 1 ATR stop per contract | 2 ATR stop per contract |
|---|---|---|---|---|
| Micro E-mini S&P 500 (MES) | $5 | 101.65 points | $508.25 | $1,016.50 |
| Micro E-mini Nasdaq-100 (MNQ) | $2 | 667.57 points | $1,335.14 | $2,670.28 |
| E-mini S&P 500 (ES) | $50 | 101.65 points | $5,082.50 | $10,165.00 |
| E-mini Nasdaq-100 (NQ) | $20 | 667.57 points | $13,351.40 | $26,702.80 |
With an illustrative $1,000 risk budget, one MES contract fits at a 1 ATR stop ($508.25) and none fits at 2 ATR. No MNQ contract fits even at 1 ATR. When the arithmetic returns zero, the honest answers are a different instrument, a shorter holding window with a smaller intraday ATR, or no trade. Halving the stop to make the size fit just moves you into the row that gets touched 86.67% of the time.
ATR also moves. On November 4, 2026 both readings sat well above their one-year medians of 89.44 points for ES and 495.90 points for NQ, so the same stop multiple costs more dollars now than it did for most of the past year.
The 3-5-7 rule applied to breakouts
The 3-5-7 rule is an informal risk heuristic, not an exchange or regulatory rule. The common version, as trading education sites such as MetroTrade and DayTrading.com describe it, risks no more than 3% of the account on one trade, keeps total open risk at or under 5%, and aims for winners at least 7% (versions differ on whether the 7 is a profit target or a win-to-loss ratio).
Run it against the breakout failure rate near 60% measured in this guide before adopting it. If each breakout fails independently with that probability, five failures in a row have a 7.78% chance on any given run of five, and at 3% per trade that streak costs about 15% of the account. Smaller per-trade risk makes the streak survivable. That is the reason to size breakouts conservatively, not a forecast that the streak will come.
Related lesson: Position sizing
Timeframes for Breakout Trading From Daily Charts to the Opening Range
Breakout trading timeframes come down to two settings: the bar size and the lookback. Daily bars with a 20-session lookback gave 188 ES breakouts in five years, held for up to 20 sessions, which means overnight and weekend gaps are part of the trade.
Intraday breakout traders use levels that form inside the day:
- Opening range. The high and low of the first part of the session, traded when price leaves it.
- Prior day high and low. The most watched intraday levels in index futures.
- Overnight range. For futures, the high and low printed before the stock market opens.
Shorter bars produce more signals and tighter stops in points, but the noise is larger relative to the move, and commissions become a bigger share of each stop. The failure rate measured on daily bars should not be assumed for 5-minute bars. The method transfers; the number has to be measured again.
Many traders mark the level on a higher timeframe and execute on a lower one. A daily resistance level traded with a 5-minute close gives an intraday stop against a level the whole market is watching.
Related lesson: Opening range breakout
News and Momentum Breakout Trading
News breakouts are the fastest form of breakout trading. They happen when scheduled data hits a market that has been coiling. US CPI, for example, is released at 8:30 AM ET, and index futures can move through a range in seconds when it lands. Those first moves can reverse just as fast, because the initial reaction and the considered one are not always the same.
Three mechanics matter more around news than at other times:
- Slippage. A stop order becomes a market order when triggered, and the fill can be well away from the stop price in a fast market. A stop-limit order controls the price but may not fill at all.
- Gaps. On daily bars, a session can open beyond the level, so the breakout close may be far from the level and the stop far from the entry.
- Two-sided breaks. A release can take out both sides of a range in one session, triggering both a long and a short breakout order.
Momentum breakouts are the non-news version: a range contracts, volatility drops, then a session expands through the edge. In this guide's ES and NQ study, breakouts that closed more than 0.25 ATR beyond the level failed 49.03% of the time against 73.37% for weak closes, and a genuine expansion session is exactly the kind that closes well beyond the level.
Breakout Trading Across Futures, Stocks, Forex and Crypto
Breakout trading works on any market with levels that traders watch, but the details that drive failure rates differ by market.
| Market | Volume data | Trading hours | Breakout detail to watch |
|---|---|---|---|
| Index futures | Exchange-reported volume per contract | Sunday 6:00 PM to Friday 5:00 PM ET with a daily break | Continuous charts show roll gaps; overnight ranges form levels |
| Stocks | Volume reported per share across venues | Core session 9:30 AM to 4:00 PM ET | Earnings gaps can open far beyond a level |
| Spot forex | No single exchange reports all volume | Around the clock on weekdays | Volume filters rely on proxies; currency futures report exchange volume |
| Crypto | Volume split across many venues | Every day, around the clock | No session close, so a daily close depends on the chart's time zone |
The volume and close-strength filters in this guide depend on clean volume and a meaningful close. Both are clear on futures and stocks, and weaker on spot forex and crypto, so test those markets on their own data before borrowing the numbers.
Finding breakout stocks
Stock breakout traders usually scan rather than watch one chart. Common screens look for stocks near a yearly or multi-month high, in a tight range for several weeks, with volume rising into the edge. A screen finds candidates, not trades: each one still needs a level, a close beyond it and a stop sized in its own ATR.
Advantages and Limitations of Breakout Trading
Breakout trading has real strengths:
- An objective trigger. A close beyond a defined level is easy to define, test and journal.
- Built-in invalidation. The level tells you where the idea is wrong.
- Exposure to large moves. The median breakout in this guide's ES and NQ study reached about 2 ATR at its best point, and every big trend starts with a breakout of something.
- Works across markets. Any market with watched levels produces breakouts.
And real limitations:
- Most breakouts fail. In this guide's five-year ES and NQ study, about 60.00% closed back inside within five sessions on both markets and both lookbacks.
- Wide stops. Stops that survive the noise are wide in ATR terms, so they buy few contracts per dollar of risk.
- Extended entries. You buy after the move has started, often near the high of the session.
- Ranging markets. In a range, breakouts in both directions fail one after another.
- Slippage. Stop entries fill worst exactly when the move is fastest.
Common Breakout Trading Mistakes
Most breakout trading mistakes come from treating the setup as more reliable than it is:
- Trading the touch, not the close. Wicks through a level are where many fakeouts live.
- Putting the stop just under the level. In this guide's study of ES and NQ daily bars, a half-ATR stop was touched 86.67% of the time.
- Chasing a missed entry. Missing the breakout close does not make the next price a good entry. It makes it a different trade, with a worse stop and the same failure rate.
- Ignoring the larger trend. In the same study, breakouts against the 100-session direction failed 74.19% of the time.
- Treating volume as a guarantee. In this guide's ES and NQ data it lowered failures by about ten points, not to zero.
- Sizing first and stopping second. Squeezing the stop to fit a size turns a breakout trade into a noise trade.
- Judging a breakout trading method on a handful of trades. With failures near 60% in this guide's study, a run of losses is normal. Judge the rule over a few dozen logged trades against its own failure definition.
Related lesson: How to keep a trading journal
Two Breakout Windows Read Session by Session
Two ES windows show what a working breakout and a failed one look like day by day. Both are 20-session long breakouts from 2025 and 2026 whose windows do not cross a contract roll, chosen by rule before their paths were read. The working one is the breakout that held whose 20-session result sat closest to the median of the held breakouts that finished positive (2.43 ATR). The failed one is the failure whose heat sat closest to the median heat of all failures (2.57 ATR). Prices are unadjusted front-month closes.
| Breakout window measure | April 17, 2026 breakout | August 13, 2026 breakout |
|---|---|---|
| Breakout level | 7,089.00 | 7,820.25 |
| Entry close | 7,161.50 | 7,822.50 |
| Close beyond the level | 72.50 points, 0.65 ATR | 2.25 points, 0.03 ATR |
| ATR at the signal | 111.31 points | 86.47 points |
| Volume against 20-session median | Above | Below |
| First close back inside | None | Session 1, at 7,805.00 |
| Half-ATR stop touched | Session 1 | Session 2 |
| 1 ATR stop touched | Never | Session 3 |
| 1 ATR target reached | Session 10 | Never |
| Deepest point against entry | 82.25 points, 0.74 ATR, session 4 | 237.00 points, 2.74 ATR, session 19 |
| Close after 20 sessions | 7,432.25, up 270.75 points | 7,659.50, down 163.00 points |
| Result on one MES contract | $1,353.75 gain | $815.00 loss |
Reading the working and failed breakout windows
The April 17, 2026 ES breakout passed the close-strength and volume filters, and it still dipped to 7,079.25 within four sessions, below the level it had broken. A half-ATR stop would have taken it out on day one. With a 1 ATR stop it survived, reached 1 ATR on session 10 and 2 ATR on session 13, and finished 2.43 ATR higher.
The August 13, 2026 ES breakout failed both filters. It closed 2.25 points over the level, on below-median volume, and closed back inside the very next session. It never got more than 9.25 points into profit, touched a 1 ATR stop on session 3 and kept going to 2.74 ATR against the entry. Side by side, the lesson is that the stop that let the winner breathe is also the stop that made the loser expensive, which is why the size has to come from the stop.
Breakout Trading When Positions Must Close Each Session
The daily breakouts measured in this guide's breakout trading study were held for up to 20 sessions, through nights and weekends. Many trading accounts, including many prop firm accounts, require positions to be closed every day, so the daily version cannot be traded as measured.
What transfers is the method. Define intraday levels (prior day high and low, overnight range, opening range), define failure as a close back inside on your bar size, set the stop in multiples of the intraday ATR and size from there. Then measure your own failure rate on those bars before trusting any number, including the ones in this guide.
On our accounts every position has to be closed by 4:45 PM ET (12:59 PM ET on holiday early closes), with no overnight or weekend holds, so multi-session breakouts like the ones measured here cannot be held, while intraday breakouts can. News trading is allowed on all our accounts at the trader's own risk, and size is capped by contract limits rather than margin, for example 4 minis or 40 micros on a 50K Growth account. Our evaluation and funded accounts are simulated.
A Breakout Trading Checklist
Run these breakout trading steps in order, because each decides whether the next is affordable.
Qualifying the breakout before entry
- Name the level and the lookback, and say why traders watch it.
- Wait for a close beyond the level, not a touch, and check the previous close was inside.
- Check close strength. More than a quarter ATR beyond the level was the strongest filter measured.
- Check the larger trend. Breaks against it failed about three times in four in this guide's ES and NQ study.
- Check volume against its own 20-session median as a tie-breaker.
Sizing and exiting the breakout trade
- Choose the stop in ATR multiples from how often comparable breakouts traded through that width, not from comfort.
- Convert the stop to dollars with the contract multiplier, then divide your risk budget by it.
- If that leaves less than one contract, change the instrument or skip the trade rather than tightening the stop.
- Pick a target whose measured hit rate before the stop clears its break-even win rate, and write both down.
- Decide the exit rule (failure exit, stop, target, time) before entering, and log the outcome.
Breakout Trading FAQ
What is a breakout in trading?
A breakout is a close beyond a level that had been holding price, such as resistance, support, the edge of a range or the high of the last 20 sessions. The close defines it, so a wick through the level that finishes back inside is a test, not a breakout.
How often do breakouts fail?
In this guide's study of five years of Yahoo Finance ES and NQ daily bars, 60.00% of fresh 20-session breakouts closed back inside the level within five sessions. The 55-session version failed 60.62% of the time. Failure here means a close back inside, not necessarily a losing trade.
What is the 3 5 7 rule in trading?
It is an informal risk heuristic described by trading education sites such as MetroTrade and DayTrading.com: risk no more than 3% of the account per trade, keep total open risk at or under 5%, and aim for winners of at least 7%. Versions differ on the 7, and no exchange or regulator sets it. With breakouts failing near 60% of the time, a smaller per-trade risk keeps a losing streak survivable.
How do you find breakout stocks?
Most traders use a scanner for stocks near a yearly or multi-month high, in a tight range, with volume building. The scan gives candidates. Each still needs a defined level, a close beyond it and a stop sized in its own ATR.
What is a breakout prop firm?
The phrase usually means a prop firm whose rules suit breakout trading, though some searches are for a firm that uses the word in its name. For breakout trading, the rules that matter most are daily loss limits, drawdown limits and whether positions must close each day. Multi-day daily-chart breakouts need an account that allows overnight holds, so on intraday-only accounts the intraday breakout is the version to trade.
Does volume confirm a breakout?
Volume helped but did not confirm a breakout on its own. In this guide's ES and NQ study, breakouts on volume at or above the 20-session median failed 56.11% of the time, against 66.05% on lighter volume. A close more than 0.25 ATR beyond the level was a stronger filter, at 49.03% against 73.37%.
Is breakout trading profitable?
Breakout trading can be profitable, but the setup alone does not make it so. In this guide's ES and NQ study, a mechanical breakout with a 1 ATR stop and 1 ATR target won 52.27% of the time against a 50% break-even, before costs. Any profit has to come from filters, management and low costs, so test your own version forward.
This article is educational content, not investment advice, and it does not recommend any trade, instrument or account. Futures are leveraged, and losses can exceed what a stop is expected to limit when markets gap or move fast. The breakout figures come from historical daily bars on two related futures series under one mechanical rule, and past results do not predict future ones. Simulated evaluation and funded accounts differ from live trading in fills, costs and rules.


