



TL;DR: Diversification is spreading risk across holdings that do not move together, so count correlations, not positions. In a test from 2006 to 2026, eight futures markets behaved like 4.68 independent ones. Two equity index contracts held together behaved like 1.08 markets. The stock and bond offset that cushioned 2008 and 2020 broke down in 2022. In futures, whole-contract size often caps how many markets an account can hold at all.
Most traders and investors answer "am I diversified?" by counting. Six stocks, four funds, five futures markets. The count feels like protection, right up until the day every line on the screen is red at once.
That day is the real test, and a count can't tell you how you'll do on it. Diversification only works to the extent your holdings fail to fall together, and that is a correlation question, not a headcount. This guide covers what diversification means for investors, businesses and traders, the main strategies and asset classes, and where it breaks. It then measures it on nearly 21 years of futures data, so you can see how much a second, fifth or eighth market actually buys.
What Diversification Means
Diversification is the practice of spreading money across different investments so that one bad outcome does not sink the whole portfolio. The SEC's investor education site Investor.gov defines it as "the practice of spreading money among different investments to reduce risk," and illustrates it with a street vendor who sells both umbrellas and sunglasses. Rain sells one, sun sells the other, and the vendor has something to sell either way.
Merriam-Webster gives three useful senses of the word. In general use, diversification is "an increase in the variety or diversity of something." In investing, it is "the act or practice of spreading investments among a variety of securities or classes of securities." In business, it is "the act or policy of increasing the variety of a company's products." A diversified portfolio, in the dictionary's investing sense, is one "balanced defensively by having funds divided among varied securities."
Specific risk versus market-wide risk in diversification
Diversification removes one kind of risk well and another kind barely at all.
- Specific risk belongs to one holding: a company misses earnings, a mine floods, a single crop fails. Holding many unrelated positions dilutes it.
- Market-wide risk hits everything at once: a recession, a rate shock, a liquidity panic. Adding more positions that all respond to the same shock does little.
The modern version of the idea comes from Harry Markowitz's essay "Portfolio Selection" (1952), later expanded in his book Portfolio Selection: Efficient Diversification (1959). He shared the 1990 Nobel Memorial Prize in Economic Sciences for that work. His key point still holds: what matters is how holdings move relative to one another, not just how risky each one is alone.
Why Diversification Is a Correlation Budget
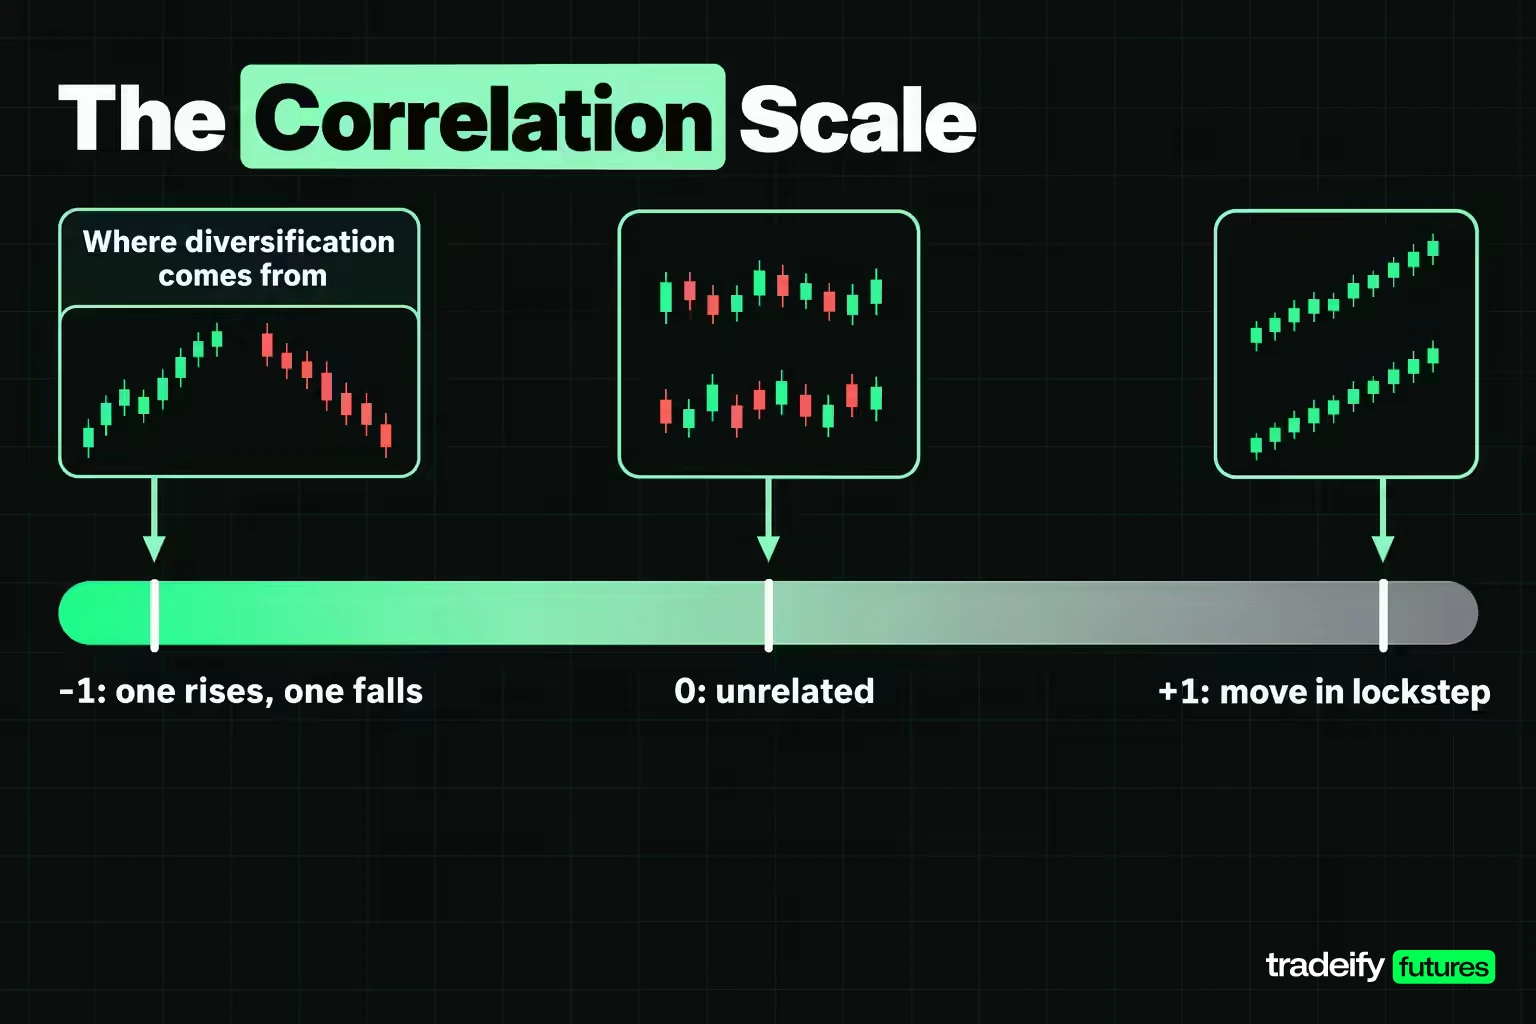
Correlation measures how closely two return streams move together, on a scale from -1 to +1. At +1 they move in lockstep, at 0 they are unrelated, and at -1 one rises when the other falls. Diversification is worth exactly as much as the low and negative correlations in your book.
That is why a correlation budget beats a market count. Every position you add spends some of your risk. If it moves with something you already hold, you paid for a second copy of the same bet.
The temptation is to add a market because its chart looks clean. The better first question is what that market did on the days your main position lost money.
How the Diversification Futures Study Was Measured
To put numbers on it, this guide uses an illustrative study of eight liquid futures markets: the E-mini S&P 500 (ES), E-mini Nasdaq-100 (NQ), 10-Year T-Note (ZN), Euro FX (6E), WTI Crude Oil (CL), Gold (GC), Silver (SI) and Copper (HG).
- Data: Yahoo Finance continuous front-month daily closes, January 3, 2006 to November 4, 2026. Roll gaps are not adjusted, which adds some noise, most of it in crude oil.
- Sample: 5,224 daily returns on sessions where all eight markets have a positive close (crude's negative settlement in April 2020 drops out).
- Measure: Pearson correlation of simple daily returns, a linear measure that can understate relationships that only show up in large moves.
- Effective number of markets: the square of the sum of the correlation matrix's eigenvalues divided by the sum of their squares. It answers one plain question: how many perfectly independent markets would give the same spread of risk?
Across the full sample of this guide's own measurement, the average correlation between pairs was 0.19, and the eight markets behaved like 4.68 independent ones. The largest eigenvalue was 2.73 out of a total of 8, which means one common factor drove a big share of the movement.
Diversification and Correlation Clusters in Futures
The average hides a split. The two obvious cluster pairs, ES with NQ and Gold with Silver, averaged 0.86. The other 26 pairs averaged 0.14.
| Market pair | Daily return correlation 2006 to 2026 | What it means for diversification |
|---|---|---|
| ES and NQ | 0.92 | Close to one position held twice |
| Gold and Silver | 0.79 | Mostly one precious-metals bet |
| Silver and Copper | 0.45 | Partly shared metals exposure |
| Euro FX and Gold | 0.34 | Both respond to the dollar |
| ES and Copper | 0.29 | Copper trades partly as a growth bet |
| ES and Crude Oil | 0.23 | Loose link through the economy |
| ES and Gold | 0.03 | Close to unrelated |
| ES and 10-Year T-Note | -0.25 | The classic stock and bond offset |
Read the top and bottom of that table together. ES plus NQ looks like two markets and acts like one. ES plus the 10-Year T-Note looks like an odd pairing and was one of the best diversifiers in the set, at least on average.
Related lesson: Correlation risk
Benefits of Diversification
Diversification has real, measurable benefits. They are just narrower than the marketing version.
- Lower volatility. A portfolio's swings shrink when its parts don't swing together. In an illustrative study measured for this guide on Yahoo Finance daily futures data from 2006 to 2026, a four-market basket of ES, ZN, 6E and Gold, each sized by the inverse of its volatility, had daily volatility 43% lower than the weighted average of its legs.
- Smaller single-holding damage. One company, crop or commodity going wrong costs a slice of the portfolio, not all of it.
- A smoother path toward a goal. Investor.gov notes that holding more than one asset category reduces the risk of losing money and gives the portfolio's returns "a smoother ride." Smoother paths are easier to stick with, and staying invested is a benefit in its own right.
- Shallower drawdowns, sometimes. The same basket was tested against ES alone with both scaled so a typical (one standard deviation) day was worth $100.
| Matched-volatility test 2006 to 2026 | ES alone | Four-market basket |
|---|---|---|
| Worst single day | -$848.25 | -$623.09 |
| Maximum drawdown | -$6,037.80 | -$4,995.22 |
| Days worse than -$300 | 50 | 33 |
| Sep 1 to Dec 31, 2008 | -$2,268 | -$80 |
| Feb 20 to Apr 30, 2020 | -$903 | +$642 |
At equal day-to-day risk, the basket's worst day was about 27% smaller and its deepest drawdown about 17% shallower. In the 2008 crisis and the 2020 Covid crash, it nearly sidestepped losses that hit ES hard, mostly because the T-Note rallied while stocks fell.
That last benefit is the conditional one. It depends on the correlations holding up in the exact period you need them. The same basket's own deepest drawdown came in 2021 and 2022, when bonds fell with stocks.
Related lesson: Maximum drawdown
Diversification Use Cases for Investors, Traders and Households
Diversification shows up anywhere one source of loss could do outsized damage. The mechanics change, but the question stays the same: what else do I hold that won't fail for the same reason?
- Long-term investing. Retirement and college savers mix stocks, bonds and cash, then spread within each. Investor.gov describes lifecycle (target-date) funds as one-stop versions that handle the allocation, diversification and rebalancing inside a single fund.
- Active trading. A trader running several positions at once is building a portfolio, whether they call it that or not. Two long positions in ES and NQ are one equity-index bet with two tickets.
- Strategy and timeframe mixing. A trend-following method and a mean-reversion method can lose in different market conditions, so running both can steady a trader's results more than adding a third trend method.
- Household income. A household whose salary, bonus and retirement account all depend on one employer is concentrated, even if the retirement account holds a broad fund.
- Business revenue. A company that sells to one customer or one market carries the same concentration problem as a one-stock portfolio, which is why corporate diversification is a strategy field of its own.
Business and Corporate Diversification
Business diversification means a company growing into products or markets beyond its current line. The classic framework comes from H. Igor Ansoff's 1957 Harvard Business Review article "Strategies for Diversification." He wrote that a business has "four basic growth alternatives": market penetration, market development, product development and diversification.
Ansoff set diversification apart from the other three because it "generally requires new skills, new techniques, and new facilities." He listed the usual reasons companies diversify, from technological obsolescence and excess capacity to reinvesting earnings and the one investors will recognize, "to distribute risk." He described three directions:
- Vertical diversification: branching into production of the components, parts and materials the current product uses. His example was the Ford empire under Henry Ford, Sr.
- Horizontal diversification: new products that don't contribute to the present product line but serve missions within the company's know-how in technology, finance and marketing.
- Lateral diversification: moving beyond the company's industry altogether, which Ansoff called "wide open."
He also grouped the reasons into growth objectives, stability objectives (protection against unfavorable trends) and flexibility objectives (strength against contingencies nobody can foresee). The stability objective is the same logic as portfolio diversification: own something that doesn't fail when the core business does.
The trade-off is also the same. A conglomerate spread across unrelated industries can dilute management focus and returns, just as an over-diversified portfolio dilutes its best ideas. Corporate diversification is a choice to give up some upside for a narrower range of outcomes.
Diversification Strategies and Types
There are several ways to diversify, and they protect against different things. Investor.gov's rule of thumb is that a portfolio should be diversified at two levels: between asset categories and within them.
| Diversification strategy | How it works | What it protects against |
|---|---|---|
| Across asset classes | Mix stocks, bonds, cash and possibly others | One asset class falling hard |
| Within an asset class | Many issuers, not four or five | One company or issuer failing |
| Sector | Spread across industries | One industry's downturn |
| Geographic | Domestic and international holdings | One country's economy or currency |
| Size and style | Large and small companies, growth and value | One market segment falling out of favor |
| Time | Investing in stages rather than all at once | Bad timing on a single entry |
| Strategy and timeframe | Different methods and holding periods | One method's bad regime |
| Correlation-led selection | Add the market least correlated with what you hold | Hidden duplicate bets |
The last row is the one most guides skip, and it is the core of a correlation budget. Each candidate gets judged on its highest correlation to the existing book, not on how good its chart looks. In an illustrative study of eight futures markets measured for this guide on Yahoo Finance daily futures data from 2006 to 2026, starting from ES and always adding the least-correlated market picked the 10-Year T-Note first, then Silver, then Crude Oil, then Euro FX.
Asset Classes Used to Spread Risk
Asset classes are the broadest buckets for diversification, because each tends to respond differently to growth, inflation and interest rates. Investor.gov names stocks, bonds and cash as the three most common, and describes them this way:
- Stocks have historically had the greatest risk and highest returns of the three. Investor.gov notes that large company stocks as a group "have lost money on average about one out of every three years."
- Bonds are generally less volatile than stocks but offer more modest returns. High-yield bonds can behave more like stocks, with matching risk.
- Cash and cash equivalents (savings deposits, CDs, Treasury bills, money market funds) carry the lowest return and low loss risk, and their main threat is inflation.
Funds as a diversification shortcut
Picking enough individual securities is hard. Investor.gov says you'll need "at least a dozen carefully selected individual stocks to be truly diversified," and points out that mutual funds make it easy to own a small slice of many investments. A total stock market index fund can own thousands of companies.
A fund label is not a guarantee, though. A sector fund concentrated in one industry is not diversified, and Investor.gov warns that a narrow fund may need company. US law also sets a formal test: under the Investment Company Act of 1940, a "diversified company" must hold at least 75% of its assets in cash, government securities, other investment companies and other securities limited to no more than 5% of total assets in any one issuer and no more than 10% of that issuer's voting securities. A fund that doesn't meet it is non-diversified, which is worth checking before you treat one fund as a whole portfolio.
Building Blocks of a Diversified Portfolio
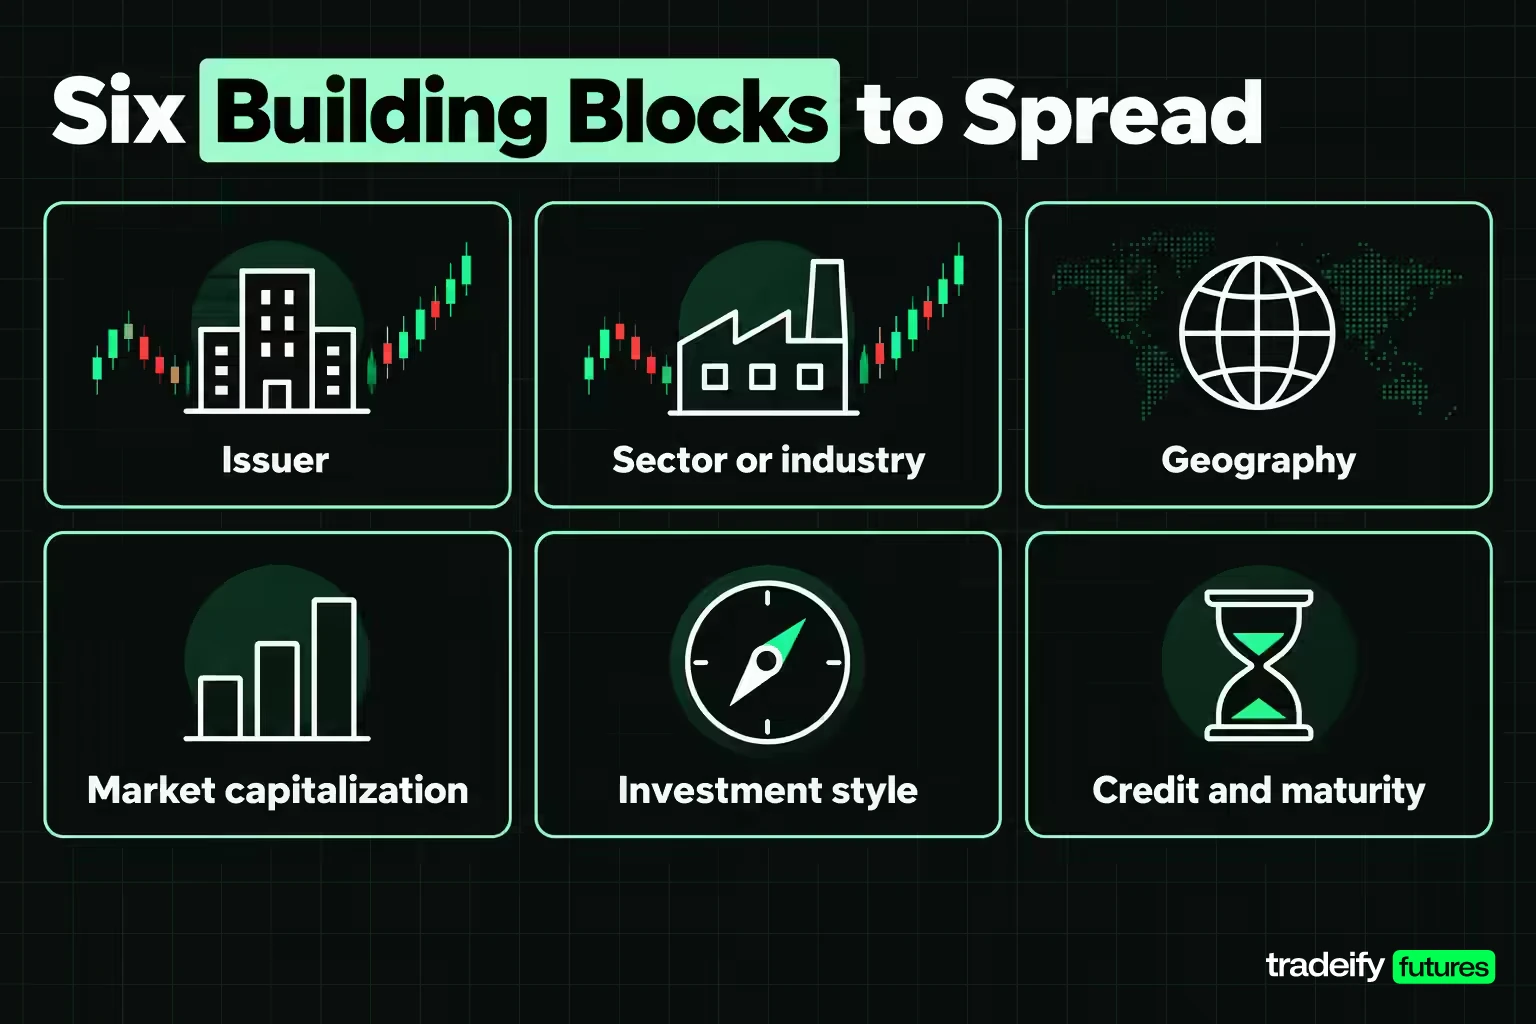
Within each asset class, a diversified portfolio is assembled from smaller building blocks. Each block is a separate way to end up accidentally concentrated.
- Issuer: how much rides on any one company, government or fund manager.
- Sector or industry: technology, energy, health care, financials and so on.
- Geography: home country, other developed markets, emerging markets.
- Market capitalization: large, mid and small companies. Investor.gov suggests considering large company stock funds alongside small company and international stock funds.
- Investment style: growth, value, income.
- Credit and maturity, for bonds: government versus corporate, short versus long duration.
Traders need two more blocks:
- Market cluster: equity index, rates, currencies, energy, precious metals, base metals. On Yahoo Finance daily futures data from 2006 to 2026, measured for this guide, ES and NQ correlated at 0.92, so the cluster matters more than the ticker.
- Strategy and session: what kind of setup a position comes from and when it is held.
A check that works for both investors and traders: list every holding, tag it with each building block, then count the largest share of risk sitting in any single tag. If one tag carries most of the risk, the portfolio is concentrated, whatever the number of line items says.
Related lesson: Concentration risk
Alternative Investments and Commodities
Alternative investments are assets outside stocks, bonds and cash. Investor.gov names real estate, precious metals and other commodities, and private equity as further asset categories some investors add, and notes each carries category-specific risks.
Their appeal for diversification is that they respond to different drivers. Real estate tracks rents and property credit, commodities track supply and inflation shocks, and private equity tracks deals that are not marked to market daily.
Futures data give a concrete read on one alternative. In an illustrative study of eight futures markets measured for this guide on Yahoo Finance daily futures data from 2006 to 2026, Gold's daily correlation to ES was 0.03, close to unrelated. On the 53 worst ES sessions (the bottom 1%), when ES fell 5.29% on average, Gold rose 0.55% on average and fell on only 49.1% of those days. Copper and crude oil behaved very differently on the same days, falling 2.18% and 3.75% on average.
So "commodities" is not one diversifier. Gold acted as a partial offset to equity stress in this sample, while copper and crude acted more like growth bets.
Alternatives also carry costs the brochure tends to skip:
- Liquidity: private equity and some real estate can't be sold quickly.
- Fees: alternative funds often charge more than index funds.
- Complexity: commodity futures roll, carry storage effects and can move sharply on supply news.
- Smoothed prices: assets valued infrequently can look less correlated than they really are, because their price moves show up late.
Stages of Diversification From One Holding to a Full Book
Diversification usually builds in stages. For an investor, a common progression runs:
- One stock or one property.
- Several stocks in different industries.
- A broad fund or several funds.
- Stocks plus bonds and cash.
- International holdings added to the domestic ones.
- Alternatives and multiple managers.
Each stage spreads risk further, but each also adds less than the one before, because the easy correlation savings get spent first.
Diversification stages measured on futures markets
An illustrative study of eight futures markets, measured for this guide on Yahoo Finance continuous front-month daily closes (5,224 sessions from 2006 to 2026), shows the same pattern for a trader adding markets. Starting from ES, each step adds the market whose highest correlation to the existing book is lowest.
| Markets held | Market added | Highest correlation to existing book | Effective number of markets |
|---|---|---|---|
| 1 | ES | none | 1.00 |
| 2 | 10-Year T-Note | -0.25 | 1.88 |
| 3 | Silver | 0.15 | 2.83 |
| 4 | Crude Oil | 0.23 | 3.59 |
| 5 | Euro FX | 0.33 | 4.31 |
| 6 | Copper | 0.45 | 4.63 |
| 7 | Gold | 0.79 | 4.61 |
| 8 | NQ | 0.92 | 4.68 |
Five well-chosen markets reached 4.31, about 92% of the 4.68 that all eight reached. Adding Gold to a book that already held Silver pushed the effective count down slightly, because Gold mostly duplicated Silver's risk.
Order matters as much as count. Adding the markets in a different order (ES, then NQ, then Copper, Silver, Gold, Crude Oil, Euro FX and the T-Note last) left ES plus NQ at 1.08 effective markets, and the book only passed 4.0 at the seventh market.
Why Correlations Change in a Crisis
A correlation is a measurement of a sample, not a fixed property of two markets. Run eight futures markets (ES, NQ, the 10-Year T-Note, Euro FX, Crude Oil, Gold, Silver and Copper, on daily closes from 2006 to 2026) over different periods and the numbers move.
| Period | Sessions | Average pairwise correlation | Effective markets | ES and T-Note correlation |
|---|---|---|---|---|
| 2006 to 2011 | 1,497 | 0.21 | 4.11 | -0.36 |
| 2012 to 2016 | 1,254 | 0.18 | 4.58 | -0.33 |
| 2017 to 2021 | 1,256 | 0.16 | 4.90 | -0.33 |
| 2022 to 2026 | 1,217 | 0.22 | 4.70 | 0.06 |
The biggest shift is the stock and bond pair. Measured one calendar year at a time, ES and the 10-Year T-Note had a negative daily correlation in every year from 2007 through 2021. It turned positive in 2022 (0.19), stayed slightly positive in 2023 and 2024 (0.03 each), went back to -0.24 in 2025 and reads 0.26 for 2026 through November 4.
Diversification in the 2008, 2020 and 2022 Selloffs
| Stress window | Sessions | ES change | Average pairwise correlation | ES and T-Note | ES and NQ | Gold and Silver |
|---|---|---|---|---|---|---|
| Sep 1 to Dec 31, 2008 | 85 | -29.8% | 0.21 | -0.30 | 0.95 | 0.72 |
| Feb 20 to Apr 30, 2020 | 48 | -14.3% | 0.16 | -0.50 | 0.97 | 0.77 |
| Calendar 2022 | 251 | -18.9% | 0.30 | 0.19 | 0.97 | 0.81 |
In 2008 and 2020 the shock was a growth scare, bonds rallied, and the stock and bond offset worked better than usual. In 2022 the shock was inflation and rising rates, which hurt stocks and bonds together. The average pairwise correlation jumped to 0.30, the highest of any window in the study.
The pattern on bad days is also uneven in this guide's own Yahoo Finance futures data. ES fell on 2,335 of the 5,224 sessions. On those days NQ also fell 83.2% of the time, Copper 60.3%, Crude Oil 56.0%, Euro FX 54.8% and Silver 52.9%, while Gold fell 49.3% of the time and the T-Note only 39.6%. On the 53 worst ES sessions, NQ fell on every one of them, Copper on 84.9% and Crude Oil on 83.0%, while the T-Note fell on only 24.5%.
The takeaway is not that diversification fails in every crisis. It is that which markets protect you depends on what kind of crisis it is. Before trusting a diversifier, ask which shock it has offset in the past, and whether that is the shock you're actually worried about.
Diversification Risks and Limitations
Diversification has limits, and most of them show up when you need it.
- It does not remove market-wide risk. When one shock drives everything, diversified portfolios fall too.
- Correlations can flip. A hedge-like relationship measured in calm years can weaken or reverse in the next regime.
- Over-diversification dilutes. Past a point, each new holding adds cost and tracking work while barely changing risk. In an eight-market study measured for this guide on Yahoo Finance daily futures data from 2006 to 2026, the effective number of markets went from 4.63 at six markets to 4.68 at eight.
- It costs money. Investor.gov warns that adding more investments usually adds fees and expenses, which lower returns.
- False diversification. Several funds or markets that own the same exposure look spread out and aren't.
Diversified Basket Losses in the 2022 Rate Shock
A matched-volatility test makes the risk concrete. A four-market futures basket (ES, ZN, 6E and Gold, each sized by the inverse of its volatility) and ES alone were both scaled so a typical day was worth $100, using daily data from 2006 to 2026.
| Calendar 2022, matched volatility | Result |
|---|---|
| ES alone | -$1,473 |
| Basket, ES leg | -$648 |
| Basket, 10-Year T-Note leg | -$1,734 |
| Basket, Euro FX leg | -$444 |
| Basket, Gold leg | +$41 |
| Basket total | -$2,785 |
In 2022 the diversified basket lost nearly twice what ES alone lost at the same volatility. Its full-sample maximum drawdown ran from January 5, 2021 to September 27, 2022, while ES's ran from October 9, 2007 to March 9, 2009. The basket had swapped one kind of tail for another.
The reason is the weighting. Sizing by inverse volatility put 43.6% of the basket's dollar weight in the T-Note and 29.3% in Euro FX, because they move less per day than stocks. Those were the two legs that fell alongside equities in 2022. Volatility-based sizing is a sensible default, but it hands the most weight to the quietest markets, and quiet markets are not always the safe ones.
Related lesson: Hedging risk
Factors to Weigh Before You Diversify
The right amount and type of diversification depends on the person or account. Investor.gov puts time horizon and risk tolerance first.
- Time horizon. A long horizon can absorb more volatile assets, because there is time to wait out slow economic cycles. Money needed soon can't ride out a drawdown.
- Risk tolerance. Investor.gov defines it as "your ability and willingness to lose some or all of your original investment in exchange for greater potential returns."
- Liquidity needs. Holdings you may need to sell quickly shouldn't sit in assets that take weeks or months to sell.
- Costs and taxes. More holdings and more rebalancing can mean more fees and taxable events.
- Market conditions. Which assets offset each other depends on whether the shock is about growth, inflation or rates. Bonds cushioned stocks in the 2008 crisis and fell with them in 2022.
- Employer and industry exposure. Your job is a position too. Someone working in energy may want less energy in the portfolio.
- Account size and position size. In futures, contract size can cap how many markets an account can hold at all. One MES contract with a stop at twice its average daily range carried $1,020.31 of risk as of November 4, 2026.
- Rules on the account. A trading account with a daily loss limit measures every position against the same limit on the same day.
Contract Size Limits Diversification in Futures
Diversification math usually assumes you can hold any fraction of a position. Futures don't work that way. You hold whole contracts, and each contract puts a fixed dollar amount at risk for a given stop.
The table uses a stop at twice the 14-day average true range (ATR, Wilder smoothing) measured at the November 4, 2026 close, and shows the account size at which one contract equals 1% risk. These figures are a dated snapshot and change with volatility.
| Contract | Contract size | Risk per contract at 2 x ATR as of November 4, 2026 | Account where one contract is 1% risk |
|---|---|---|---|
| ES | $50 x S&P 500 index | $10,203.07 | $1,020,307 |
| MES | $5 x S&P 500 index | $1,020.31 | $102,031 |
| NQ | $20 x Nasdaq-100 index | $26,780.46 | $2,678,046 |
| MNQ | $2 x Nasdaq-100 index | $2,678.05 | $267,805 |
| ZN | $100,000 face value | $1,201.16 | $120,116 |
| 6E | 125,000 euros | $1,483.97 | $148,397 |
| M6E | 12,500 euros | $148.40 | $14,840 |
| CL | 1,000 barrels | $9,929.13 | $992,913 |
| MCL | 100 barrels | $992.91 | $99,291 |
| GC | 100 troy ounces | $17,376.84 | $1,737,684 |
| MGC | 10 troy ounces | $1,737.68 | $173,768 |
| SI | 5,000 troy ounces | $15,398.96 | $1,539,896 |
| HG | 25,000 pounds | $5,192.62 | $519,262 |
Micro contracts help, but even at micro size most legs need a six-figure account to stay at 1% risk on a stop this wide.
A worked diversification example at $100,000
Imagine a trader with a $100,000 account who wants the four-market basket of ES, ZN, 6E and Gold, with total risk of 1% ($1,000). Split evenly, that is $250 of risk per leg.
- One MES carries $1,020.31 of risk, so zero contracts fit in $250.
- One ZN carries $1,201.16, so zero fit.
- One M6E carries $148.40, so one fits.
- One MGC carries $1,737.68, so zero fit.
The smallest whole-contract version of the basket (one MES, one ZN, one M6E and one MGC) carries $4,107.55 of risk. That is 4.11% of a $100,000 account, 8.22% of $50,000, 2.74% of $150,000 and 1.64% of $250,000. Holding it at 1% takes an account of about $410,755.
There are three honest ways out:
- Tighten the stop, and accept that it gets hit more often.
- Hold fewer legs, keeping only the ones that actually diversify.
- Accept the larger number, and stop calling it 1% risk.
What doesn't work is holding all four legs and believing the plan's 1% is still the real figure. The plan said 1%. The account is carrying four times that.
Related lesson: Position sizing
Rebalancing a Diversified Portfolio
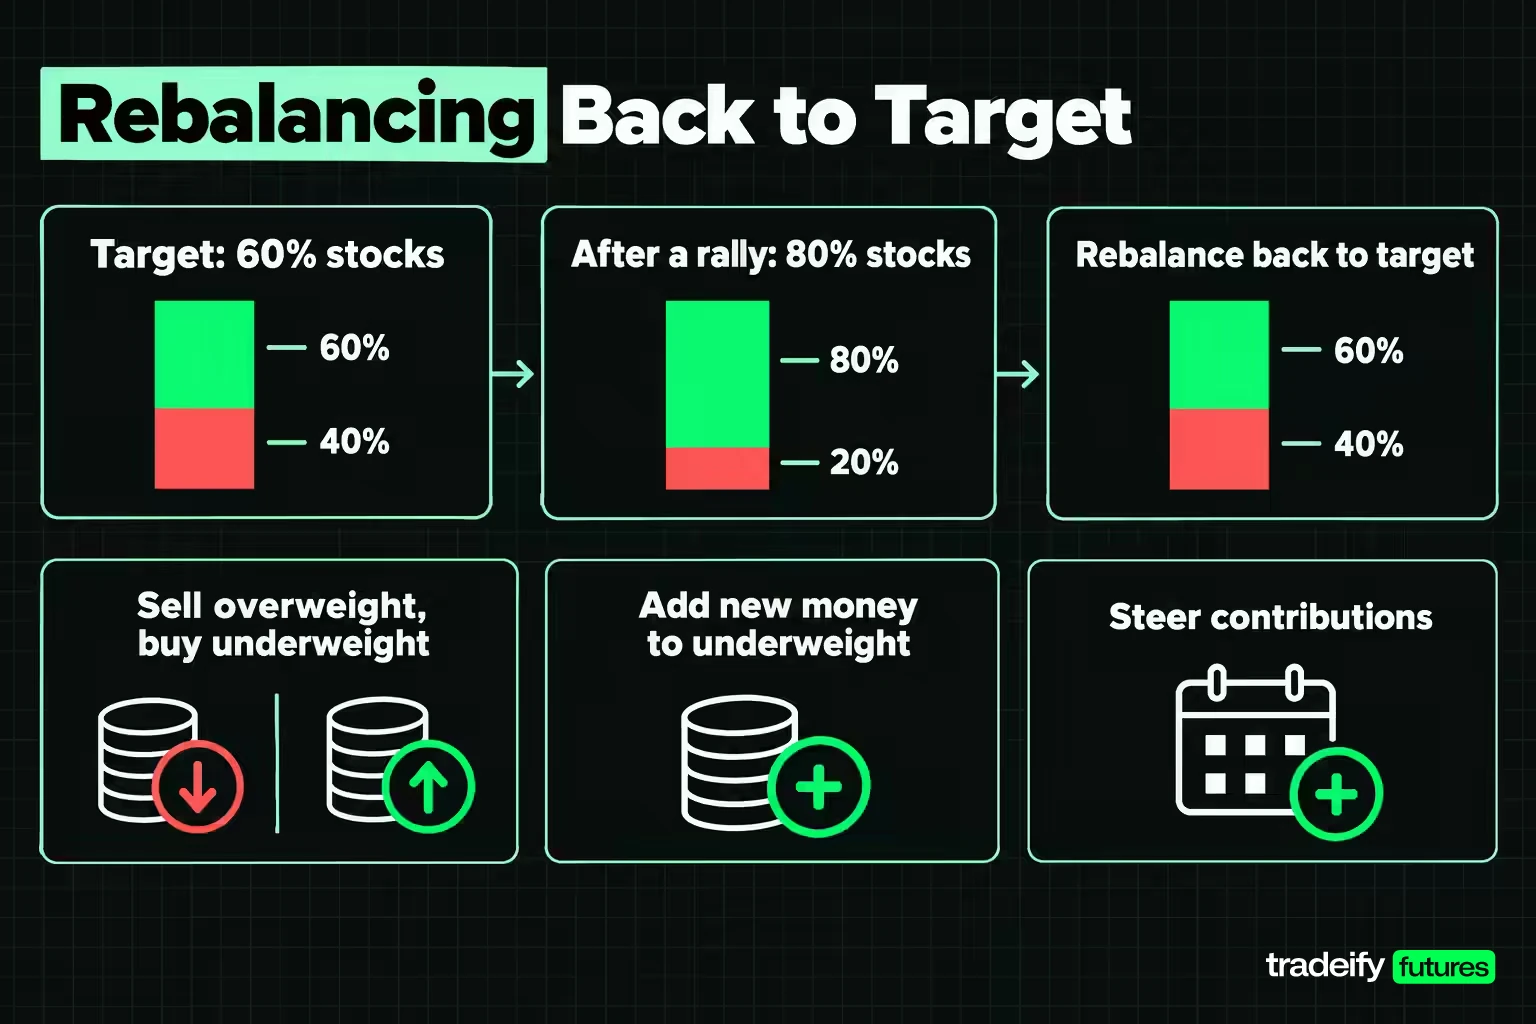
Rebalancing is bringing a portfolio back to its target mix after markets have pushed it off. Investor.gov's example: if stocks are meant to be 60% of a portfolio and a rally takes them to 80%, the portfolio now carries more stock risk than planned.
Investor.gov lists three ways to rebalance:
- Sell some of the overweight holdings and buy the underweight ones.
- Buy more of the underweight holdings with new money.
- Steer ongoing contributions toward the underweight holdings until the mix is back in line.
There are two common triggers. Calendar rebalancing happens on a set interval, which Investor.gov says many experts put at every six or twelve months. Threshold rebalancing happens when an asset's weight drifts past a percentage set in advance. Either way, Investor.gov says rebalancing tends to work best done infrequently, and to check fees and tax consequences first.
For a trader, rebalancing has a second meaning: re-measuring the correlations the book is built on. On Yahoo Finance daily futures data measured for this guide, the correlation between ES and the 10-Year T-Note went from -0.33 in 2017 to 2021 to 0.06 in 2022 to 2026. Re-running the correlation matrix once a year, and after any regime change, keeps the budget honest.
How to Build a Diversification Correlation Budget
This method turns the measurement into decisions. It is short on purpose, because the constraint that usually binds is the account, not the analysis.
- List the markets you actually trade and the contract you would use in each (full size or micro). The size choice belongs in the list, not later.
- Price one contract at your stop. That dollar figure decides how many legs can exist before any correlation work starts.
- Cap the leg count. Divide your total risk budget by the most expensive leg's risk. The whole number is the most legs you can hold if every leg were that expensive.
- Add by lowest correlation. For each candidate, find its highest correlation to what you already hold, and add the one where that number is lowest.
- Stop near 0.7. In an eight-market study measured for this guide on Yahoo Finance daily futures data from 2006 to 2026, the legs added above that level (Gold at 0.79 and NQ at 0.92) moved the effective count from 4.63 to 4.68, close to nothing.
- Stress-test the book against 2022. Check whether the legs you hold fell together in that window. If they did, your book can fall together too.
- Re-measure once a year and after any big shift in rates or inflation.
Diversification on a Funded Futures Account
A funded or evaluation futures account adds a constraint a long-term portfolio doesn't have: a loss limit measured on the whole account. A typical firm's daily loss limit and trailing drawdown count every open position against the same number on the same day.
That makes same-day correlation the figure that matters. Five positions that fell together in 2022 hit a daily limit just as one oversized position would, and the limit doesn't care that they were in different asset classes. Before adding a leg, add up the largest plausible adverse move for every leg on the same day and compare the total with the daily limit and the room left above the drawdown floor. If it doesn't fit, the leg count is too high, whatever the long-run correlation matrix says.
On our accounts, ES, MES, NQ, MNQ and the other US equity index futures sit in one Equity Index Product Group, and opposing positions in two products from the same group count as prohibited hedging, in one account or across accounts, so long ES and short NQ is a rule violation rather than a diversifier. Positions are sized by contract limits (a 50K account allows up to 4 minis or 40 micros), Treasury futures such as ZN are not on our product list, and every position is closed by 4:45 PM ET, so the correlations that matter are the ones inside a single session.
Related lesson: Portfolio heat and total exposure
Diversification FAQ
What are the different types of diversification strategies?
The main types are diversification across asset classes, within an asset class, by sector, by geography, by company size and style, over time, and across strategies and timeframes. Traders can add correlation-led selection, choosing each new market by its correlation to what they already hold. Businesses use a different set: vertical, horizontal and lateral diversification in Ansoff's framework.
What is a synonym for diversification?
In general use, "variety" or "broadening" come closest, since Merriam-Webster defines diversification as an increase in the variety or diversity of something. In investing, "spreading risk" says the same thing. "Asset allocation" is related but different, because it means choosing the mix of asset classes rather than spreading within them.
What does the word "diversified" mean?
Diversified means made up of distinct or unlike elements. In investing, Merriam-Webster defines it as "balanced defensively by having funds divided among varied securities." A diversified fund also has a legal meaning in the US, set by the Investment Company Act of 1940.
What is the 5/25 rule for diversified funds?
The 5/25 rule says a fund can put no more than 25% of its total assets in any one issuer, and at least half its assets must sit in holdings capped at 5% each. It comes from the US tax code's test for a regulated investment company (26 U.S.C. 851), checked at the end of each quarter. The 50% portion can also include cash, government securities and other regulated investment companies.
Is diversification the same as hedging?
No. Diversification combines holdings that move differently on average, which lowers overall volatility. A hedge is a position chosen to offset a specific exposure in a specific scenario. The 2022 stock and bond flip shows the difference: an average diversifier can stop offsetting at the worst moment.
How many markets do you need to be diversified?
Five well-chosen markets can provide most of the diversification that eight provide. In an eight-market study measured for this guide on Yahoo Finance daily futures data from 2006 to 2026, five futures markets picked by low correlation reached 4.31 effective markets out of the 4.68 all eight reached. Two equity index contracts together reached only 1.08.
Does diversification guarantee you won't lose money?
No. Diversification narrows the range of outcomes, but a diversified portfolio can still lose, and a book of correlated positions can lose on every leg on the same day. In daily futures data measured for this guide on Yahoo Finance from 2006 to 2026, NQ fell on every one of the 53 worst ES sessions.
This article is educational and is not investment, legal or tax advice; futures and other leveraged products can lose more than expected, the study figures are historical measurements that do not predict future correlations or results, contract values and volatility change over time, and funded or evaluation accounts are simulated trading accounts with their own rules.


