



TL;DR: Hedging risk is the gap between what a second position was supposed to offset and what it actually offsets. Over 20 years of daily ES data, only an NQ hedge cut volatility by a large amount, and it gave up all the best-day gains. Gold, silver and crude removed 0.10%, 2.42% and 5.64% of ES variance. Size a hedge from correlation, check it fits whole contracts, and compare it with trading smaller.
Hedging risk has two meanings, and traders usually only hear about the first one. Hedging is the act of taking a second position to reduce the risk of the first. Hedging risk is also what stays behind after you do it: the chance that the second position fails to move the way the plan assumed.
The urge to hedge usually shows up at an awkward moment. You are long, the market turns against you, and closing the trade feels like admitting the idea was wrong. So you short something that "usually moves the other way" and tell yourself you are protected. Sometimes you are. Often you have just opened a second trade you did not plan.
This guide covers both meanings. It explains how hedging works for investors, businesses and futures traders, the derivatives used to build a hedge, and the math that sizes one. Then it tests the idea on 20 years of E-mini S&P 500 (ES) futures data against four common hedge legs, because a hedge you have never measured is a guess with a second commission attached.
What Hedging Risk Means
Hedging is taking a position designed to gain when your main position loses. The CFTC glossary defines a hedger as a market participant who takes positions in futures or other derivatives opposite to positions held in the cash market, to minimize the risk of loss from an adverse price change.
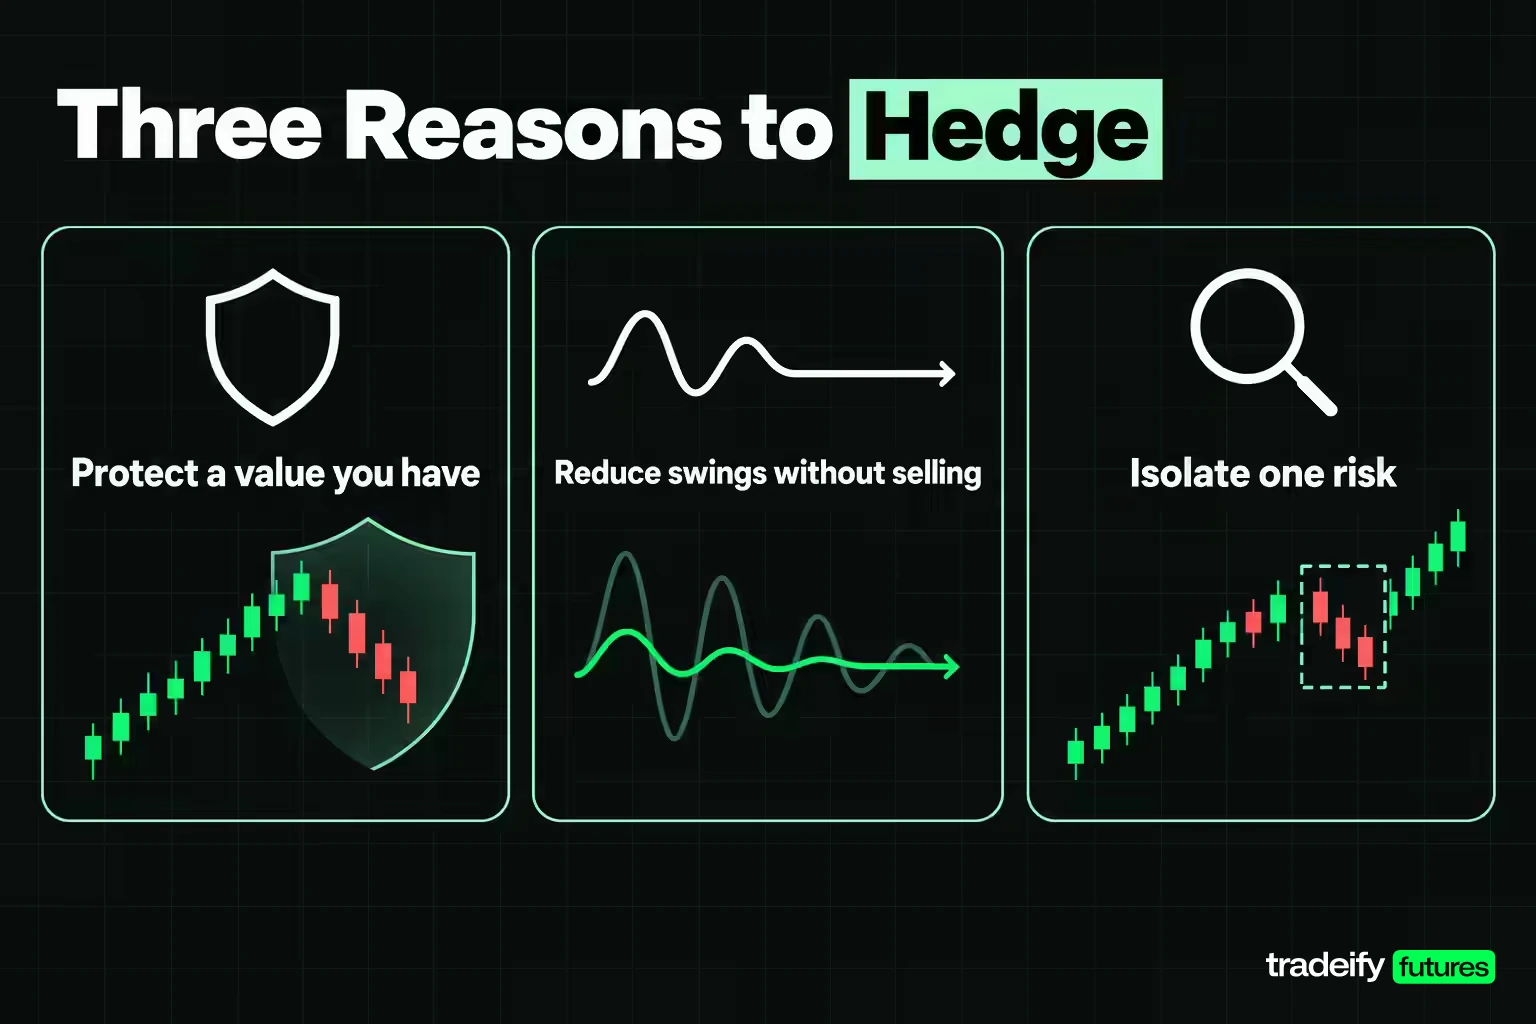
Why hedge at all? Three reasons come up again and again.
- Protecting a value you already have. A fund manager with a large stock portfolio, a farmer with a crop in the ground, or an importer with a bill due in euros wants to lock in today's value or price.
- Reducing volatility without selling. Selling may trigger taxes, break a strategy, or be impossible (restricted stock, an unharvested crop). A hedge reduces the swings without closing the original exposure.
- Isolating one risk. A hedge can strip out a risk the holder does not want, such as currency moves on a foreign investment, while keeping the risk they do want.
The second meaning of hedging risk is the one that costs traders money. A hedge carries its own risks:
- Correlation and basis risk. The hedge leg may not move opposite the main position. The CFTC calls the narrow version of this basis risk: the risk that the gap between the cash price and the futures price widens or narrows unexpectedly between the time a hedge is placed and the time it is lifted.
- Sizing risk. A hedge has a correct size. Too small and it barely helps. Too large and it becomes a new directional bet.
- Cost and give-up risk. Every hedge leg has spreads, commissions, margin or premium. A hedge that works also takes away part of the gain on good days.
So the real question is never "am I hedged?" It is "how much of my risk did this hedge remove, what did it cost, and what new risk did it add?"
Types of Hedging Strategies
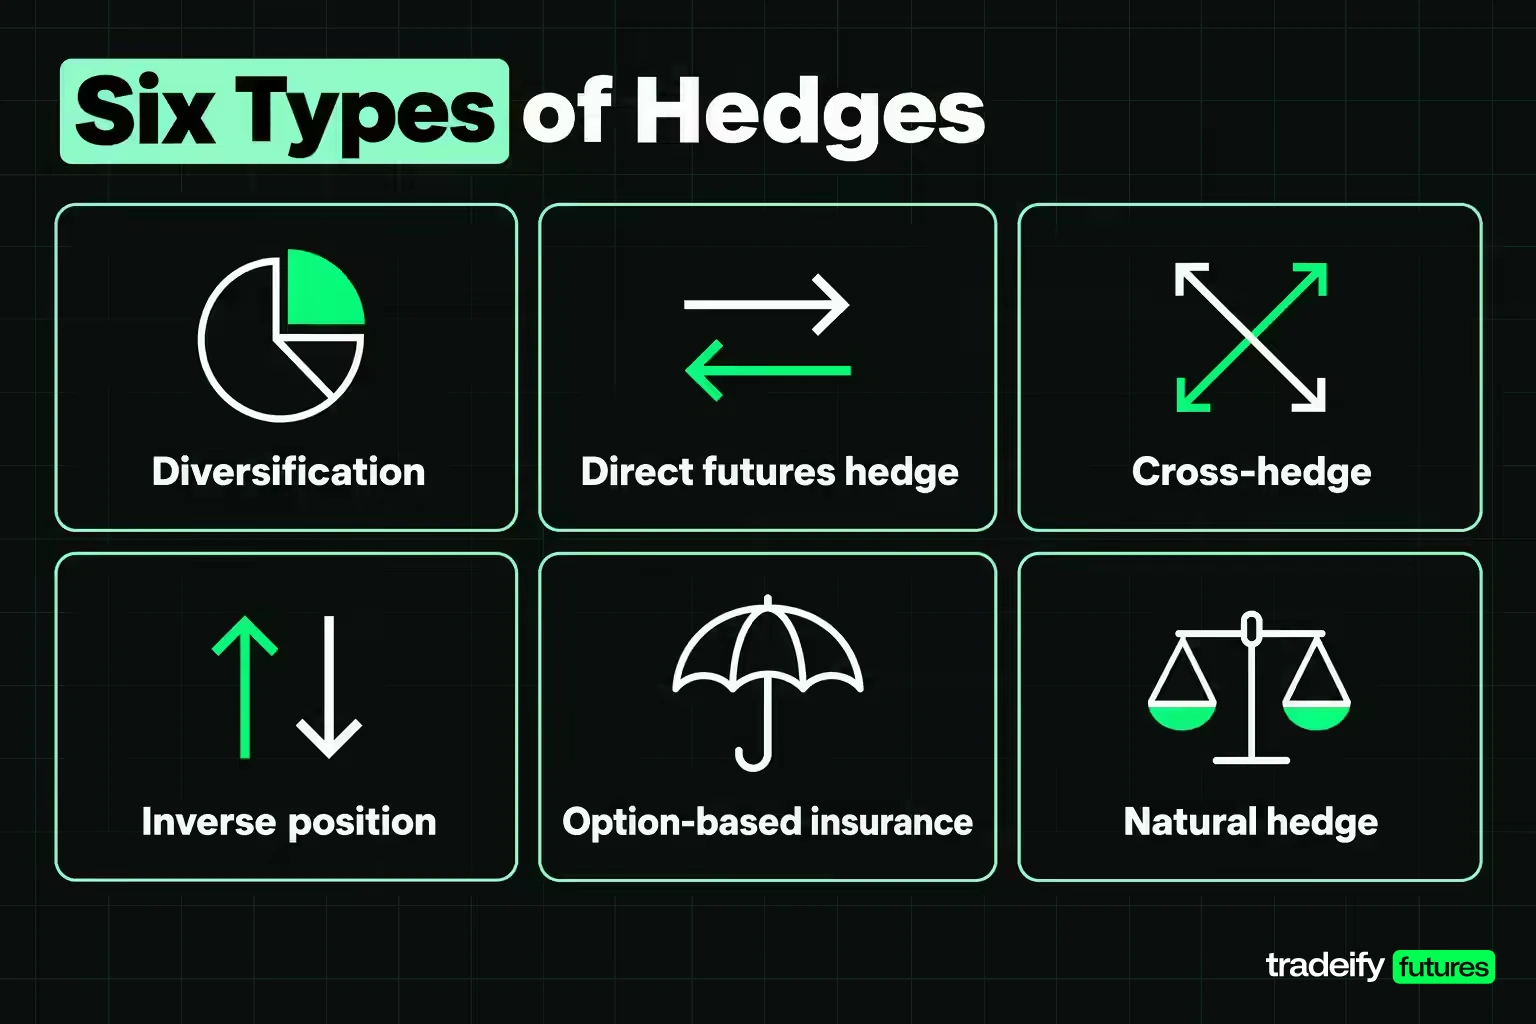
Hedging strategies differ in what they protect against, what they cost, and how much hedging risk they leave behind. Most fall into six types.
| Hedging strategy | How it works | What it costs | Main weakness |
|---|---|---|---|
| Diversification | Hold assets that do not move together | Lower return from the assets you hold less of | Correlations rise in a crash |
| Direct futures or forward hedge | Take the opposite position in the same asset | Spread, commission, margin | Basis risk and capped upside |
| Cross-hedge | Hedge with a related but different instrument | Same as a direct hedge | Correlation can break |
| Inverse or negatively correlated position | Hold something that tends to rise when the main asset falls | Carry and opportunity cost | The relationship is unstable |
| Option-based insurance | Buy puts or other options that pay off in a decline | Premium, which decays over time | Expensive if held continuously |
| Natural hedge | Match revenues and costs in the same currency or commodity | Little or none | Only available to some businesses |
How each hedging strategy works
Diversification is the mildest form of hedging. It does not offset a specific position. It spreads risk so that one loss is a smaller share of the whole. It is cheap and often enough for long-term investors, but it gives the least protection exactly when markets fall together.
A direct hedge offsets the same asset: a wheat farmer sells wheat futures, or a stock holder sells index futures against an index fund. It is the most precise hedging tool, and it also cancels most of the upside.
A cross-hedge uses a different but price-related instrument. The CFTC glossary defines it as hedging a cash position in futures or options on a different but related commodity. Jet fuel hedged with heating oil futures is the textbook case. Cross-hedges are only as good as the correlation behind them.
Inverse-correlation hedges rely on a historical tendency, such as gold rising when stocks fall. This is the most popular retail hedging idea and the least reliable, as the ES study later in this guide shows.
Option-based hedges work like insurance. A put option pays off below its strike price, so it limits losses while leaving gains open, at the cost of a premium.
Natural hedges happen inside a business. A European company that earns dollars and also pays dollar costs is partly hedged before it touches a derivative.
Related lesson: Correlation risk
Derivatives Used for Hedging Risk
Derivatives are the main tools for hedging risk because they let you take an offsetting position without buying or selling the underlying asset. Four kinds do most of the work.
Futures are standardized exchange-traded contracts to buy or sell a set quantity at a future date. Every contract on the same product is identical, a clearinghouse stands between buyer and seller, and positions are marked to market daily. That makes futures cheap to trade and easy to exit, but the fixed contract size means a hedge can only be built in whole contracts.
Forwards are private agreements to deliver a set quantity at a set future date and price. The CFTC glossary notes that their terms are more personalized than futures: delivery time and amount are agreed between buyer and seller. Businesses use them to match an exact invoice amount and date. The tradeoff is counterparty risk and no easy exit.
Options give the buyer the right, but not the obligation, to buy (call) or sell (put) at a set price within a set period. For hedging, the key feature is asymmetry. A put limits the downside and leaves the upside open, and the buyer pays a premium for that.
Swaps exchange one stream of payments for another. The CFTC glossary lists interest rate, commodity, currency, equity and credit default swaps. A company with a floating-rate loan can swap floating payments for fixed ones, which is the most common form of interest rate hedging. Swaps are mainly institutional tools.
Comparing hedging derivatives side by side
The four hedging derivatives differ mainly in where they trade, who carries an obligation, and what you pay upfront.
| Derivative | Traded where | Obligation | Upfront cost | Typical hedger |
|---|---|---|---|---|
| Futures | Exchange, cleared | Both sides obligated | Margin deposit | Producers, funds, traders |
| Forwards | Private agreement | Both sides obligated | Usually none | Importers, exporters, corporates |
| Options | Exchange or private | Buyer has a right, seller an obligation | Premium paid | Investors protecting stock |
| Swaps | Mostly private, some cleared | Both sides obligated | Usually none | Banks, borrowers, corporates |
The choice comes down to two questions. Do you need to keep the upside? Then you pay for an option. Do you need an exact amount and date? Then a forward fits better than a standard futures contract. Everything else is a cost comparison.
Hedging a Stock Portfolio With Puts and Index Futures
Stock investors hedge a portfolio with two main tools: put options on the stock or index, and short index futures. They protect in different ways and leave different kinds of hedging risk.
Protective puts
A protective put is a long put added to a long stock position. The Options Industry Council compares it to homeowner's insurance: you pay a premium hoping you never need the protection. Its maximum loss formula is the stock purchase price minus the strike price plus the premium paid.
Here is an illustrative example with round numbers:
- Buy 100 shares at $50 ($5,000).
- Buy one put with a $45 strike for a $1.50 premium ($150).
- Maximum loss is $50 minus $45 plus $1.50 = $6.50 per share, or $650, no matter how far the stock falls before the put expires.
- Breakeven is $51.50, because the stock has to rise by the premium before the hedged position makes money.
The downside is cost. Puts lose value as time passes, so buying protection continuously drags on returns year after year. Many investors buy puts only around specific risks, such as an earnings release or a concentrated position they cannot sell yet. Buying the put at the same time as the stock is called a married put.
Index futures hedges
A short index futures position offsets the market part of a stock portfolio's risk. The number of contracts depends on the portfolio's value, its beta (how much it moves relative to the index), and the futures contract's value.
Illustrative example: a $500,000 portfolio with a beta of 1.2, hedged with ES at an illustrative 6,000. One ES contract is $50 times the index, so $300,000. The hedge needs 1.2 x $500,000 / $300,000 = 2 contracts. At the ES close of 7,720.50 on November 4, 2026, the same math gives 1.55 contracts, which cannot be traded, so the hedge is either over or under size.
A futures hedge costs much less upfront than puts, but it gives up the gains as well as the losses. It also hedges only market risk. If one stock in the portfolio collapses on its own news, an index hedge does little.
Portfolio insurance is the strategy of selling more index futures as the market falls to recreate a put. It needs liquid markets to work, and those are hardest to find in a crash.
Related lesson: Put options
Currency and Commodity Hedging Examples
Businesses hedge to protect operating margins, not to trade. Currency and commodity hedges are where hedging began, and they show the most common hedging risk, basis risk, clearly.
Currency hedging with forwards or futures
Illustrative example: a US importer owes €1,000,000 in three months. If the euro rises, the dollar cost of the bill rises.
- One Euro FX futures contract (6E) is 125,000 euros, so the hedge is €1,000,000 / 125,000 = 8 long contracts.
- At an illustrative rate of 1.1000, the bill costs $1,100,000.
- If the rate moves to 1.1500, the bill costs $50,000 more.
- The 8 long contracts gain 8 x 125,000 x 0.0500 = $50,000, which offsets the higher cost.
Many companies use a bank forward instead, because it can match the exact amount and payment date. Futures are standardized, so an invoice that is not a multiple of 125,000 euros, or a payment date that does not line up with a contract month, leaves part of the risk unhedged.
Commodity hedging and basis risk
Illustrative example: a farmer expects to harvest 50,000 bushels of corn. One corn futures contract (ZC) is 5,000 bushels, so the farmer sells 10 contracts to lock in a price.
The farmer sells corn in the local cash market, not on the exchange, so the result depends on basis, which the CFTC defines as the cash price minus the futures price. Suppose the local cash price is $4.10 and futures are $4.30, a basis of -$0.20. If the basis widens to -$0.35 by harvest, the farmer loses $0.15 per bushel versus the plan, or $7,500 on 50,000 bushels, even though the futures hedge did exactly its job. That leftover loss is basis risk.
The same logic applies to an airline hedging fuel, a manufacturer hedging copper, or a utility hedging natural gas. The hedge removes most of the price risk and leaves a smaller, harder-to-predict basis risk.
Related lesson: Basis in futures
Hedge Ratio and Basis Risk
The hedge ratio is the size of the hedge relative to the position it protects, and getting it wrong is the fastest way to add hedging risk instead of removing it. The CFTC glossary defines it as the ratio of the value of futures bought or sold to the value of the cash position being hedged, a calculation needed to minimize basis risk.
The common way to set it is the minimum-variance hedge ratio, used in Louis Ederington's 1979 Journal of Finance paper on futures hedging:
- Hedge ratio = correlation x (volatility of the position / volatility of the hedge)
- Share of variance removed = correlation squared
Two practical points follow from that formula.
- Correlation controls everything. A correlation of 0.5 removes only 25% of the variance. A correlation of 0.2 removes 4%. If the two markets barely move together, the ratio is close to zero, which means there is nothing worth hedging with.
- The ratio is fitted, not fixed. It comes from past data and holds only while the relationship between the two markets holds. Relationships change, often during the stress the hedge was bought for.
Ederington measured hedging effectiveness as the percentage reduction in variance, and that is still the standard yardstick. It is a useful number, but it does not answer the question a trader cares about most: did the hedge help on the bad days, and was it better than trading a smaller position? The ES study in this guide answers both.
Basis risk is the futures-market name for the same problem. Even a direct hedge in the same commodity leaves basis risk, because cash and futures prices do not move exactly together. A cross-hedge adds a second layer: the two different instruments may drift apart.
Hedging Risk Measured on 20 Years of ES
To see how hedging risk behaves in practice, this guide measured one long E-mini S&P 500 (ES) position against four common hedge legs over 20 years. The method is simple enough to rebuild.
Study method for the ES hedges
- Data. Yahoo Finance continuous front-month daily closes for ES (E-mini S&P 500), NQ (E-mini Nasdaq-100), gold (GC), silver (SI) and crude oil (CL).
- Sample. Close-to-close daily returns from November 7, 2006 to November 4, 2026, on sessions where both legs have a valid close. That gives 5,031 paired sessions for NQ, 5,028 for gold, 5,027 for silver and 5,026 for crude. A gap of more than five calendar days breaks the chain, and non-positive closes (crude in April 2020) are dropped.
- Hedge ratio. The minimum-variance ratio, fitted on the whole sample, with the hedge leg short against the long ES position and rebalanced daily to that ratio.
- Limits. Continuous bars are not back-adjusted, so roll days add small artificial jumps, largest for monthly crude. Costs and slippage are not included. Fitting the ratio on the same data it is tested on flatters the hedge slightly.
Over the sample, ES had a daily standard deviation of 1.24%. At the November 4, 2026 close of 7,720.50, one ES contract was worth $386,025, so 1.24% equals about $4,791 per contract on a typical day.
Results for the four ES hedges
| Hedge leg vs long ES | Correlation with ES | Hedge leg daily volatility | Minimum-variance ratio | Variance removed | Volatility removed |
|---|---|---|---|---|---|
| Short NQ | 0.924 | 1.41% | 0.814 | 85.46% | 61.86% |
| Short gold | 0.032 | 1.16% | 0.034 | 0.10% | 0.05% |
| Short silver | 0.156 | 2.19% | 0.088 | 2.42% | 1.22% |
| Short crude | 0.238 | 2.70% | 0.109 | 5.64% | 2.86% |
The NQ hedge is the only one that changes the risk. That is expected: ES and NQ are both US stock index futures, so NQ is a near substitute. A long ES, short NQ position is really a spread trade on the gap between two indexes, not protection against a falling market.
Gold's correlation with ES over 20 years was 0.032, practically zero. The fitted hedge called for $0.034 of gold for every $1 of ES and removed 0.10% of the variance. For a daily ES position, a gold hedge is a second position, not a hedge.
Silver and crude sit between the two. They removed small but real amounts of variance, and both are positively correlated with ES, which is why the hedge leg is short. Neither works the way the usual "buy commodities when stocks fall" idea suggests.
Related lesson: Maximum risk per trade
Does a Hedge Beat Trading Smaller
A hedge that only reduces volatility has not earned its place, because trading a smaller position also reduces volatility, with no second leg and no second set of costs. So each hedge in the 20-year ES study was compared with a size cut that gives the same overall volatility: 61.86% smaller for NQ, 0.05% for gold, 1.22% for silver and 2.86% for crude.
The test that matters is what each choice does on the worst and best days. The table uses the worst 5% and best 5% of ES sessions in the sample (252 sessions for the NQ pairing, 251 for the others).
| Hedge leg | Worst-day loss removed by the hedge | Worst-day loss removed by the size cut | Best-day gain given up by the hedge | Best-day gain given up by the size cut |
|---|---|---|---|---|
| Short NQ | 100.50% | 61.86% | 103.81% | 61.86% |
| Short gold | 0.23% | 0.05% | 0.48% | 0.05% |
| Short silver | 4.29% | 1.22% | 3.40% | 1.22% |
| Short crude | 1.81% | 2.86% | -0.82% | 2.86% |
Reading the hedge versus size-cut results
Reading the hedging risk results hedge by hedge:
- NQ removed slightly more than the entire loss on ES's worst days, because NQ usually falls harder than ES in a selloff. It also gave up more than all of ES's gains on the best days. That is a market-neutral spread, and it should be judged as a trade, not as protection.
- Gold beat the size cut on the worst days by a fraction of a percent, and gave up more on the best days. Neither number is large enough to matter.
- Silver did better than the size cut on the worst days (4.29% versus 1.22%) at the cost of giving up 3.40% of the best days. That is the only commodity leg with a tail benefit beyond its volatility effect.
- Crude removed less of the worst-day loss than simply trading 2.86% smaller would have. Its benefit came on ordinary days and best days, not when ES was falling hardest.
The practical rule: if a hedge does not beat an equal-volatility size cut on the days you care about, trade smaller instead. It is a less exciting answer than a clever two-leg structure, but it has one fill, one cost and nothing to rebalance.
How the Hedges Did in Real ES Drawdowns
Averages are the wrong lens for a hedge, because a hedge is bought for specific bad stretches. So each hedge leg was run through every ES drawdown of 10% or more, measured on closes, in the 20-year sample. There were 7. The figures are dollars per ES contract, with the hedge rebalanced daily to its fitted ratio.
| ES drawdown | ES decline | Sessions | ES loss per contract | Short NQ leg | Short gold leg | Short silver leg | Short crude leg |
|---|---|---|---|---|---|---|---|
| Oct 2007 to Mar 2009 | -57.11% | 355 | -$45,013 | +$33,093 | -$602 | -$597 | +$588 |
| May 2015 to Feb 2016 | -14.26% | 183 | -$15,175 | +$10,283 | -$105 | +$684 | +$8,480 |
| Jan 2018 to Apr 2018 | -10.42% | 44 | -$14,975 | +$10,341 | +$35 | +$539 | +$629 |
| Sep 2018 to Dec 2018 | -20.43% | 64 | -$30,063 | +$26,831 | -$270 | -$403 | +$7,002 |
| Feb 2020 to Mar 2020 | -34.45% | 23 | -$58,338 | +$38,656 | +$56 | +$3,652 | +$11,100 |
| Jan 2022 to Oct 2022 | -25.02% | 195 | -$59,875 | +$70,415 | +$332 | +$2,507 | -$6,457 |
| Feb 2025 to Apr 2025 | -18.54% | 34 | -$57,138 | +$57,994 | -$215 | +$2,445 | +$5,649 |
What the drawdown record shows about each hedge
The hedging risk in each leg shows up clearly once the episodes are read one at a time:
- Gold lost money in 4 of 7 drawdowns, and its best result was +$332. In the 2007 to 2009 bear market gold rose 24.5% while ES fell, and the short gold leg still lost $602, because a fitted ratio of 0.034 is tiny and the timing of gold's rally did not match ES's decline.
- Crude helped in 6 of 7, including +$11,100 (19.0% of the loss) in early 2020. But in 2022, when inflation drove crude up 14.7% while stocks fell, the short crude leg lost $6,457. A hedge that works in demand shocks and fails in supply shocks is a bet on which kind of selloff comes next.
- Silver helped in 5 of 7, with small amounts.
- NQ offset 66.3% to 117.6% of each loss. It protected well because it is almost the same market, which is exactly why it is a spread rather than an independent hedge.
This is where the usual advice runs into the data. Gold is often described as a hedge for stocks. Over 20 years of daily ES data, a correctly sized short gold leg did not protect a long ES position in a meaningful way. Gold can still play a role in a long-term portfolio, but that is diversification over years, not a hedge for a futures position.
Related lesson: Portfolio heat and total exposure
Contract Size Limits on a Futures Hedge
A futures hedge has to be built in whole contracts, and that turns many hedge ratios into impossible trades. Rounding error is a hedging risk of its own. The table converts each fitted ratio from the ES study into contracts, using closes as of November 4, 2026.
| Hedge leg | Contract value on Nov 4, 2026 | Hedge contracts per 1 ES | ES contracts per 1 hedge contract |
|---|---|---|---|
| NQ ($20 x 28,566.75) | $571,335 | 0.55 | 1.82 |
| Gold (100 oz x $4,073.00) | $407,300 | 0.032 | 31.03 |
| Silver (5,000 oz x $52.12) | $260,600 | 0.131 | 7.64 |
| Crude (1,000 bbl x $88.12) | $88,120 | 0.479 | 2.09 |
One gold contract is the correct hedge for about 31 ES contracts. A trader with one ES contract cannot hedge with gold at the fitted size at all. Micro contracts help with the scale but not the shape of the problem:
- Micro gold (MGC, 10 oz) needs 0.32 contracts per ES, so one MGC fits about 3.10 ES contracts.
- Micro crude (MCL, 100 bbl) needs 4.79 contracts per ES, the one commodity leg that rounds sensibly.
- Micro Nasdaq (MNQ, $2 per point) needs about 5.5 contracts per ES.
- Against one Micro E-mini S&P (MES), gold needs 0.032 MGC and crude 0.479 MCL, so neither can be built at a single-micro size.
Rounding up to "one contract against one contract" is worse than no hedge. In this guide's 20-year study of Yahoo Finance daily bars, one gold contract against each ES contract raised daily dollar volatility by 70.3% instead of lowering it. Matching dollars, gold notional equal to ES notional, still raised volatility by 48.3%. One silver contract per ES raised it by 174.9%, and one crude contract by 37.3%. Even one NQ per ES, the closest substitute, cut volatility by only 5.6%, against 61.86% at the fitted ratio, because one NQ is worth about 1.48 times one ES.
The rule is to size the main position to the hedge, not the hedge to the main position. If the hedge cannot be built close to its ratio, it is not a hedge.
Related lesson: Mini and micro futures contracts
Risks and Costs of Hedging
Hedging reduces one risk and adds others. These are the costs and the hedging risk to check before placing any hedge.
- Direct cost. Options charge a premium that decays with time. Futures and forwards have no premium but carry spreads, commissions and margin on a second position.
- Lost upside. A futures or forward hedge gives up gains along with losses. In this guide's study of 20 years of Yahoo Finance daily ES and NQ bars, the NQ hedge gave up 103.81% of the gain on ES's best days.
Risks that remain inside a hedge
The hedging risk that stays behind after a hedge is placed comes from the relationship between the two legs.
- Basis risk. Cash and futures prices do not move exactly together, so even a direct hedge leaves a residual, as in the corn example where a basis move cost $7,500.
- Correlation drift. A cross-hedge depends on a relationship that changes. In this guide's study of 20 years of Yahoo Finance daily bars, the rolling 60-session correlation between ES and gold was below zero in 46.35% of windows and ranged from -0.64 to 0.66. Crude's fitted ratio fell from 0.174 in the first decade to 0.060 in the second. Carrying the first decade's crude ratio forward left 102.93% of the unhedged volatility, worse than no hedge.
Sizing, execution and behavior risks of hedging
The remaining risks come from how the hedge is sized, filled and used.
- Over-hedging. A hedge larger than its ratio becomes a new directional bet. In this guide's 20-year study of Yahoo Finance daily ES and gold bars, one gold contract per ES contract added 70.3% to volatility.
- Rounding and contract size. Whole contracts rarely match the ratio, and the error is itself an open position.
- Liquidity and execution. Two legs mean two fills. In a fast market the hedge leg may fill late or at a worse price.
- Rules and taxes. Funded-account programs often restrict opposing positions, and in some cases a stock hedge can have tax consequences. The Options Industry Council warns that a protective put may be treated as a sale for tax purposes in some situations.
- False comfort. A hedged position can feel safe enough to trade larger, which can leave total risk higher than before the hedge. If the hedge is the reason you added size, measure the combined position, not the story about it.
Hedging can lose money on both legs at once. If the main position falls and the hedge leg also moves against you, the losses add up, which happened to the gold leg in 4 of the 7 ES drawdowns in this guide's 20-year study of Yahoo Finance daily bars.
How to Hedge a Position Step by Step
These steps keep hedging risk in check whether the position is a stock portfolio, a business exposure or a futures trade. Order matters, because each step can end the process.
Deciding whether to hedge
The first three steps decide whether a hedge is the right tool at all.
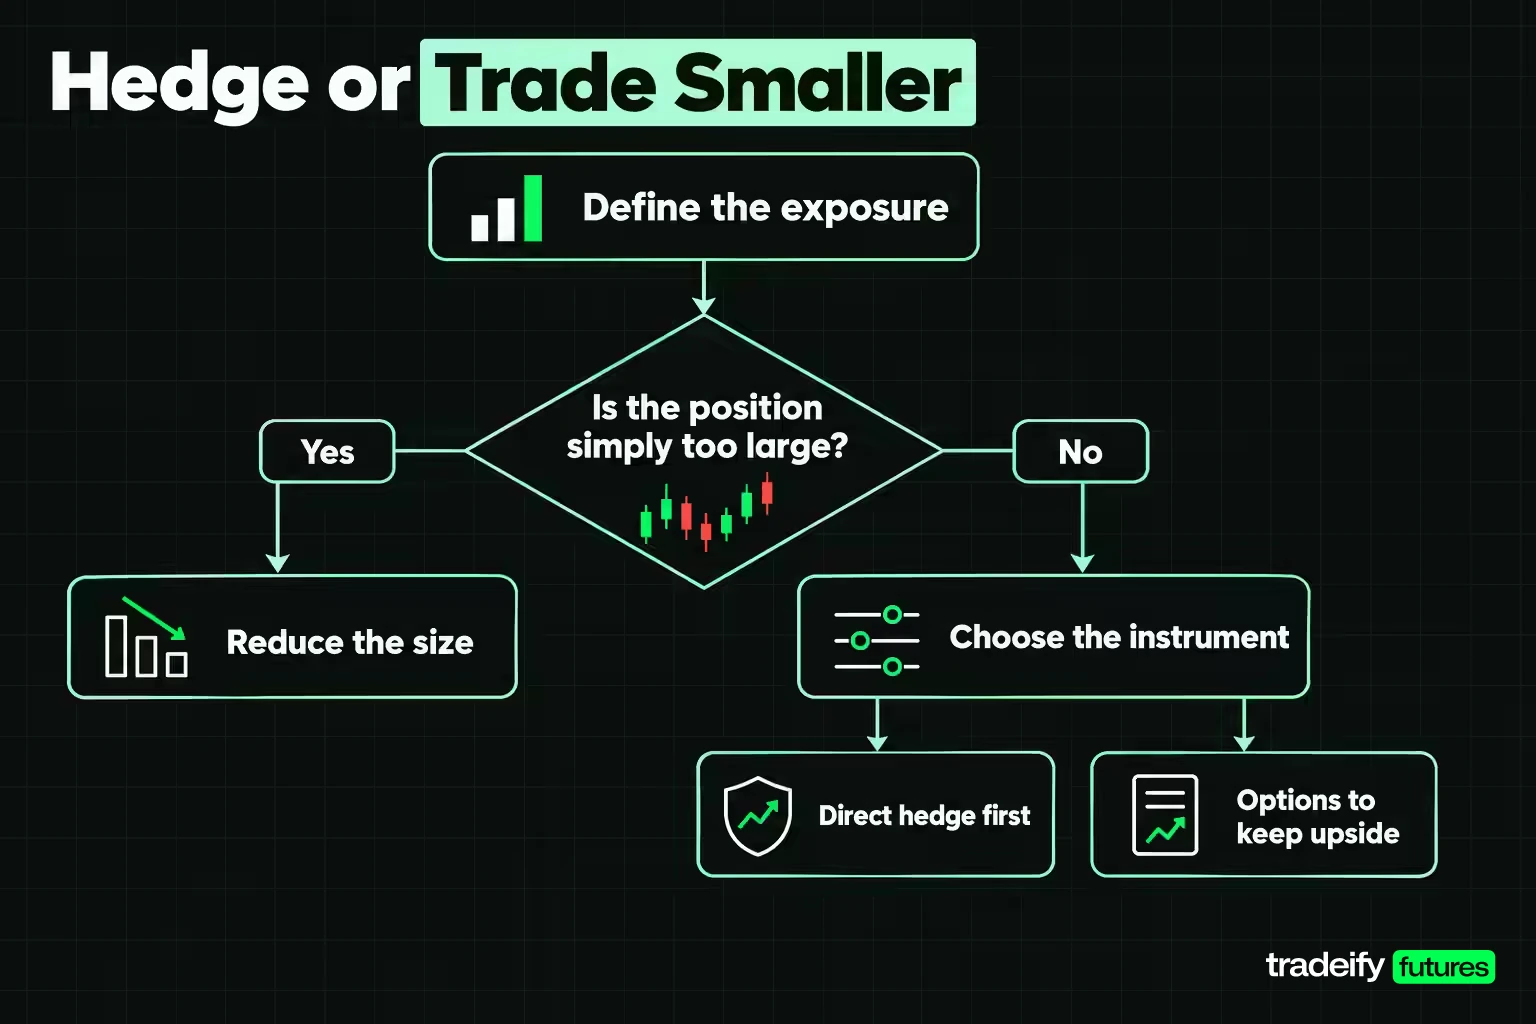
- Define the exposure. Write down what you hold, its value, and the specific risk you want to remove (market decline, currency move, input price rise). A hedge without a defined risk is just another trade.
- Decide whether to hedge at all. If the position is simply too large, reduce it. Trading smaller removes risk in proportion and costs nothing extra. Be honest here: a hedge placed to avoid closing a losing trade is usually a way to delay a decision, not to manage risk.
- Choose the instrument. Prefer a direct hedge in the same asset. Use a cross-hedge only when no direct hedge exists. Use options if keeping the upside matters more than the premium.
Sizing and testing the hedge
Once a hedge is chosen, size it from data and test it before placing it.
- Measure the correlation. Use returns over the timeframe you hold the position. If the correlation is weak, the hedge will remove little variance, because variance removed equals correlation squared.
- Compute the ratio and the contract count. Ratio = correlation x (position volatility / hedge volatility). Multiply by the position's value and divide by one hedge contract's value. If the result is far from a whole number of contracts or micros, the hedge is not available at your size.
- Compare with a size cut. Check whether the hedge beats a smaller position with the same volatility on the worst and best days, not just on average.
- Test it on past drawdowns. Run the hedge through the worst stretches in your data. A hedge that helped in one crisis and hurt in another is a bet on the type of crisis.
Running and exiting the hedge
A live hedge needs the same rules as any other position.
- Check the rules. Confirm your broker, program or account allows the hedge, and check any tax implications for stock hedges.
- Monitor and rebalance. Recheck the correlation and ratio on a schedule. Every rebalance is a new trade with new costs, so set the schedule before you start.
- Plan the exit. Decide when the hedge comes off: on a date, when the risk event passes, or when the main position closes.
Hedging Rules on Funded Futures Accounts
Hedging rules on funded futures accounts are often stricter than at a broker. Many proprietary trading programs restrict or ban opposing positions in the same or closely related instruments, both inside one account and across several accounts. The reason is that a hedged pair can hide real risk: one account books the gain while another takes the loss, and neither result shows trading skill. Before placing any two-leg position on an evaluation or funded account, read the program's current hedging and correlated-products rules.
On our accounts, hedging is prohibited: you cannot hold opposing positions on the same instrument or on two products from the same Product Group, in one account or across accounts. Long ES with short NQ is a violation because both are in the Equity Index group (ES, MES, NQ, MNQ, YM, MYM, RTY, M2K, EMD, NKD and the EUREX index futures), and mini and micro versions count as the same product. A long equity index position with a long volatility position (FVS) is also treated as offsetting. Our published rule lists long ES with short CL as allowed because they are in different Product Groups, but we may treat any position we judge to be offsetting as a hedge. All positions close by 4:45 PM ET, so nothing is carried overnight, and we do not offer options, so a protective put is not available on our accounts.
Hedging Risk FAQ
Is hedging risky?
Hedging reduces one risk but adds others. That hedging risk comes from basis moves, correlation drift, over-hedging and the cost of a second position. A badly sized or poorly correlated hedge can increase total risk. Hedging is safest when the hedge is a direct offset in the same asset.
What are the most common hedging strategies?
The most common are diversification, direct futures or forward hedges, cross-hedges with related instruments, and protective puts. Businesses also use natural hedges, matching costs and revenues in the same currency. Each trades cost against precision.
Does gold hedge stocks?
Not on a day-to-day basis, according to this guide's study of 20 years of Yahoo Finance daily ES and gold bars. Gold's daily correlation with ES was 0.032, and a correctly sized short gold leg lost money in 4 of 7 ES drawdowns of 10% or more. Gold can diversify a long-term portfolio, which is a different job.
Is hedging the same as diversification?
No. Diversification spreads money across assets that do not move together. A hedge is a specific position designed to offset a specific exposure. Diversification costs little but helps least in a crash, while a hedge targets the risk directly but carries its own costs.
Why not hedge one contract against one contract?
Because the hedge ratio, not convenience, sets the size. In this guide's 20-year study of Yahoo Finance daily bars, one gold contract per ES contract raised daily dollar volatility by 70.3% instead of lowering it. Contract values differ too much for one-for-one to make sense.
Can you hedge with micro futures?
Micros make hedges finer but do not fix weak correlation. Micro crude rounds well against ES, at roughly five contracts per ES. Micro gold needs about three ES contracts before a single MGC fits.
This article is educational and describes a study of historical price data, not a recommendation to trade any instrument or strategy. Futures and other leveraged products can produce losses larger than expected, and correlations between markets change without warning, so past hedge ratios do not predict future ones. Results ignore commissions, slippage and margin. Evaluation and funded accounts are simulated trading accounts. Nothing here is investment, tax or legal advice.


