



TL;DR: The RSI indicator measures how large recent up closes were against recent down closes, on a 0 to 100 scale. A reading of 70 means average gains run about 2.33 times average losses, which describes strength, not a top. On ten years of S&P 500 data, readings under 30 clustered in downtrends and readings over 70 in uptrends. Treat the RSI as context for a written rule, with the stop set from price structure.
The RSI indicator is usually the first oscillator a new trader adds to a chart, and the 70 and 30 lines are usually the first rule they trust. That trust is where the trouble starts. A short at 70 in a strong market can sit underwater for weeks, and a buy at 30 in a falling market can keep falling while the reading looks more and more "oversold."
This guide works the formula on real S&P 500 closes, translates each level into the imbalance it actually encodes, and measures how the RSI indicator behaved across ten years of daily data. By the end you should know what the number on your chart means, what it does not, and what would have to happen on price before it becomes a trade.
What the RSI Indicator Measures
The Relative Strength Index (RSI) is a momentum oscillator that J. Welles Wilder introduced in his 1978 book, New Concepts in Technical Trading Systems. It compares the average size of recent up closes with the average size of recent down closes and maps that comparison onto a scale from 0 to 100.
Wilder's default lookback was 14 periods, and most charting platforms still load the RSI indicator with 14 as the default length and the close as the source. A period is one bar of whatever timeframe you are viewing, so 14 periods means three weeks on a daily chart and 70 minutes on a five-minute chart.
The name causes real confusion. The RSI does not compare one market with another. A relative strength line that divides a stock by an index, or a relative strength rating that ranks one stock against all others, is a different tool with no 0 to 100 bounds. The RSI only compares an instrument with its own recent closes.
What the RSI indicator does, in one sentence, is tell you whether recent buying pressure or selling pressure has been larger, and by how much. It does that with a lag, because it is built from closes that have already happened.
How the RSI Indicator Is Calculated
The RSI calculation has two stages: build a smoothed average gain and average loss, then convert their ratio to a bounded number.
- Compare each close with the close before it. An up move is a gain, a down move is a loss, and losses are recorded as positive numbers.
- For the first reading, add up the gains and the losses over the last 14 bars and divide each total by 14.
- Divide the average gain by the average loss. The result is RS, the relative strength.
- Convert RS with the formula RSI = 100 minus 100 divided by (1 plus RS).
From the second reading on, Wilder did not recompute a plain average. He smoothed it: the new average gain equals the previous average gain times 13, plus the current gain, all divided by 14. The average loss is updated the same way. That smoothing is an exponential average with a weight of one over the period, so an old bar's influence fades gradually instead of dropping out on a fixed day.
The boundaries follow from the formula. If the average loss is zero, the RSI is 100. If the average gain is zero, the RSI is 0. When the two averages are equal, RS is 1 and the RSI is exactly 50.
A 14 Bar RSI Seed on Real S&P 500 Closes
This worked RSI example uses S&P 500 daily closes from September and October 2026. The close before the window was 7,706.03 on September 23.
| Date | Close | Change | Gain | Loss |
|---|---|---|---|---|
| Sep 24 | 7,704.13 | -1.90 | 0 | 1.90 |
| Sep 25 | 7,743.41 | 39.28 | 39.28 | 0 |
| Sep 28 | 7,683.69 | -59.72 | 0 | 59.72 |
| Sep 29 | 7,670.84 | -12.85 | 0 | 12.85 |
| Sep 30 | 7,651.54 | -19.30 | 0 | 19.30 |
| Oct 1 | 7,666.45 | 14.91 | 14.91 | 0 |
| Oct 2 | 7,722.72 | 56.27 | 56.27 | 0 |
| Oct 5 | 7,773.95 | 51.23 | 51.23 | 0 |
| Oct 6 | 7,818.93 | 44.98 | 44.98 | 0 |
| Oct 7 | 7,801.77 | -17.16 | 0 | 17.16 |
| Oct 8 | 7,765.36 | -36.41 | 0 | 36.41 |
| Oct 9 | 7,811.54 | 46.18 | 46.18 | 0 |
| Oct 12 | 7,807.24 | -4.30 | 0 | 4.30 |
| Oct 13 | 7,805.45 | -1.79 | 0 | 1.79 |
| Total | 7,805.45 | +99.42 | 252.85 | 153.43 |
Six closes were up and eight were down, yet the gains were larger. That is the first lesson of the RSI calculation: it weighs the size of moves, not the count of them.
The seed averages are 252.85 divided by 14, which is 18.0607, and 153.43 divided by 14, which is 10.9593. RS is 1.6480, and the RSI is 100 minus 100 divided by 2.6480, which gives 62.24.
Carrying the RSI Smoothing Forward
The next bar after the 14 bar seed shows Wilder's smoothing at work. On October 14 the index fell 86.51 points. The new average gain is 18.0607 times 13 divided by 14, or 16.7707. The new average loss is 10.9593 times 13, plus 86.51, divided by 14, or 16.3558. The RSI drops from 62.24 to 50.63 on one bar.
| Date | Close | Change | Average gain | Average loss | RSI |
|---|---|---|---|---|---|
| Oct 14 | 7,718.94 | -86.51 | 16.7707 | 16.3558 | 50.63 |
| Oct 16 | 7,659.44 | -84.62 | 16.1265 | 20.1470 | 44.46 |
| Oct 21 | 7,757.17 | 44.60 | 19.4732 | 16.1308 | 54.69 |
| Oct 23 | 7,623.68 | -39.75 | 16.7907 | 22.9654 | 42.23 |
| Oct 28 | 7,743.98 | 21.38 | 21.2802 | 18.3874 | 53.65 |
| Oct 30 | 7,580.07 | -140.32 | 18.3487 | 27.4419 | 40.07 |
| Nov 3 | 7,568.92 | 27.52 | 17.7868 | 26.2265 | 40.41 |
Through all of that, the reading never came close to 70 or 30. A month of real trading, including a 140.32 point down day, kept the RSI between 40 and 63. That is normal. It is also why a trader who only watches the extremes spends most sessions with nothing to do, and why the temptation to call 40 "nearly oversold" shows up so quickly.
Why Two Charts Show Different RSI Values
Because Wilder's smoothing never fully forgets an old bar, an RSI value depends on how much history came before it. An RSI indicator seeded fresh from the S&P 500 close of September 23, 2026 read 62.24 on October 13. The same calculation run on ten years of history read 59.20 on that day, a gap of 3.04 points.
The gap shrinks as bars accumulate. It was 1.15 one bar later, 0.81 after five bars and 0.58 after ten. Across 42 different start dates in the ten year sample, a freshly seeded RSI was off by an average of 7.03 points on its first reading, 3.41 points after 10 bars, 1.65 after 20 bars, 0.42 after 40 bars and 0.09 after 60 bars. By 100 bars the difference was effectively zero.
StockCharts states that it loads at least 250 data points before a chart's start date for this reason. So if your RSI value disagrees with a friend's, check four things before deciding either is wrong: the period, the smoothing method (some platforms offer a simple-average version, sometimes called Cutler's RSI), the data source and the amount of history loaded.
To check an RSI value on your own chart, open the platform's data window or hover over the RSI pane on the last closed bar. The value printed while a bar is still forming will change until that bar closes.
Related lesson: Moving averages SMA vs EMA
What RSI Overbought and Oversold Levels Mean

Wilder treated an RSI indicator reading above 70 as overbought and below 30 as oversold. Some traders use 80 and 20 for stronger extremes. Those numbers are easier to use once you translate them back into the ratio they stand for.
| RSI reading | Average gain divided by average loss | What it says in plain terms |
|---|---|---|
| 10 | 0.1111 | Losses outweigh gains about 9 to 1 |
| 20 | 0.2500 | Losses outweigh gains 4 to 1 |
| 30 | 0.4286 | Losses outweigh gains about 2.33 to 1 |
| 40 | 0.6667 | Losses outweigh gains 1.5 to 1 |
| 50 | 1.0000 | Gains and losses are equal |
| 60 | 1.5000 | Gains outweigh losses 1.5 to 1 |
| 70 | 2.3333 | Gains outweigh losses about 2.33 to 1 |
| 80 | 4.0000 | Gains outweigh losses 4 to 1 |
| 90 | 9.0000 | Gains outweigh losses about 9 to 1 |
The scale is a curve, not a ruler. Going from 60 to 70 moves the ratio from 1.5 to 2.33. Going from 70 to 80 moves it from 2.33 to 4. An RSI of 70 is not "twice as strong" as 35; it encodes a ratio about four times larger.
So what does oversold mean in RSI? It means the smoothed down moves have been at least about 2.33 times the size of the smoothed up moves. That is a description of what already happened. It says nothing about whether the selling is finished, which is why oversold and "about to bounce" are two different statements.
How Far One Bar Can Move the RSI
The closer the RSI indicator sits to a line, the less it takes to cross it. This table shows how big a single bar would have to be to push a 14 period RSI to 70 or 30, expressed as multiples of the current average gain or average loss.
| Current RSI | One up bar needed to reach 70 | One down bar needed to reach 30 |
|---|---|---|
| 40 | 32.50 times the average gain | 7.22 times the average loss |
| 45 | 24.07 times the average gain | 11.82 times the average loss |
| 50 | 17.33 times the average gain | 17.33 times the average loss |
| 55 | 11.82 times the average gain | 24.07 times the average loss |
| 60 | 7.22 times the average gain | 32.50 times the average loss |
| 65 | 3.33 times the average gain | 43.33 times the average loss |
| 68 | 1.27 times the average gain | 51.46 times the average loss |
From a balanced 50, one bar would have to be 17.33 times the average move to reach either line. From 68, a bar only 1.27 times the average gain clears 70. On the S&P 500 at the November 3, 2026 close, with the full-history RSI at 40.43, a single up day of about 584 points would have been needed to reach 70, while a down day of about 206 points would have reached 30. The RSI indicator was far closer to oversold than to overbought, even though the reading itself looked neutral.
Twelve Bars in One Direction
Run the one-sided case. Start at 50 with the average gain and average loss both equal to 10 points, then add up bars of exactly 10 points with no down bars. The RSI climbs to 51.85 after one bar, 60.94 after six, 69.32 after eleven and 70.87 after twelve. The mirror case, twelve straight down bars, lands at 29.13.
That is the practical meaning of an extreme reading. An RSI in the high 70s or 80s says one direction has dominated for a long stretch. It arrives after the move, not before it.
How Often RSI Readings Occur on the S&P 500
A single RSI value means little until you know how often that value occurs on your market. To find out, this guide computed the 14 period RSI indicator on S&P 500 daily closes published by the St. Louis Fed's FRED database (series SP500) from November 2016 to November 3, 2026, skipping the first 250 bars as warm-up. That left 2,261 measured bars, from November 3, 2017 to November 3, 2026.
| Sample | Bars | Above 70 | Below 30 | Above 50 | Between 40 and 60 |
|---|---|---|---|---|---|
| All bars | 2,261 | 8.9% | 1.8% | 69.8% | 50.2% |
| Close above its 200 day average | 1,827 | 10.8% | 0.5% | 77.9% | 47.9% |
| Close at or below its 200 day average | 434 | 0.7% | 7.4% | 35.7% | 59.7% |
Three readings stand out. First, the RSI sat between 40 and 60 on half of all bars, so a middle reading is the normal state, not a signal. Second, only 41 bars of 2,261 closed below 30, across 22 separate visits, and the longest run lasted five bars, from January 21 to January 27, 2022. Third, 201 bars closed above 70, so on this index overbought was roughly five times more common than oversold. A long-rising index produces that kind of asymmetry, and a different market will produce its own.
The lowest reading in the sample was 17.66 on October 11, 2018. The highest was 86.69 on January 26, 2018.
The 18 Bar Overbought Stretch
The longest run above 70 lasted 18 bars, from January 3 to January 29, 2018. Over those bars the index rose from 2,713.06 to 2,853.53, a gain of 5.2%, and the RSI peaked at 86.69 on January 26 with the index at 2,872.87.
A trader who sold the first overbought print on January 3 would have been fighting a rising market for nearly four weeks, and the pressure to add to that short or move its stop grows with every higher close. The decline did come, but after the stretch ended. From the January 26 close the index fell to 2,581.00 on February 8, a drop of 10.2%, and the RSI printed 28.12 that day.
Both parts matter. The overbought reading was a real warning about an extended market, and it was early by weeks. Being right about "too far, too fast" and having a valid entry are two separate decisions.
Using RSI Bull and Bear Ranges to Confirm the Trend
A regime split of this guide's ten year S&P 500 calculation (FRED daily closes) shows something the 70 and 30 lines hide. When the S&P 500 closed above its 200 day average, the RSI printed above 70 on 10.8% of bars and below 30 on 0.5%. When it closed at or below that average, those figures flipped to 0.7% and 7.4%. Readings above 70 were about 15 times more common in the uptrend sample than in the downtrend one, and readings below 30 were about 15 times more common in the downtrend sample.
Constance Brown's work, summarized by StockCharts, turns that pattern into a trend tool. In an uptrend, she described the RSI fluctuating between roughly 40 and 90, with the 40 to 50 zone acting as support. In a downtrend, it tends to move between roughly 10 and 60, with the 50 to 60 zone acting as resistance. The ranges shift with the RSI period, trend strength and volatility, so treat them as zones rather than lines.
That gives you a practical trend read:
- RSI pullbacks that hold above about 40 and turn back up suggest the uptrend's momentum is intact.
- RSI rallies that stall near 50 to 60 and turn down suggest the downtrend is intact.
- A "range shift," where pullbacks start breaking below 40 or rallies start clearing 60, is an early sign that the trend's character is changing. Confirm it on price before acting.
In this framework, an overbought RSI in an uptrend is evidence the trend is strong, not a reason to short it. The same reading inside a downtrend, where it occurred on only 0.7% of bars, is rarer and deserves more attention.
Related lesson: Multiple timeframe analysis
The RSI 50 Centerline Crossover
The 50 line is the only RSI indicator level with a structural meaning: it is where the average gain equals the average loss. Above 50, smoothed gains are larger. Below 50, smoothed losses are larger.
A centerline crossover happens when the RSI moves from one side of 50 to the other. Traders use an upward cross as confirmation of bullish momentum and a downward cross as confirmation of bearish momentum.
The catch is frequency. In this guide's calculation on ten years of FRED S&P 500 daily closes, the 14 period RSI crossed 50 on 229 occasions in 2,261 bars, about once every 10 bars. Twenty bars after an upward cross, the index was higher in 67.6% of cases, with a mean move of 0.92%. Twenty bars after a downward cross, it was still higher in 66.7% of cases, mean 0.55%. Across every bar in the sample, the index was higher 20 bars later in 67.9% of cases, mean 1.09%.
In other words, on a rising index, neither cross on its own told you much that the long-run drift did not. The 50 line works better as a filter (only take longs while the RSI holds above 50, for example) than as a trigger.
RSI Divergence and Failure Swings
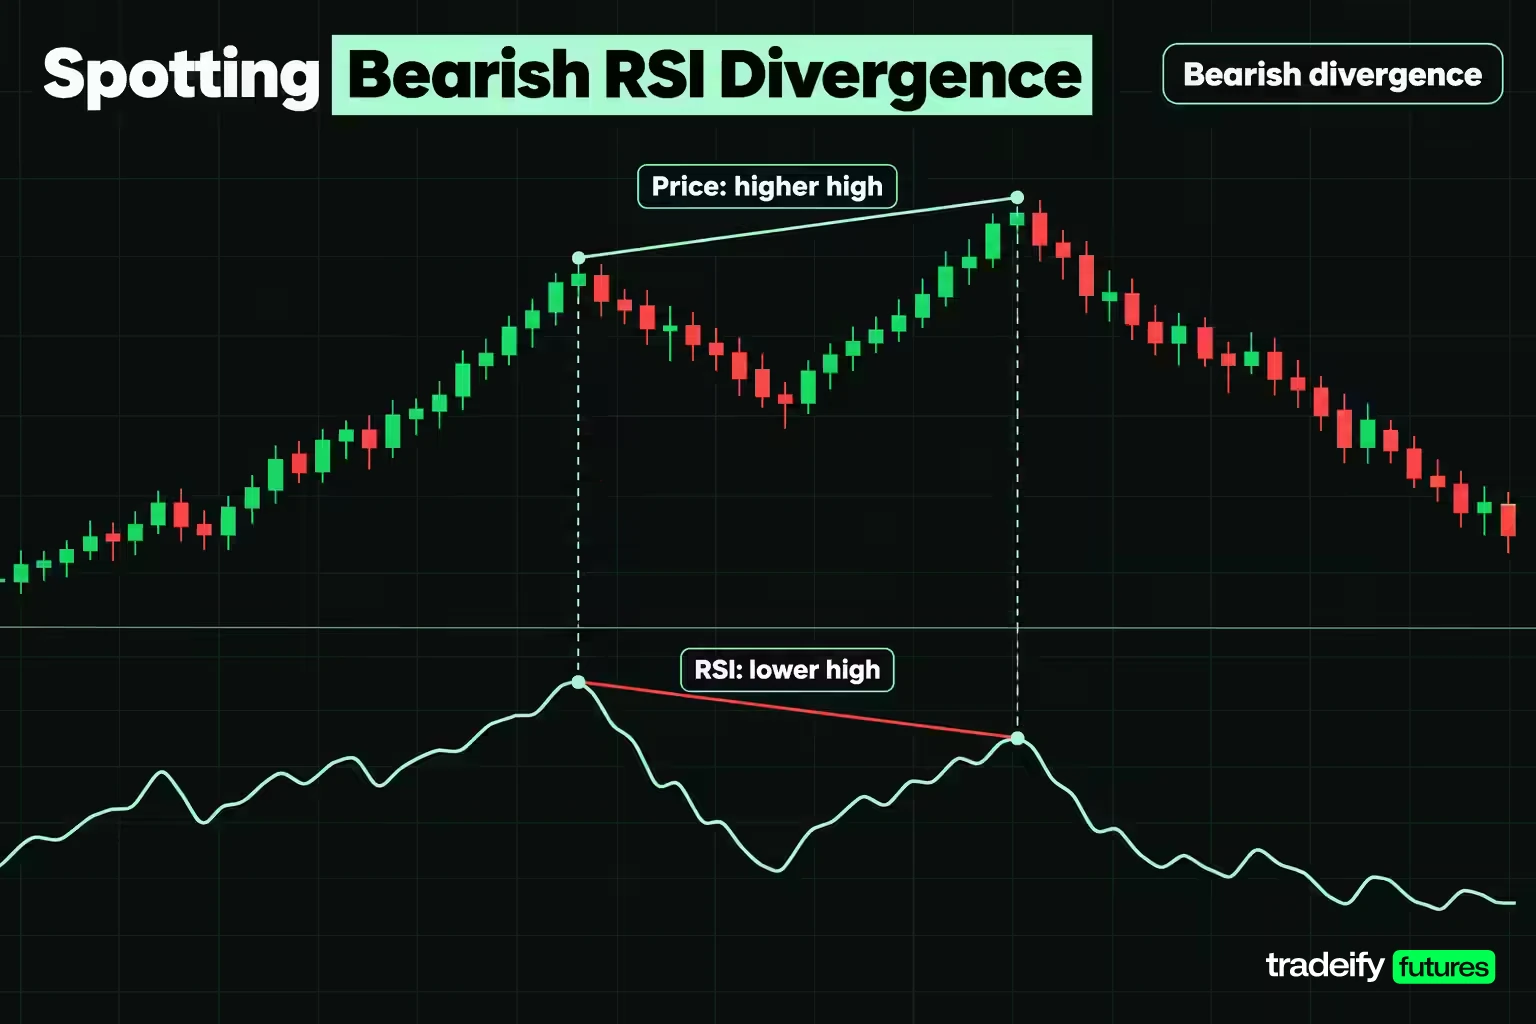
Divergence is when price and the RSI indicator disagree. A bearish divergence forms when price makes a higher high while the RSI makes a lower high, suggesting upward momentum is fading. A bullish divergence forms when price makes a lower low while the RSI makes a higher low.
Hidden divergence runs the other way and is read as continuation. Andrew Cardwell, Constance Brown's RSI mentor, called these positive and negative reversals. A positive reversal forms when the RSI makes a lower low while price makes a higher low, usually with the RSI between 30 and 50, and it tends to appear in uptrends.
StockCharts adds an important warning: divergences are misleading in a strong trend. A strong uptrend can print several bearish divergences before any top.
Testing an RSI Divergence Rule
"Higher high" sounds precise until you ask which highs count. A two bar pivot and a ten bar pivot will find different divergences on the same chart. So here is one rule stated in full, tested by this guide on ten years of FRED S&P 500 daily closes:
- A pivot high is a close above the five closes on each side; a pivot low is a close below them.
- Two consecutive pivots must be 5 to 60 bars apart.
- A divergence only counts on the confirmation bar, five bars after the second pivot, because that is when the pivot becomes knowable.
| Signal | Count | Moved the expected way 20 bars later | Mean move 20 bars later |
|---|---|---|---|
| Bearish divergence | 29 | 24.1% lower | +1.00% |
| Bullish divergence | 10 | 70.0% higher | +1.98% |
| Every bar in the sample | 2,241 | 67.9% higher | +1.09% |
The bearish result is the uncomfortable one. Of the 29 bearish divergences this test found in the FRED S&P 500 data, only 24.1% were followed by a lower price 20 bars later. The bullish group looks better, but 10 signals is far too small a sample to separate from the index's normal upward drift. Neither result says divergence is useless; it says a divergence label is not a trade until you define it and test it on your own market.
One more practical point: many divergence scripts draw the label on the pivot bar, which is five bars older than the moment you could have known about it. Always check the confirmation date.
RSI Failure Swings
Wilder considered failure swings a strong sign of a reversal, and they rely on the RSI line alone. A bullish failure swing forms when the RSI drops below 30, bounces above 30, pulls back but holds above 30, then breaks above its prior bounce high. A bearish failure swing is the mirror: the RSI rises above 70, pulls back, rallies but fails to get back above 70, then breaks below its prior pullback low.
Because a failure swing needs a trip below 30 or above 70 first, it is rarer than either extreme on its own. On the S&P 500 sample, the RSI visited the zone below 30 only 22 times in nine years, so a bullish failure swing on a daily chart of that index is an occasional event, not a weekly setup.
Choosing RSI Settings and Periods
Fourteen is the RSI indicator's default, not an optimum. Changing the period changes how often the levels fire, which changes how many decisions you make.
| RSI period | Bars above 70 | Bars below 30 | Crossings of 70 or 30 |
|---|---|---|---|
| 7 | 22.4% | 7.2% | 210 |
| 9 | 17.2% | 4.2% | 157 |
| 14 | 8.9% | 1.8% | 83 |
| 21 | 3.6% | 0.5% | 34 |
| 28 | 1.3% | 0.1% | 12 |
On the same 2,261 S&P 500 bars, a 7 period RSI crossed into an extreme 210 times, the 14 period RSI 83 times and the 28 period RSI only 12 times. A shorter RSI period is not a "more sensitive" version of the same tool. It is a different event generator, with more signals of lower average quality.
Practical rules for RSI settings:
- Match the period to how long you plan to hold. Fourteen daily bars is about three weeks; fourteen five-minute bars is 70 minutes.
- If you shorten the period, widen the thresholds. Traders who use a 7 or 9 period RSI often move to 80 and 20, because 70 and 30 fire so often.
- If you lengthen it, consider tightening the thresholds toward 60 and 40.
- Decide the period and thresholds before you look at the chart. Moving 70 to 80 after a losing short is a reaction, not a setting.
Related lesson: Momentum trading
RSI Trading Strategies With Written Rules
An RSI indicator strategy needs four parts written down: the market context it applies to, the trigger, the confirmation on price and the invalidation. Here are three common RSI trading strategies in that form. They are illustrations of structure, not recommendations.
RSI Range Fade
- Context: price is moving sideways between clear support and resistance. StockCharts notes that overbought and oversold readings work best in ranges.
- Trigger: the RSI drops below 30 near range support (or rises above 70 near resistance).
- Confirmation: the RSI turns back above 30 and price closes back inside the range, away from support.
- Invalidation: a close beyond the range boundary. The stop goes beyond the structure, not at an RSI level.
RSI Trend Pullback
- Context: price is above a rising longer moving average, and the RSI has been holding the 40 to 50 zone on pullbacks.
- Trigger: a pullback takes the RSI into the 40 to 50 zone while price holds above its prior swing low.
- Confirmation: the RSI turns up and price closes above the pullback's high.
- Invalidation: price breaks the prior swing low, or the RSI breaks clearly below 40, which suggests a range shift.
RSI Failure Swing Entry
- Context: a bullish failure swing after a decline, or a bearish one after an advance.
- Trigger: the RSI breaks its prior bounce high (bullish) or prior pullback low (bearish).
- Confirmation: price breaks a nearby swing level in the same direction.
- Invalidation: the RSI returns below 30 (bullish case) or above 70 (bearish case).
S&P 500 Results After RSI 30 and 70 Signals
This guide's event study on ten years of FRED S&P 500 daily closes (November 2017 to November 2026) shows why the confirmation step exists. The table measures the index 20 bars after each RSI event.
| Event on the 14 period RSI | Events | Index higher 20 bars later | Mean move 20 bars later |
|---|---|---|---|
| First close below 30 | 22 | 68.2% | +2.67% |
| First close back above 30 | 22 | 59.1% | +1.22% |
| First close above 70 | 61 | 68.9% | +1.42% |
| First close back below 70 | 62 | 72.6% | +1.24% |
| Every bar (baseline) | 2,241 | 67.9% | +1.09% |
In that FRED S&P 500 calculation, buying the first close below 30 produced the best mean, +2.67%, but the path was rough. On average, the worst close in the 20 bars after the signal was 4.51% below the entry close, 8 of the 22 signals (36.4%) saw a close more than 3% lower, and the worst case, February 25, 2020, saw a close 28.48% lower. Selling the first close above 70, meanwhile, would have meant shorting a market that was higher 20 bars later in 68.9% of cases.
The takeaway is not "buy 30." The first close below 30 is an observation; the turn back above it, with price confirming, is the closest thing to a signal. With 22 events, the sample is small, and the rough path is exactly what a stop and a position size have to survive. Test any RSI strategy on the market and timeframe you actually trade, with costs, before trusting it.
Combining the RSI Indicator With Other Tools
The RSI indicator measures one thing: the balance of recent gains and losses. Pairing it with a tool that measures something else adds information. Pairing it with another momentum oscillator mostly repeats it.
| Tool | What it adds to the RSI | Typical pairing |
|---|---|---|
| Moving average (for example the 200 day) | Trend direction | Only trade RSI signals in the trend's direction |
| MACD (12, 26, 9) | Trend momentum from two exponential averages, unbounded | MACD for direction, RSI for stretch |
| Bollinger Bands (20 period, 2 standard deviations) | Volatility and price location | RSI extreme plus a close outside the band, then a close back inside |
| Stochastic oscillator (14 period) | Close location within the recent high-low range | Similar job to RSI; use one, not both, as a trigger |
| Support and resistance | Where the decision is | RSI signal only at a pre-marked level |
Is RSI better than MACD? Neither is better; they answer different questions. The RSI is bounded between 0 and 100, so its levels mean the same thing on any market. The MACD is the difference between a 12 period and 26 period exponential moving average, with a 9 period signal line. Because it is unbounded, StockCharts notes it is not particularly useful for identifying overbought and oversold levels, but it is well suited to showing trend direction and momentum shifts. Many traders use the MACD for direction and the RSI for timing.
The trap with combinations is false confirmation. Two momentum oscillators agreeing is closer to one signal counted twice than two independent signals.
Related lesson: MACD indicator
Risk Management for RSI Trades
The RSI indicator says nothing about where your stop belongs. Place the stop where the trade idea is wrong on price, usually beyond the swing high or low that formed the setup, and size the position from that distance.
Here is the arithmetic with illustrative, round numbers on the Micro E-mini S&P 500 (MES), which is worth $5 per index point. Imagine a trader buys a bullish RSI setup at 6,000 with a stop at 5,970, below the swing low. The risk is 30 points, or $150 per MES contract. If the trader's plan allows $300 of risk on the trade, that is two MES contracts. If the nearest logical stop were 60 points away, the same $300 would cover only one contract.
This guide's RSI event study on FRED S&P 500 closes gives a second reason to size conservatively. After the first close below 30 in that data, the average worst close over the next 20 bars was 4.51% below the signal close. An oversold reading does not shrink the distance price can still travel against you.
Three rules help:
- Never move the stop because the RSI is "too oversold to go lower." It can go lower, and in February and March 2020 it did, more than once.
- Keep the same risk per trade on every RSI signal, so one large loss does not decide your month.
- Track every RSI trade in a journal with the reading, the trend filter and the outcome, so the sample tells you whether the rule works.
RSI Platforms and Intraday Holding Rules
On our accounts, the RSI is available on the charting platforms we support, including Tradovate, TradingView through the Tradovate connection, NinjaTrader, WealthCharts, Quantower and Sierra Chart. WealthCharts also has a Chart Replay feature for practicing RSI reads on historical data. All positions on our accounts must be closed by 4:45 PM ET, with no overnight holds, so a daily-chart RSI setup that needs several sessions to play out cannot be held there; the daily RSI works as context for intraday entries instead. Our evaluation and funded accounts are simulated.
Related lesson: Average true range ATR
RSI Limitations and Common Mistakes
The RSI indicator is useful, and it has clear limits that every trader using it should know:
- It lags. It is built from closes that already happened, so it confirms rather than predicts.
- It stays extreme in strong trends. The S&P 500 held above 70 for 18 straight bars in January 2018 while rising 5.2%.
- Its values depend on settings and history length, so two charts can disagree by several points on a fresh seed.
- It ignores volume, gaps between sessions beyond the close-to-close change, and anything outside the instrument itself.
- Its signal frequency depends heavily on the period, which makes results from one setting a poor guide to another.
| Common mistake | What the numbers say | What to check first |
|---|---|---|
| Buying because the RSI is under 30 | Readings under 30 hit 7.4% of downtrend bars and 0.5% of uptrend bars | Is price above or below its longer trend average, and is the RSI still falling? |
| Shorting because the RSI is over 70 | One stretch stayed above 70 for 18 bars while the index rose 5.2% | Is the RSI still rising, which reads as strength? |
| Trading a divergence label on sight | A confirmed 5 bar pivot is already 5 bars old | The confirmation date, not the pivot date |
| Treating 70 as twice 35 | 70 encodes a ratio of 2.33; 35 encodes about 0.54 | The ratio the reading stands for |
| Comparing readings across platforms | A fresh seed was off by 7.03 points on average on its first bar | Period, smoothing, data source and history loaded |
The figures in that table come from this guide's calculation on FRED S&P 500 daily closes. Every row treats one number as a complete signal. The RSI provides a measurement. It only becomes a decision when it is combined with trend, location and a rule you wrote down before the bar closed. A useful next step is to pull up your own market, mark every close below 30 and above 70 over the last year, and note what price did over the next 20 bars before you trade either line.
RSI Indicator FAQ
What does an RSI indicator do?
The RSI indicator measures momentum by comparing the average size of recent up closes with recent down closes. It turns that ratio into a reading between 0 and 100. Above 50 means smoothed gains have been larger, and below 50 means smoothed losses have been larger.
How do you check the RSI value?
Add the RSI indicator to your chart and read its value on the last closed bar, using the data window or by hovering over the RSI pane. The value on a bar that is still forming will keep changing until it closes. If two platforms disagree, compare the period, smoothing method and amount of history loaded.
What does oversold mean in RSI?
Oversold means the RSI is below 30, so smoothed losses have been at least about 2.33 times smoothed gains. It describes strong recent selling, not a guaranteed bounce. In downtrends, oversold readings are more common and can persist.
Is RSI better than MACD?
Neither is better; they measure different things. The RSI is bounded from 0 to 100 and suits reading stretch and momentum balance. The MACD is unbounded and suits reading trend direction, so many traders use both together.
What is the best RSI setting?
There is no single best RSI setting, but 14 periods is the standard starting point. It is Wilder's default and the setting the 70 and 30 lines were built around. Shorter periods produce far more signals, and longer periods far fewer. The best setting is the one you have tested on your market and holding time.
Is an RSI of 70 a sell signal?
Not on its own. A reading of 70 says gains have outweighed losses about 2.33 to 1, which in an uptrend is often a sign of strength. A sell decision needs price confirmation and a defined stop.
What timeframe works best for the RSI indicator?
Use the timeframe that matches your holding period, since 14 bars is a different length of time on each chart. Many traders read a higher timeframe RSI for context and a lower one for timing. The formula is identical, but the signal frequency is not.
RSI Trading Risk
This RSI indicator guide is for education only and is not investment advice or a recommendation to trade any instrument. The S&P 500 figures describe what one index did over one historical period, with no trading costs or slippage, and they do not predict future results. Futures trading uses leverage, and losses can exceed what you expect from a single trade. Evaluation and funded prop accounts are simulated, and results there may differ from live markets.


