



TL;DR: Mean reversion trading buys a stretch below an average and sells one above it, so the real decision is how far price sits from the mean. On ten years of ES and NQ daily bars, distance in ATR tracked the odds of a return better than the stretch reading did. Bigger stretches reached the mean less often, and heat taken before the target decided most trades. Use an ATR-sized stop, a time limit and a no-signal benchmark before trusting any mean reversion rule.
Price drops hard, closes under the lower Bollinger Band, and the chart seems to be asking you to buy. That is the mean reversion instinct: a price pushed unusually far from its recent average tends to drift back toward it. The idea is easy to state. The decision is harder, because the chart does not tell you how often price actually gets back to the mean, how far it goes against you first, or how much stop that demands.
This guide puts numbers on those three questions. It explains the theory and the indicators, then runs one plain rule on 2,514 daily bars each of E-mini S&P 500 (ES) and E-mini Nasdaq-100 (NQ) futures, from November 7, 2016 to November 4, 2026, plus a 5-minute check on the last 10 weeks. Every figure below comes from that study, and the method is stated with each table so you can rebuild it.
What Mean Reversion Trading Is
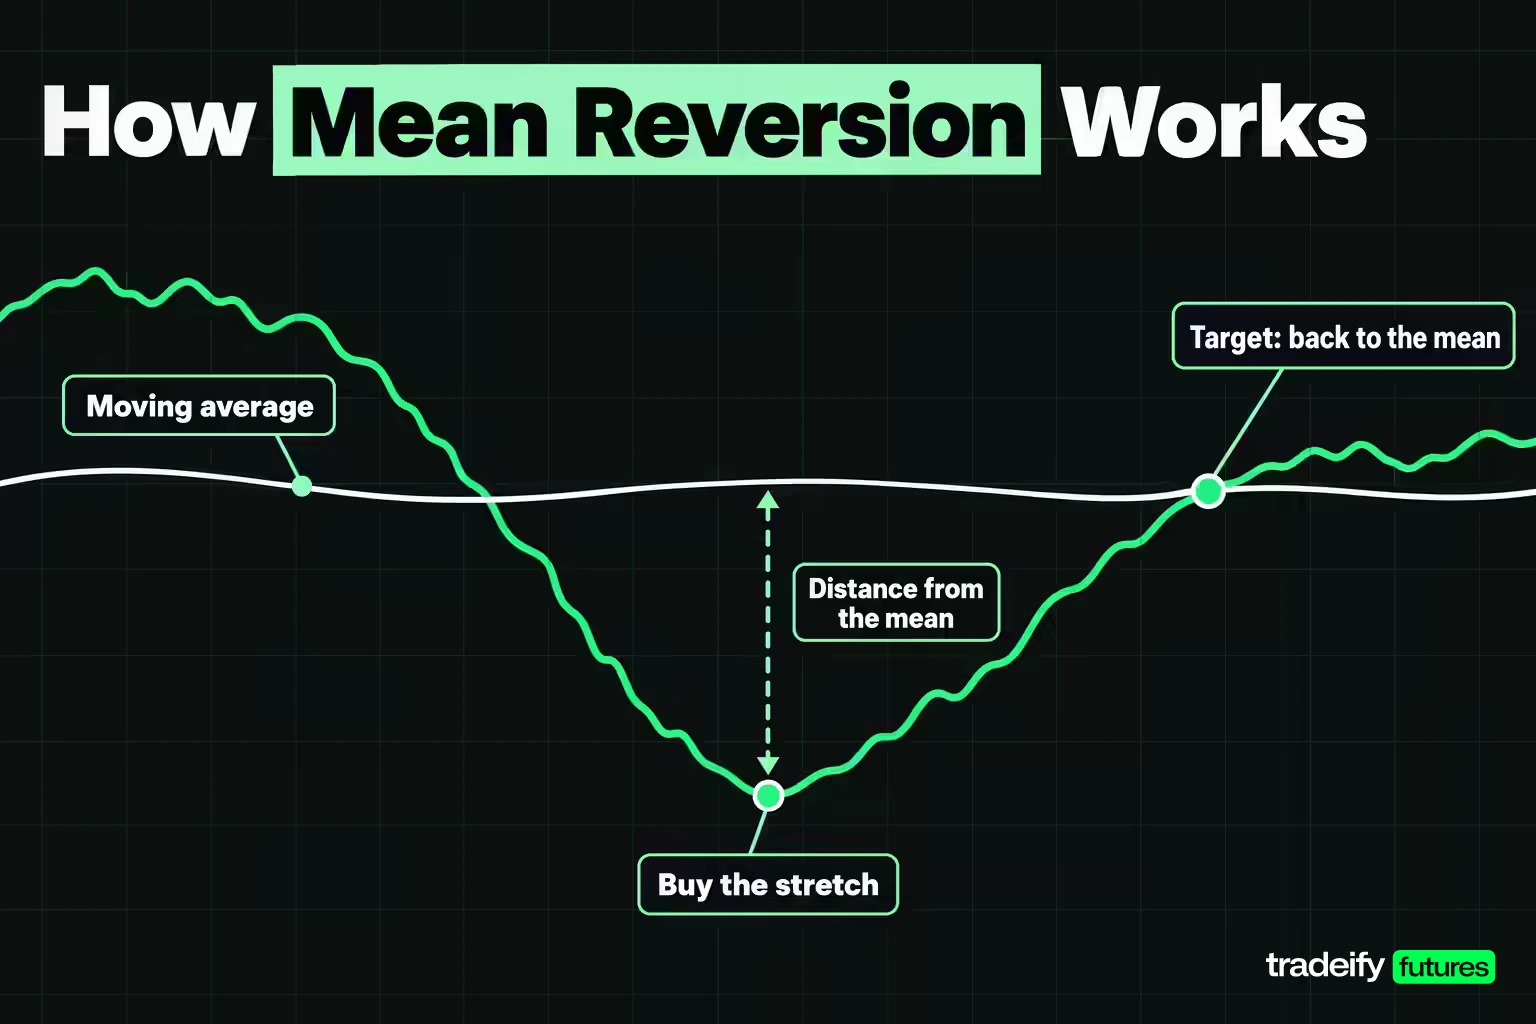
Mean reversion trading is a style that measures how far price has moved from an average, waits until that distance is unusually large, and takes the position that profits if price moves back. A long trade buys weakness below the mean. A short trade sells strength above it. The trader is betting on the return trip, not on a new trend.
The definition hides three choices, and each one changes the trade.
- Which mean. A 10-day, 20-day and 50-day average are three different targets. A shorter mean sits closer to price, so it is easier to reach and pays less.
- How stretched. "Stretched" can mean a distance in points, in average true range (ATR), in standard deviations (a z-score) or an oscillator reading such as RSI.
- What invalidates it. A fixed stop, a stop beyond a swing low, or a time limit. Without one, a mean reversion trade quietly becomes a hope that the trend ends.
Why would prices revert at all? Short-term moves often overshoot because of forced selling, stop runs, news reactions and thin liquidity. When that pressure fades, buyers who think the price is cheap and short sellers taking profits pull it back toward where it traded recently. The pull is real but conditional. When the reason for the move is new information that changes value, the "mean" simply moves to meet price, and the trade that bet on a return loses.
Related lesson: Moving averages SMA vs EMA
The Statistics Behind Mean Reversion
Mean reversion has a precise statistical meaning, and it is worth knowing because it explains why some reversion trades work and others never can. A series is mean-reverting when deviations from its average tend to shrink over time. Statisticians call a series with a stable mean and stable spread "stationary." A stationary series keeps returning to the same neighbourhood. A non-stationary one, like a random walk, has no anchor and can wander away indefinitely.
The textbook model is the Ornstein-Uhlenbeck process. It adds a restoring pull toward a long-term mean to a random walk, and the pull is stronger the further the series is from the center. Its discrete-time cousin is an AR(1) model, where today's deviation is a fraction of yesterday's plus noise.
That model gives a useful number called the half-life. You regress the daily change in a series on its previous level. If the slope is negative, the half-life is roughly ln(2) divided by the size of that slope, and it tells you how many periods it usually takes for a deviation to shrink by half. A half-life of five sessions is something a short-term trader can work with. A half-life of two years is not a trade, even if it is technically reverting.
Why mean reversion works on stretches, not price levels
Stock index futures prices are not stationary. ES closed at 2,129.00 on November 7, 2016 and at 7,720.50 on November 4, 2026, so there is no fixed level for it to revert to. What traders actually trade is the distance between price and a moving average, which resets as the average follows price. That distance behaves far more like a stationary series, which is why indicator-based mean reversion can work on assets that trend over years.
The catch is that the moving average is chasing price. If price keeps falling, the mean falls to meet it, and a "return to the mean" can happen without any recovery at all. That is why the study in this guide fixes the target at the mean's value on the entry day. A target that moves toward you is easier to hit and tells you less.
Mean Reversion Indicators and the Distance They Imply
Most mean reversion indicators answer the same question in different units: how unusual is today's price relative to its recent history?
- Bollinger Bands plot a 20-period simple moving average with bands two standard deviations above and below it by default. A close outside the lower band is the classic oversold signal.
- Z-score is the same idea as a single number: price minus the mean, divided by the standard deviation. A z-score of -2 is a close at the lower Bollinger Band.
- RSI (Relative Strength Index), developed by J. Welles Wilder and published in his 1978 book New Concepts in Technical Trading Systems, oscillates from 0 to 100. The default is 14 periods, with 30 as the usual oversold line. Short-term traders also use a 2-period RSI with readings below 10.
- ATR distance measures the gap between price and the mean in average true ranges, which turns the stretch into "how many ordinary days of movement away" price is.
- VWAP (volume-weighted average price) is the intraday mean many futures traders watch, because it resets each session.
Mean reversion indicators tested on ES and NQ
The useful test is to put mean reversion triggers side by side against the same target. The table below, this guide's calculation on Yahoo Finance continuous futures data for November 2016 to November 2026, takes each trigger the first time it appears, below the 20-day mean, and checks whether price reached that day's 20-day mean within the next 20 sessions.
| Trigger on daily ES and NQ bars | ES setups | ES reached mean | NQ setups | NQ reached mean | Median distance in ATR (ES and NQ) |
|---|---|---|---|---|---|
| RSI(2) below 10 | 101 | 74.3% | 100 | 72.0% | 1.44 and 1.32 |
| z-score at or below -2 | 68 | 52.9% | 70 | 57.1% | 2.21 and 2.07 |
| Close 2 ATR or more below the mean | 53 | 52.8% | 54 | 53.7% | 2.37 and 2.38 |
| RSI(14) below 30 | 18 | 38.9% | 14 | 50.0% | 3.47 and 3.44 |
Read the last column first. In that ES and NQ test, the triggers line up almost perfectly by distance. RSI(2) fires close to the mean and reaches it about three times in four. RSI(14) below 30 fires rarely, when price is about three and a half ATR away, and reaches the mean far less often on ES. The indicator is not doing the work. The distance it implies is.
That suggests a practical habit. Use whichever indicator you like to define the trigger, then convert the setup into a distance in ATR before you decide whether the trade is worth taking.
Related lesson: Relative strength index RSI
Mean Reversion Entry Rules Measured on ES and NQ
Entry rules for mean reversion usually come down to a threshold: buy when the z-score drops below some number. The obvious assumption is that a bigger stretch is a better trade. The data on ES and NQ says the opposite.
The study method is the same throughout this guide. Daily continuous ES and NQ futures closes, a 20-day simple moving average, the population standard deviation of the same 20 closes, and a 14-session Wilder ATR. A setup is the first close at or beyond the threshold. The target is the 20-day mean on the entry day, held fixed. "Reached" means a later session's high touched that target within 20 sessions. Entries ran from August 25, 2017 to October 7, 2026, about 9.12 years, and the ranges in brackets are 95% confidence intervals.
How often a stretch reaches the mean
| Stretch below the 20-day mean | ES setups a year | ES reached mean (interval) | NQ setups a year | NQ reached mean (interval) |
|---|---|---|---|---|
| 1.0 standard deviation | 11.08 | 75.2% (66.0% to 82.6%) | 13.05 | 71.4% (62.7% to 78.8%) |
| 1.5 standard deviations | 10.20 | 67.7% (57.7% to 76.4%) | 10.97 | 64.0% (54.2% to 72.7%) |
| 2.0 standard deviations | 7.46 | 52.9% (41.2% to 64.3%) | 7.68 | 57.1% (45.5% to 68.1%) |
| 2.5 standard deviations | 2.74 | 52.0% (33.5% to 70.0%) | 2.41 | 50.0% (30.7% to 69.3%) |
In this Yahoo Finance ES and NQ study, the hit rate falls as the stretch widens. A one standard deviation stretch on ES reached the mean 75.2% of the time; a two standard deviation stretch, 52.9%. The extreme reading also arrives less often: about 7.5 two-sigma setups a year on ES against about 11 at one sigma. Waiting for the dramatic reading buys a worse hit rate and fewer chances.
The reason is distance. The median one-sigma setup on ES sat 1.27 ATR below the mean. The median two-sigma setup sat 2.21 ATR below it. A bigger stretch is mostly a longer trip, and a longer trip fails more often.
The short side was weaker in the same study. Two standard deviations above the mean reached it 45.3% of the time on ES and 42.5% on NQ, which fits two indices that rose strongly over the decade.
Distance in ATR versus the stretch reading
A stretched z-score and a large distance from the mean are not the same thing. When volatility is high, price can be far below the mean in ATR terms without registering two standard deviations. When volatility is calm, a two-sigma stretch can be only a short distance away.
To separate them, the next table (this guide's calculation on Yahoo Finance continuous futures data) takes every session that closed below its 20-day mean and splits it by both conditions. These are overlapping daily observations, so treat them as a description of the sample, not as independent trades.
| Close below the 20-day mean | ES sessions | ES reached mean | NQ sessions | NQ reached mean |
|---|---|---|---|---|
| Under 2 ATR away, no 2-sigma stretch | 544 | 86.9% | 599 | 83.3% |
| Under 2 ATR away, with 2-sigma stretch | 31 | 77.4% | 36 | 72.2% |
| 2 ATR or more away, no 2-sigma stretch | 64 | 46.9% | 58 | 44.8% |
| 2 ATR or more away, with 2-sigma stretch | 85 | 43.5% | 72 | 45.8% |
In this guide's ES and NQ calculation, distance splits the table cleanly: 72.2% to 86.9% under 2 ATR, 43.5% to 46.9% beyond it. The stretch reading adds nothing on top. At the same distance, sessions with a two-sigma stretch reached the mean no more often than those without one. If your entry rule is only a z-score, you are selecting on a reading that does not move the odds once distance is known.
Mean reversion entry conditions beyond the threshold
A threshold tells you when a mean reversion setup exists. The entry condition decides exactly where and when you get in, and it changes which setups you end up holding.
- Close entry. Buy at the close of the bar that crosses the threshold. This is the simplest rule and the one tested in this guide's ES and NQ study. You get every setup, including the ones still falling hard.
- Confirmation entry. Wait for evidence the push has stalled, such as a close back inside the lower Bollinger Band or a close above the prior bar's high. You give up some distance to the mean in exchange for skipping some of the setups that keep running.
- Deeper limit entry. Rest a buy order further below the threshold. You get a bigger target when it fills, but it only fills on the setups that kept falling, which are the ones with the worst odds of returning.
- Filters. Take long mean reversion entries only above a long average such as the 200-day, only when ATR is not expanding, or only near a support level that has held before.
- Skip rules. Stand aside when the stretch comes from new information about value, such as a policy decision or an earnings reset, or right before a scheduled data release that can extend the move.
Written out, a complete mean reversion entry rule reads like this: "Buy the first daily close at least 1.5 standard deviations below the 20-day mean, only when price is above its 200-day mean and the distance to the 20-day mean is under 2 ATR." Every part of that sentence can be tested, and every part can be wrong for a given market, which is why it needs the backtest and benchmark that follow.
Which mean length to use
The mean itself is a choice, and it is testable. The next table, from the same Yahoo Finance ES and NQ data, repeats the two-sigma test against a 10-day, 20-day and 50-day mean.
| Mean length, 2-sigma trigger | ES setups a year | ES reached mean | ES median distance | NQ setups a year | NQ reached mean | NQ median distance |
|---|---|---|---|---|---|---|
| 10-day | 8.01 | 72.6% | 1.55 ATR | 8.01 | 64.4% | 1.65 ATR |
| 20-day | 7.46 | 52.9% | 2.21 ATR | 7.68 | 57.1% | 2.07 ATR |
| 50-day | 3.40 | 32.3% | 2.83 ATR | 4.17 | 36.8% | 2.82 ATR |
In that test, a 10-day mean gave the best hit rate because it sits closer to price. A 50-day mean is reached about a third of the time and produces three or four setups a year. A longer mean is not a stronger version of the same trade. It is a different trade with a further target, a lower hit rate and a longer hold.
Pick the mean from the holding period you can actually sit through, then measure its distance before trusting the hit rate.
Exits and Stop Losses on Mean Reversion Trades
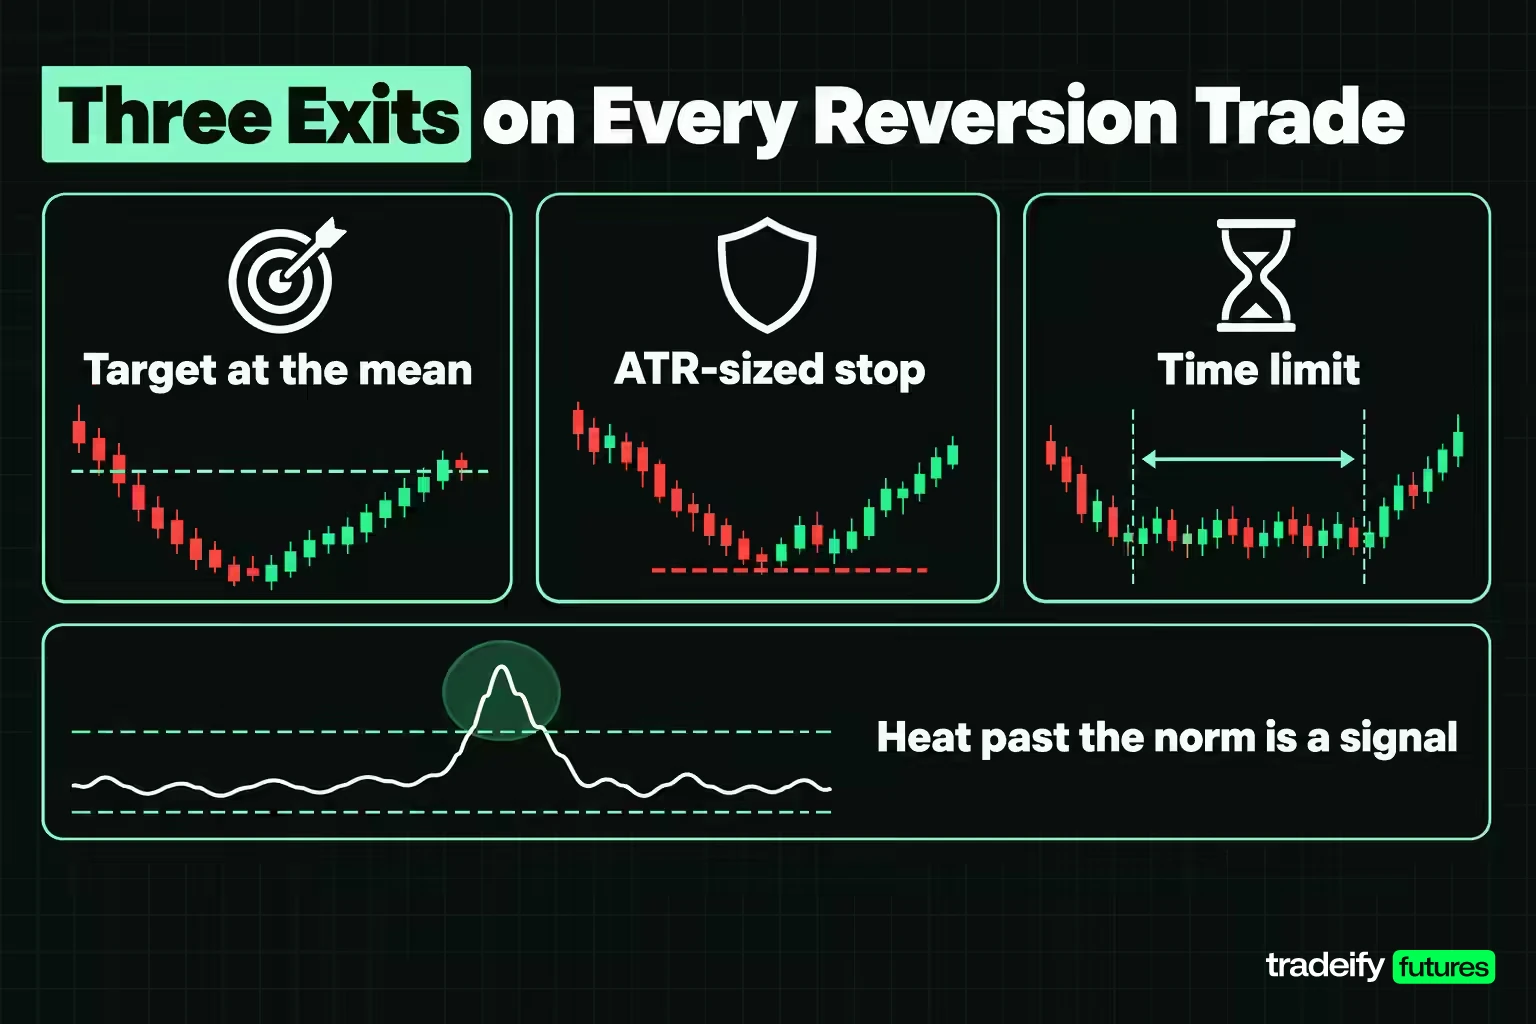
Exits are where mean reversion trades are usually won or lost, because the entry is by design a bet against the current move. Price is falling when you buy, so some heat is part of the deal. The useful question is how much heat the setups that worked actually took, because anything well past that is a signal, not bad luck.
Heat before the mean on mean reversion setups
The table below (this guide's calculation on Yahoo Finance continuous futures data) groups the two-sigma long setups from the daily study by their worst adverse move, measured in ATR from the entry close, up to the session the mean was reached or to the end of the 20-session window.
| Heat before the mean, 2-sigma setups | ES setups | ES reached mean | NQ setups | NQ reached mean |
|---|---|---|---|---|
| Up to 1 ATR | 21 | 95.2% | 23 | 95.7% |
| 1 to 2 ATR | 14 | 64.3% | 20 | 65.0% |
| More than 2 ATR | 33 | 21.2% | 27 | 18.5% |
In this guide's ES and NQ study, the setups that worked mostly worked without much pain. The median heat on setups that reached the mean was 0.78 ATR on both indices. Once a setup ran more than 2 ATR against the entry, it reached the mean only about one time in five.
That gives a usable condition. If price stays within about 1 ATR of your entry, the setup is behaving like the ones that resolve. If it runs past 2 ATR against you, the base rate has collapsed, and holding on is no longer the same trade you entered.
Stop width and the break-even hit rate
With the mean as the target and the stop measured in ATR, you can compute the reward-to-risk ratio of a mean reversion trade before entering and compare it with the hit rate needed to break even. Break-even is 1 divided by (1 plus the ratio), before costs.
| Stop width, 2-sigma setups on ES and NQ daily bars | ES target-to-stop ratio | ES break-even | ES target hit before stop | NQ target-to-stop ratio | NQ break-even | NQ target hit before stop |
|---|---|---|---|---|---|---|
| 0.5 ATR | 4.42 | 18.5% | 17.6% | 4.13 | 19.5% | 17.1% |
| 1.0 ATR | 2.21 | 31.2% | 29.4% | 2.07 | 32.6% | 31.4% |
| 1.5 ATR | 1.47 | 40.5% | 42.6% | 1.38 | 42.0% | 44.3% |
| 2.0 ATR | 1.11 | 47.4% | 42.6% | 1.03 | 49.3% | 50.0% |
In this guide's Yahoo Finance ES and NQ calculation, the tight stop is the tempting one, because 4.42 to 1 on ES looks like a great trade. It is touched first so often that the hit rate lands just under break-even. At 1.5 ATR the hit rate clears break-even by about two percentage points on both indices, which is a thin margin that sits well inside the confidence interval on about 70 setups. Neither width is a free lunch.
The sizing consequence is blunt. A mean reversion stop is not wide compared with a trend trade, but it is wide compared with its own target, so you size against a stop that is most of the reward.
Time limits and exiting at the mean
Timing belongs in the exit rule. In this guide's daily ES and NQ study, 17 of 68 ES two-sigma setups reached the mean within five sessions, 26 within ten, and 32 never reached it inside the 20-session window. NQ was similar: 15 within five, 29 within ten, 30 never. Most successes come early, and a large block never resolves, so an open-ended hold carries the risk without the payoff.
Exiting at the mean is the textbook target, but in the same ES and NQ study it was not the better exit. With a 1.5 ATR stop, taking profit at the mean returned 0.080 R per trade on ES and 0.177 R on NQ, while holding to the end of the 20-session window returned 0.441 R and 0.306 R. Price often kept going after it touched the mean, because a two-sigma drop followed by a recovery in a rising market tends to continue. That result depends on the long uptrend in both indices, so treat it as evidence about this sample rather than a rule.
Related lesson: Stop-loss orders and placement
Backtesting Mean Reversion Against a Benchmark
Backtesting a mean reversion rule has one trap that catches almost everyone: a long-only rule tested on a rising market looks good because the market rose, not because the rule found anything. The fix is a benchmark that runs the identical rule with no signal at all.
The table below, this guide's calculation on Yahoo Finance continuous futures data, runs a daily two-sigma mean reversion rule end to end with a 1.5 ATR stop and a 20-session time limit, results in R (multiples of the initial risk), before commissions and slippage. A stop that gapped through fills at the open. The benchmark buys every session's close under the same stop and time limit.
| Rule, 1.5 ATR stop, 20-session limit | ES trades | ES average R | NQ trades | NQ average R |
|---|---|---|---|---|
| 2-sigma stretch, hold to the time limit | 68 | 0.441 | 70 | 0.306 |
| 2-sigma stretch, exit at the mean | 68 | 0.080 | 70 | 0.177 |
| 1.5-sigma stretch, hold to the time limit | 93 | 0.255 | 100 | 0.102 |
| Benchmark, every session, no signal | 2,294 | 0.245 | 2,294 | 0.305 |
The benchmark is what keeps the result honest. In this ES and NQ backtest, on ES the two-sigma rule beat the no-signal entry by 0.196 R. On NQ the edge was 0.001 R, which is no edge at all. The 1.5-sigma rule trailed the benchmark on both. Only 42.6% of ES two-sigma trades and 45.7% of NQ trades ended positive, so the average came from a minority of large winners.
The year-by-year view shows the same instability. Summing R by calendar year from 2018 to 2026, ES lost in 2019, 2022 and 2025, and NQ lost in 2018, 2022, 2025 and 2026. That is 11 positive index years out of 18. A losing year is part of the sample, not a verdict on the rule. A trader who abandons it after one bad stretch never collects the good years, and a trader who never checks year by year never learns how bad the bad years get.
Validation checks for a mean reversion backtest
- Benchmark every result. Run the same exits from every bar, or from random bars, and judge the rule by the gap.
- Split the sample. Fit thresholds on one period, then test untouched data. If the edge only exists where you tuned it, it is curve fit.
- Count setups. Seventy trades over nine years is a small sample. Wide intervals are the honest answer, not a nuisance.
- Add costs and slippage. Mean reversion targets are short, so costs eat a larger share of each winner than they do in trend trading.
- Check the data. Continuous futures series contain roll gaps at each quarterly expiry, which can create or erase stretches that never existed in a single contract. The Yahoo Finance continuous data used in this guide is unadjusted, so its roll sessions add a little noise.
- Forward test before risking money. A rule that survives simulation for a few months has at least met live price behaviour once.
Related lesson: Backtesting a trading strategy
A Worked Mean Reversion Trade on ES
A real setup shows what the averages hide. Take the ES two-sigma setup of February 5, 2026, from the same daily data.
- Entry: the close at 6,820.75.
- 20-day mean: 6,958.35, so the target was 137.60 points away.
- Standard deviation of the 20 closes: 53.95, giving a z-score of -2.55.
- 14-session ATR: 92.16, so the target sat 1.49 ATR away.
- Stop: 1.5 ATR, or 138.24 points, at 6,682.51.
In dollars, ES moves $50 per index point, so the stop risked $6,912 per ES contract and $691.20 per Micro E-mini (MES) contract at $5 per point. The target paid $6,880 per ES. That is roughly 1 to 1, which is typical once the stop is sized to survive normal noise.
The mean was reached the next session, February 6, 2026. A trader exiting at the mean made about +1.00 R. A trader holding to the 20-session limit saw price fall back and close at 6,743.75 on March 6, 2026, 77.00 points below the entry. That is -0.56 R, or a $3,850 loss per ES and $385 per MES.
Same entry, same reversion, and the result was a win or a loss depending only on the exit rule. This is one trade from a sample where holding paid more on average, so it proves nothing on its own. What it shows is the shape of the risk: a quick touch of the mean does not mean the position is finished.
A mean reversion setup stopped out before the mean
A second ES two-sigma setup, from March 12, 2026 in the same Yahoo Finance daily data, shows the opposite problem. Entry was the close at 6,677.50 with the mean at 6,849.69 and a 1.5 ATR stop at 6,511.61. Price kept falling. The stop was touched on the seventh session, and the worst excursion reached 324.25 points. The mean was finally reached on the nineteenth session, April 9, 2026.
The reversion happened. You can be right about the direction and still lose the trade, and this one lost a full R, because the heat ran far beyond 2 ATR, the zone where about four in five two-sigma ES and NQ setups in this guide's ten-year study never recovered within 20 sessions. Widening the stop after entry to "give it room" would have saved this one and turned the losers in that group into larger losses.
Building a Mean Reversion Trading Strategy
Building a mean reversion trading strategy means writing the rule down tightly enough that a computer could trade it, then testing it before you trust it. This order of decisions draws on this guide's ten-year ES and NQ daily study.
- Choose the mean from your holding period. A 10-day mean suits a hold of a few sessions; a 50-day mean needs weeks and produced only three or four setups a year on ES and NQ. Intraday traders often use VWAP or a short moving average on 5-minute bars.
- Define the trigger, then convert it to ATR. Use a z-score, Bollinger Band or RSI if you like, but record the distance to the mean in ATR. In the daily study, the hit rate tracked distance, not the indicator.
- Set the stop in ATR and read the ratio. Divide the distance to the mean by the stop distance. Compare the break-even hit rate with the measured hit rate for that kind of setup. A ratio near 1.5 to 1 needs better than about 40% before costs.
- Add a time limit. Most successful setups resolved within ten sessions on daily bars. A rule without a time exit lets dead trades tie up risk.
- Add a regime filter only if it earns its place. A 200-day moving average filter improved the hit rate in this sample, but every filter cuts the setup count. Test the filtered and unfiltered versions side by side.
- Size from the stop. Decide the dollar risk per trade first, then divide by the stop distance in dollars per contract. Micro contracts make that sizing possible on small accounts.
- Benchmark and forward test. Compare against a no-signal version of the same exits, then trade it in simulation before committing capital.
Coding and testing a mean reversion rule
Most charting platforms include the building blocks of a mean reversion rule as built-in studies. TradingView documents RSI with a default length of 14 and Bollinger Bands with a length of 20 and a standard deviation of 2, and other futures platforms ship equivalent studies. For the rule itself, a spreadsheet can handle daily bars, and a short Python script with a file of daily futures bars is enough to test a full mean reversion rule: compute the mean, the standard deviation and ATR, flag the first close beyond the threshold, then walk forward bar by bar checking the stop, the target and the time limit.
Two coding details change mean reversion backtest results more than people expect. Count only the first bar beyond the threshold, or a five-day slide becomes five "separate" trades. And decide what happens when the stop and target are both inside the same bar; assuming the stop came first is the cautious choice.
Related lesson: Volatility based position sizing
Mean Reversion Versus Trend Following
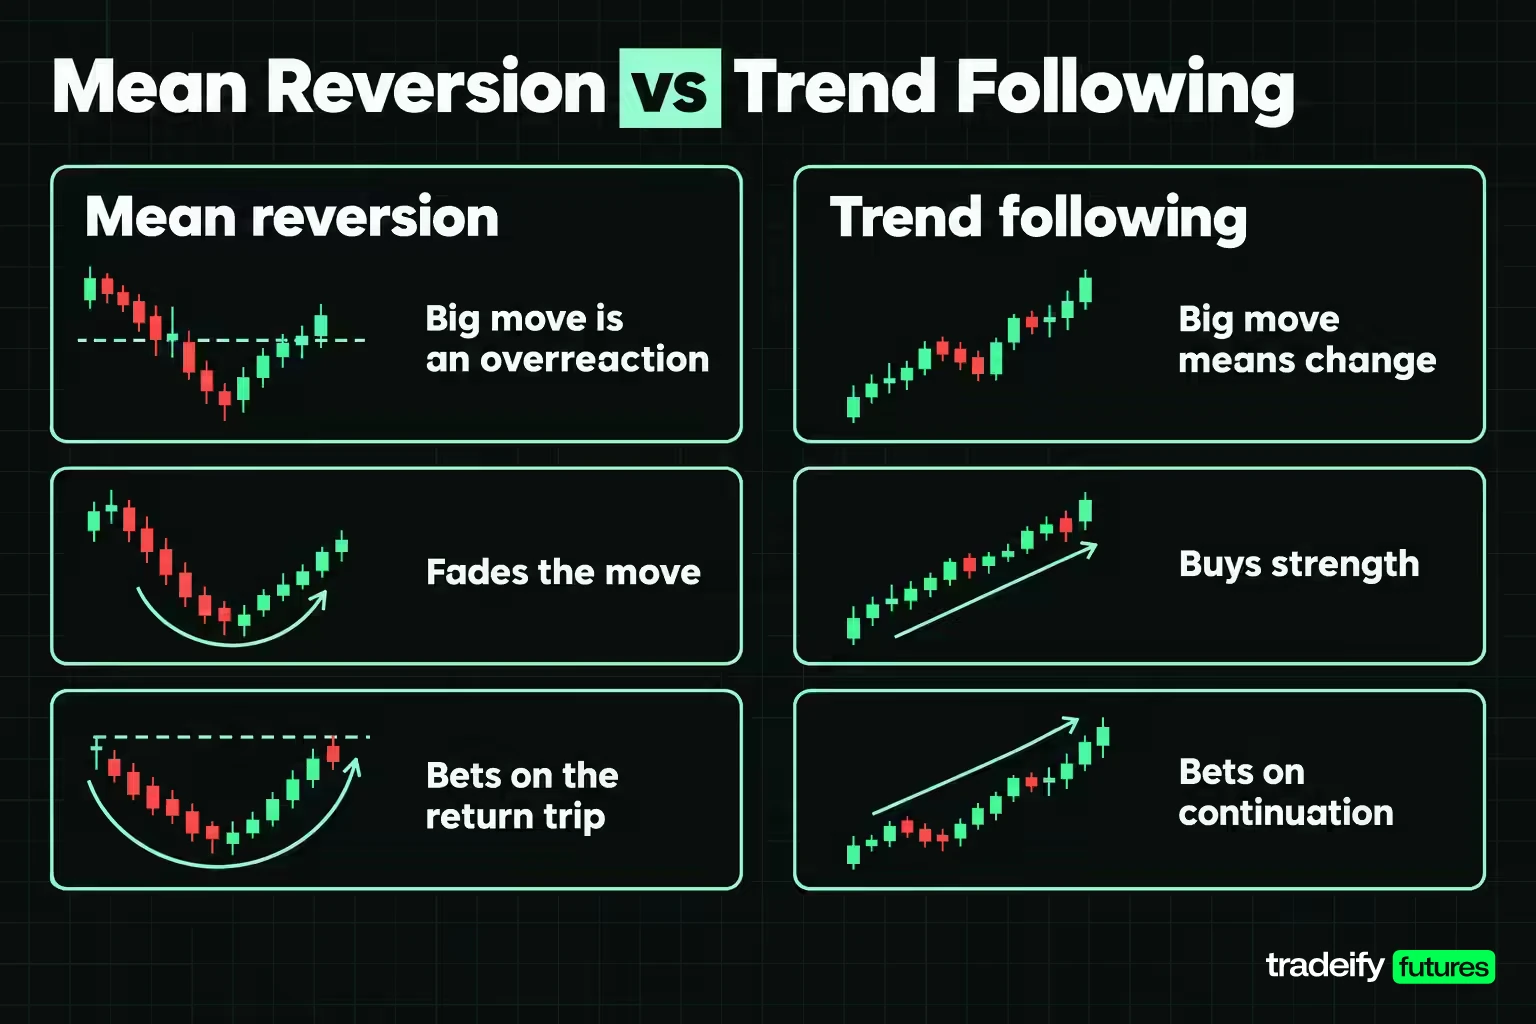
Mean reversion and trend following take opposite positions on the same move. A trend follower reads a large move away from the average as evidence that something has changed and buys strength. A mean reversion trader reads it as an overreaction and fades it. Each style wins in the conditions where the other loses, which is why many traders run both or switch between them.
The hard part is telling them apart in real time. A stretch below the mean looks identical at the start whether it becomes a two-day dip or a two-month decline. A few observable conditions help.
- Where price sits against a long average. In this guide's Yahoo Finance ES and NQ daily study, two-sigma setups taken above the 200-day moving average reached the 20-day mean 61.4% of the time on ES and 61.7% on NQ. Below the 200-day average, the rate fell to 37.5% on ES and 47.8% on NQ. Buying a dip in an uptrend worked more often than buying one in a downtrend.
- Whether the move is still accelerating. Heat beyond 2 ATR after entry is the clearest sign that the move is a trend, not an overreaction. In the same study, that is where the reach rate fell to about one in five.
- What caused it. A move driven by new information about value (a policy shift, an earnings reset, a supply shock) is less likely to revert than one driven by positioning or a liquidity gap.
The losing years in the backtest were the years stretches kept extending. In 2022, ES closed below its 200-day average on 213 of 251 sessions and NQ on 236 of 251, and the two-sigma rule lost on both. Nothing in the entry signal detected that in advance. The regime filter would have reduced the damage, at the cost of skipping some setups that worked.
The sample sizes behind the regime split are small (24 ES setups below the 200-day mean), so trust the direction more than the exact gap.
Related lesson: Trend following
Volatility and Mean Reversion
Volatility shapes mean reversion in two ways. It determines how far a stretch really is, and it affects whether the stretch is likely to close.
Two-sigma stretches happen most often when volatility is rising, because a sharp drop both pushes price away from the mean and widens the standard deviation. In this guide's ten-year Yahoo Finance ES and NQ study, 47 of the 68 ES two-sigma setups and 53 of 70 on NQ happened when ATR as a share of price was above its median for the test period. Those high-volatility setups reached the mean 48.9% of the time on ES and 52.8% on NQ. The calmer setups reached it 61.9% and 70.6% of the time, though from small samples of 21 and 17.
The practical reading: a stretch in a calm market is more often a temporary overshoot. A stretch in a volatile, falling market is more often part of a larger move, and its stop needs to be wider in points for the same ATR multiple, which means fewer contracts for the same dollar risk.
Why volatility itself tends to revert
Volatility is one of the most reliably mean-reverting things in markets. Quiet periods tend to give way to busier ones, and spikes tend to fade. The 2003 economics prize awarded to Robert Engle recognised his ARCH method for modelling time-varying volatility, the family of models built around that clustering-and-fading behaviour.
For a price trader, this matters in two places. ATR after a spike is likely to shrink, so stops sized from a spike may be wider than the next few sessions need. And an ATR that is unusually low tends to expand, which is when a fresh stretch can arrive faster and run further than the quiet chart suggests.
Related lesson: Average true range ATR
Mean Reversion on Intraday Futures Charts
Day traders usually apply mean reversion on 5-minute or 1-minute charts, fading moves away from VWAP or a short moving average. The same rule can be checked on intraday bars, and the result is a useful warning.
This guide's 5-minute check used Yahoo Finance ES and NQ bars from August 27, 2026 to November 4, 2026. A setup was the first 5-minute close at a z-score of -2 against a 20-bar mean, taken between 9:35 AM and 3:00 PM ET. The target was that 20-bar mean, the window was the next 60 minutes, and the stop was 1.5 times the 14-bar ATR.
| 5-minute 2-sigma setups, August to November 2026 | ES | NQ |
|---|---|---|
| Setups | 118 | 107 |
| Reached the mean within 60 minutes | 36.4% (28.3% to 45.4%) | 38.3% (29.7% to 47.8%) |
| Median time to reach it, when it did | 15 minutes | 25 minutes |
| Median distance to the mean | 13.53 points | 75.16 points |
| Target hit before the 1.5 ATR stop | 29.7% | 31.8% |
| Median target-to-stop ratio | 1.43 | 1.46 |
| Break-even hit rate | 41.2% | 40.7% |
On that ten-week Yahoo Finance sample the intraday version did not pay. The target was hit before the stop 29.7% of the time on ES and 31.8% on NQ, against break-even rates of 41.2% and 40.7%, before any costs. The daily version's tailwind (a decade-long uptrend lifting long entries) does not exist inside a single afternoon, and intraday stretches are more often the start of a directional session.
Ten weeks is a short window, so this is not proof that intraday mean reversion fails. It is proof that a 5-minute Bollinger Band touch is not an edge by itself. A trader working intraday needs a filter that the plain rule lacks, such as fading only into a prior level, only in a range-bound session, or only after the move stalls.
Related lesson: Volume weighted average price VWAP
Mean Reversion Across Markets and Assets
Mean reversion behaves differently by market because the forces that pull price back differ.
- Stock index futures (ES, NQ, YM, RTY). Broad indices combine many companies, so single-company shocks wash out, and short-term overshoots are common. The long-term upward drift favours buying dips over selling rallies, which the long and short results in this guide reflect.
- Commodities (crude oil, gold, grains). Supply shocks, inventory reports and weather can reset value quickly, so a stretch may be a new price rather than an overshoot. Seasonal patterns and spread relationships are where commodity mean reversion is more commonly applied.
- Currencies. Major currency pairs often range for long periods, which suits mean reversion, but interest-rate differentials and central-bank decisions can start trends that run for months. Futures traders access this through CME currency futures such as the euro (6E) and yen (6J) contracts.
- Individual stocks. Single stocks can revert after overreactions, but earnings, guidance and news can move fair value overnight. A gap on new information is not a stretch.
- Crypto. Crypto trades around the clock and has had long trending phases, sharp liquidation cascades and very high volatility. Stretches can be extreme and fast, so ATR-based sizing matters even more.
Mean reversion in fundamentals and valuations
Mean reversion also shows up outside price charts. Valuation measures like price-to-earnings ratios, profit margins and credit spreads are often described as reverting toward long-run norms, and value investing is partly a bet on that. The reversion is slow, measured in years, and the "normal" level can shift. For a short-term trader, fundamental reversion is context rather than a trigger. It can explain why a market keeps getting bought at certain valuations, but it cannot time a trade.
Related lesson: Range trading
Pairs Trading and Cointegration in Mean Reversion
Pairs trading applies mean reversion to the relationship between two assets instead of a single price. The trader buys one and sells the other when their spread or ratio stretches from its normal level, betting that the relationship will snap back. Because one leg offsets the other, the trade is less exposed to the market's overall direction.
The key concept is cointegration, and it is not the same as correlation. Two prices are correlated if they tend to move in the same direction day to day. They are cointegrated if a combination of them (such as a spread or ratio) is stationary, meaning it keeps returning to a stable level. Clive Granger shared the 2003 economics prize for methods of analysing time series with common trends, which is the cointegration idea. Pairs traders usually test for it with a statistical stationarity test before trading the spread.
The NQ to ES ratio is a good example of why correlation is not enough. The two indices are tightly linked day to day, yet the ratio of NQ to ES rose from 2.243 on November 7, 2016 to a high of 4.065 on June 22, 2026, and stood at 3.700 on November 4, 2026. Regressing the daily change in the log ratio on its prior level gave an implied half-life of 624 sessions, about two and a half years, from a weak statistic (a t-value of -1.61). Treating that ratio as a short-term reverting pair would have meant fading the Nasdaq's outperformance for a decade.
Futures traders who look at index pairs also need to check their firm's or broker's rules, because some accounts treat opposite positions in related products as hedging.
Related lesson: Pairs and spread trading
Pros, Cons and Risks of Mean Reversion Trading
Mean reversion trading suits some markets and traders better than others. The figures below come from this guide's ten-year study of ES and NQ daily futures bars on Yahoo Finance data.
Advantages of mean reversion trading
- High hit rates on short distances. In this guide's Yahoo Finance study, one-sigma setups, a median 1.27 ATR from the mean, reached it 75.2% of the time on daily ES bars and 71.4% on NQ.
- Defined targets. The mean gives a clear, objective exit, which makes rules easy to write and test.
- Frequent setups in range-bound markets. Choppy, sideways conditions that frustrate trend traders tend to suit mean reversion.
- Buying weakness at a measured distance. You enter at a known stretch instead of chasing a move after it has run.
Disadvantages of mean reversion trading
- Small target relative to the stop. Once the stop is wide enough to survive normal noise, the reward-to-risk ratio often sits near 1 to 1.5.
- Edges are thin and unstable. In this guide's ten-year ES and NQ backtest of a two-sigma mean reversion rule, the edge over a no-signal benchmark was 0.196 R on ES and close to zero on NQ, and several full calendar years lost.
- Losses cluster in trends. The rule loses most in the conditions where trends run, so drawdowns arrive in bunches.
Risks specific to mean reversion trades
- Catching a falling knife. In this guide's ES and NQ daily study, two-sigma setups that ran more than 2 ATR against the entry reached the mean only about one time in five. Without a firm stop, a mean reversion trade can turn a small loss into a large one.
- Gap risk. Daily-bar trades held overnight can open beyond the stop, and the fill is the open, not the stop price.
- Leverage. Futures magnify both sides. A 1.5 ATR stop on one ES contract at a 92.16-point ATR risks 138.24 points, or $6,912 at $50 per point, which is a large share of a small account.
Related lesson: Risk-reward ratio
Mean Reversion Pitfalls That Break Strategies
Most mean reversion failures come from a handful of repeated mistakes rather than from the idea itself.
- Trusting the stretch instead of the distance. A z-score of -3 in a volatile market can be a shorter trip than a z-score of -2 in a calm one. Convert to ATR before deciding.
- Averaging down. Adding to a losing mean reversion trade feels like buying a better price. The data says the further price runs against you, the less likely the return becomes, so averaging down concentrates risk in the setups most likely to fail.
- Moving the stop. Widening a stop after entry turns the rare large loss into a common one. If the stop was too tight, change the rule for the next trade.
- No time limit. A trade that has not resolved in its normal window is a different trade. Exit it and wait for the next setup.
- Ignoring the benchmark. A long-only rule in a rising market looks better than it is. Always compare with a no-signal entry.
- Underestimating costs. Short targets mean commissions and slippage take a bigger share of every winner, especially on intraday charts.
- Regime change. A rule tuned on a calm, range-bound period can fail badly when volatility shifts. Check results year by year, not only in total.
- Crowded entries. Popular levels such as the lower Bollinger Band attract many orders at once, which can mean slippage on entry and fast moves through the stops clustered just beyond them.
The common thread is a trader refusing to accept that this particular stretch is not reverting. That is a hard call to make with a red position open, which is exactly why the rule has to make it for you in advance.
Related lesson: Overfitting and look-ahead bias
Mean Reversion Inside a Daily Close Rule
Some trading accounts require every position to be flat by the end of each session, which changes how mean reversion can be traded. A daily-bar mean reversion rule that holds for up to 20 sessions cannot run on an account that forbids overnight holds. What remains is intraday mean reversion, where the target, the stop and the time limit all fit inside one session. On 5-minute ES and NQ bars from August to November 2026, a plain two-sigma rule hit its target before a 1.5 ATR stop only about 30% of the time, so the intraday version needs more filtering than the daily one.
On our accounts, all positions must be closed by 4:45 PM ET each trading day, and there are no overnight, weekend or swing holds on any account type, so a multi-session mean reversion hold is not possible with us. A 50K account allows up to 4 minis or 40 micros, which leaves room to size an intraday stop in micro contracts. Our funded accounts are simulated.
Mean Reversion Trading FAQ
What is mean reversion trading in simple terms?
It is buying when price has fallen unusually far below its recent average, or selling when it has risen unusually far above it, and expecting a move back toward that average. In this guide's study of ten years of Yahoo Finance ES daily bars, a one standard deviation stretch below the 20-day mean reached it within 20 sessions 75.2% of the time, and a two standard deviation stretch 52.9% of the time.
Is mean reversion trading profitable?
It can be, but a plain rule is not automatically profitable. In this guide's ten-year ES and NQ daily study, the two-sigma rule beat a no-signal benchmark by 0.196 R on ES and by almost nothing on NQ, before costs. Profitability depends on the exact rule, the market, the costs and the discipline to follow exits.
What is the best indicator for mean reversion?
No indicator was clearly best once distance was accounted for. RSI(2), z-scores and ATR distance all produced hit rates that lined up with how far price sat from the mean. Pick the indicator you understand, then measure the distance in ATR.
What z-score should trigger a mean reversion entry?
A 1.5 standard deviation trigger worked better than 2.0 in this guide's ten-year Yahoo Finance ES study, reaching the 20-day mean 67.7% of the time against 52.9%, with more setups. There is no universal number. Larger thresholds give larger targets, lower hit rates and fewer trades.
How long does mean reversion take?
On daily ES bars, two-sigma setups that reached the 20-day mean took a median of 6 sessions in this guide's Yahoo Finance study, and 32 of 68 never reached it within 20 sessions. On 5-minute bars, the median was 15 minutes on ES when the mean was reached.
Does mean reversion work in a trending market?
It works less often against the trend. In this guide's ten-year ES study, two-sigma dips above the 200-day average reached the mean 61.4% of the time on ES, against 37.5% below it. Buying dips within an uptrend is a different trade from fading a downtrend.
What is the difference between mean reversion and momentum?
Momentum and trend strategies bet that a move continues; mean reversion bets that it reverses. They tend to work in opposite market conditions, so their losing periods often fall at different times.
Can you day trade mean reversion?
Yes, but the intraday version is harder. In this guide's ten-week Yahoo Finance test, a plain 5-minute two-sigma rule on ES and NQ hit its target before the stop about 30% of the time, below the 40.7% to 41.2% needed to break even. Intraday mean reversion usually needs an extra filter, such as fading only into a prior level.
Mean Reversion Trading Risk
This mean reversion trading guide is educational content, not investment advice or a recommendation to trade any instrument. The ES and NQ figures describe one historical sample of continuous futures data, before commissions and slippage, and past results do not predict future results. Futures are leveraged, and losses can exceed what a single stop suggests when prices gap. Evaluation and funded prop accounts are simulated, and results there can differ from live markets.


