




TL;DR: Keltner Channels wrap an ATR envelope around a moving average, and the real decision is what a close outside it means. On a year of ES and NQ daily bars, outside closes clustered in steep trends. Following them for ten sessions landed near the middle of random entries on ES. Most were back inside the channel within five sessions. Choose the multiplier by how often you want price outside, then price the stop before you act.
Keltner Channels show trend direction and volatility on one chart, which is why so many traders keep them on screen. The trouble starts the first time price closes outside the channel and you have to decide what to do. Is that a breakout to chase, a stretch to fade, or just Tuesday? The answer depends on how often it happens, which version of the indicator you are looking at, and what usually follows.
This guide explains the formula, then tests the most common Keltner Channels claims on 252 completed sessions of E-mini S&P 500 (ES) and E-mini Nasdaq-100 (NQ) futures, from November 3, 2025 to November 3, 2026.
What Keltner Channels Are
Keltner Channels are a moving average with a volatility envelope drawn above and below it. The middle line (the basis) gives direction. The distance from the basis to each outer line comes from average true range (ATR), so the envelope widens when bars get bigger and narrows when they shrink.
The idea goes back to Chester Keltner's 1960 book How to Make Money in Commodities, where he called it the "Ten-Day Moving Average Trading Rule." His version used a 10-day simple average of typical price (the average of high, low and close) as the centerline, with the 10-day average of the high-low range added and subtracted for the outer lines. Keltner made no claim to inventing the idea. In the 1980s Linda Bradford Raschke popularized the version most platforms ship today: an exponential moving average (EMA) in the middle and a multiple of ATR for the distance.
StockCharts describes Keltner Channels as a trend-following indicator with two jobs. When a trend is running, breakouts and the direction of the channel matter. When the trend is flat, the outer lines can act as overbought and oversold levels. Keep that split in mind, because most misuse of the indicator comes from applying the flat-market reading in a trend, or the trend reading in a flat market.
Keltner Channels lag price, like any indicator built on a moving average. They describe where price has been relative to its own recent volatility. They do not forecast.
Related lesson: Moving averages SMA vs EMA
Keltner Channels Formula and the Versions Platforms Draw
The modern Keltner Channels formula has three parts:
- Middle line = 20-period EMA of the close
- Upper line = middle line + (2 x ATR)
- Lower line = middle line - (2 x ATR)
That is the example TradingView's reference uses, and StockCharts describes the channels as "typically" set two ATR values above and below the 20-day EMA. The ATR period is a separate input. StockCharts' worked example uses a 10-period ATR, and that 20 / 10 / 2 combination is the default this guide measures.
The catch is that "Keltner Channels" covers several constructions. TradingView's own inputs let you switch the basis between a simple and an exponential average, and switch the distance between high-low range and average true range. So two charts with the same label can be drawing different lines.
| Version | Middle line | Distance line | Where you see it |
|---|---|---|---|
| Keltner 1960 original | 10-period simple average of typical price | 10-period simple average of high minus low | Older books and some squeeze tools |
| Modern default | 20-period EMA of the close | 10-period Wilder ATR | Most charting platforms |
| Simple basis variant | 20-period simple average of the close | 10-period Wilder ATR | Platforms with an EMA toggle switched off |
| Simple ATR variant | 20-period EMA of the close | 10-period simple average of true range | Some scripts and spreadsheets |
Why true range differs from high-low range in Keltner Channels
True range is the greatest of three numbers: today's high minus today's low, today's high minus yesterday's close, and today's low minus yesterday's close (as absolute values). Welles Wilder built it in his 1978 book New Concepts in Technical Trading Systems to capture gaps that a plain high-low range misses. On a nearly 24-hour futures chart the two are close most days. On a stock that gaps at the open they can be far apart, which is one reason the 1960 version and the ATR version of Keltner Channels can disagree sharply on equities.
Related lesson: Average true range ATR
How to Calculate Keltner Channels Step by Step
Calculating Keltner Channels by hand takes five steps. Doing it once makes it much easier to spot why your platform's number differs from a screenshot.
- Seed the EMA. Average the first 20 closes. That simple average is the first EMA value.
- Update the EMA each bar. The weighting multiplier is 2 / (20 + 1), or 9.52%. New EMA = prior EMA + 9.52% x (close - prior EMA).
- Compute true range for each bar, as defined in Wilder's rule (the largest of high minus low and the two gaps to the prior close).
- Smooth true range into ATR. Seed it with the simple average of the first 10 true ranges, then update with Wilder's method: new ATR = (prior ATR x 9 + today's true range) / 10.
- Build the lines. Upper = EMA + 2 x ATR. Lower = EMA - 2 x ATR.
A 13-session Keltner Channels calculation on ES futures
Here are the last 13 completed sessions of the ES continuous daily series through November 3, 2026, on the 20 / 10 / 2 default. Every upper and lower value is the displayed basis plus or minus twice the displayed ATR on the same row, so any line can be checked on a calculator. "Position" puts the close on a scale where 0 is the lower line and 1 is the upper line.
| Date | Close | Basis EMA(20) | ATR(10) | Upper line | Lower line | Position |
|---|---|---|---|---|---|---|
| Oct 16, 2026 | 7,704.25 | 7,778.02 | 81.72 | 7,941.46 | 7,614.58 | 0.27 |
| Oct 19, 2026 | 7,734.50 | 7,773.88 | 83.17 | 7,940.22 | 7,607.54 | 0.38 |
| Oct 20, 2026 | 7,755.25 | 7,772.10 | 83.55 | 7,939.20 | 7,605.00 | 0.45 |
| Oct 21, 2026 | 7,800.25 | 7,774.78 | 81.32 | 7,937.42 | 7,612.14 | 0.58 |
| Oct 22, 2026 | 7,704.50 | 7,768.09 | 85.54 | 7,939.17 | 7,597.01 | 0.31 |
| Oct 23, 2026 | 7,659.75 | 7,757.77 | 83.56 | 7,924.89 | 7,590.65 | 0.21 |
| Oct 26, 2026 | 7,714.50 | 7,753.65 | 83.98 | 7,921.61 | 7,585.69 | 0.38 |
| Oct 27, 2026 | 7,758.25 | 7,754.09 | 82.88 | 7,919.85 | 7,588.33 | 0.51 |
| Oct 28, 2026 | 7,783.25 | 7,756.87 | 81.52 | 7,919.91 | 7,593.83 | 0.58 |
| Oct 29, 2026 | 7,754.25 | 7,756.62 | 80.74 | 7,918.10 | 7,595.14 | 0.49 |
| Oct 30, 2026 | 7,614.00 | 7,743.03 | 92.27 | 7,927.57 | 7,558.49 | 0.15 |
| Nov 2, 2026 | 7,574.50 | 7,726.98 | 95.34 | 7,917.66 | 7,536.30 | 0.10 |
| Nov 3, 2026 | 7,596.75 | 7,714.58 | 93.58 | 7,901.74 | 7,527.42 | 0.19 |
Reading the last row of the Keltner calculation
Read the last row of the ES Keltner table. The basis is 7,714.58 and ATR is 93.58, so the upper line is 7,901.74 and the lower line is 7,527.42. The close of 7,596.75 sits 69.33 points above the lower line and 304.99 points below the upper line. The channel is 374.32 points wide, or 4.85% of the basis.
Notice what the October 30 selloff did. ATR jumped from 80.74 to 92.27 in one session, which pushed the lower line down even as price fell toward it. The 10-period ATR reacts faster than the 20-period basis, so the envelope widens before the middle line visibly turns. That is the indicator working as designed, and it is why a sharp drop often fails to print a close outside the channel.
These are historical continuous-contract values from Yahoo Finance's daily series, used here as an illustration. Your platform may show slightly different numbers if it seeds the EMA from the first close instead of a 20-bar average, or builds the continuous contract differently.
Reading the Middle, Upper and Lower Keltner Lines
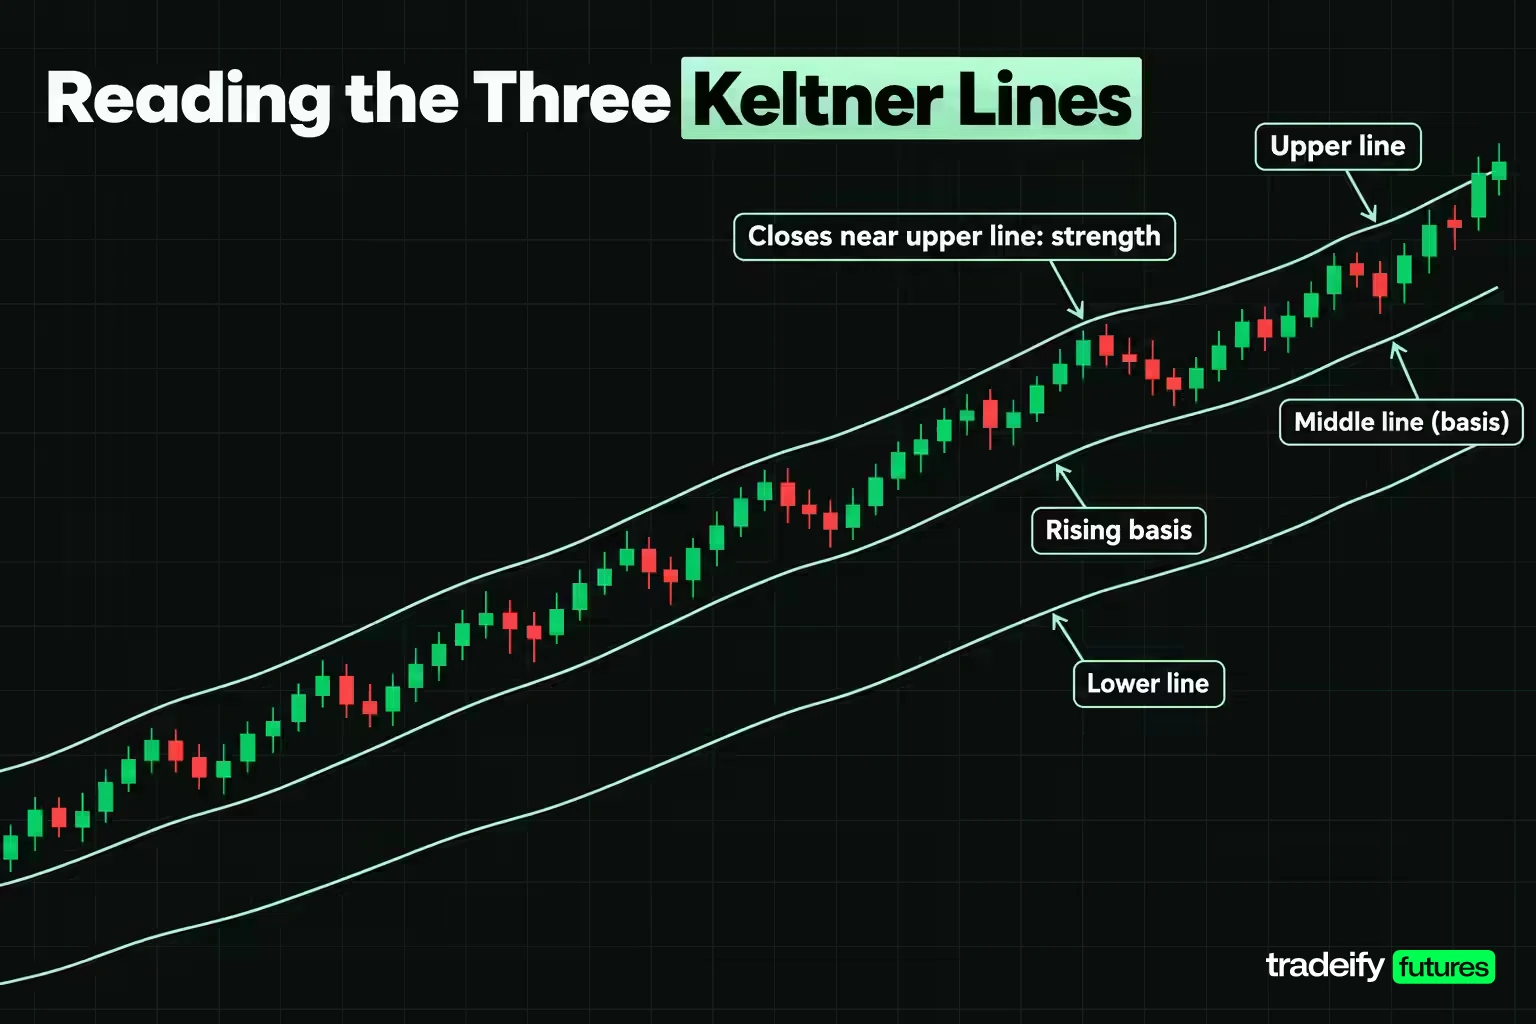
Each Keltner line answers a different question, and the meaning of a touch depends on which way the middle line is sloping.
- The middle line (basis) is the trend reference. A rising basis means closes have been running above their recent average. A flat basis means no net direction.
- The upper line marks a move that is large relative to recent volatility on the upside. In an uptrend, closes near or above it are a sign of strength, which TradingView's reference flags directly: in a clearly defined trend, "overbought" readings can mean the trend is strengthening.
- The lower line is the mirror image. In a downtrend, closes at or below it show pressure. In a flat channel, TradingView notes that readings at either line are often followed by a move back toward the middle line.
Channel position is the fastest way to read all three at once. On November 3, 2026, ES sat at 0.19, in the lower fifth of its channel but still inside it. NQ sat at 0.03, right on its lower line, after closing below the channel on November 2 (28,127.50 against a lower line of 28,315.46) and finishing at 28,305.75 on November 3, just 67.04 points above a lower line of 28,238.71. Same day, same sector, two different readings, because the Nasdaq-100 contract had fallen further relative to its own volatility.
The practical rule is to read the slope before the touch. A close at the lower line with a flat basis is a possible range low. The same close with a basis already tilting down is information about the trend, not an invitation to buy.
Keltner Channel Settings Measured on a Year of Futures Data
Keltner Channel settings come down to three inputs: the basis period, the ATR period, and the multiplier. StockCharts notes that the multiplier has the most effect on width. Cutting it from 2 to 1 halves the channel, and raising it from 2 to 3 widens it by 50%.
What no default tells you is how often each setting puts price outside the channel. That frequency is the number that matters, because it decides whether an "outside close" is a rare event or a routine one. This guide's study counted it on 252 sessions of Yahoo Finance daily ES and NQ futures bars (November 3, 2025 to November 3, 2026) for each multiplier, on the 20-period EMA and 10-period ATR.
| Multiplier | ES closes outside | ES share outside | ES mean width | NQ closes outside | NQ share outside | NQ mean width |
|---|---|---|---|---|---|---|
| 1 ATR | 100 | 39.68% | 2.54% | 100 | 39.68% | 3.83% |
| 1.5 ATR | 53 | 21.03% | 3.82% | 60 | 23.81% | 5.74% |
| 2 ATR | 29 | 11.51% | 5.09% | 42 | 16.67% | 7.65% |
| 2.5 ATR | 10 | 3.97% | 6.36% | 25 | 9.92% | 9.57% |
| 3 ATR | 2 | 0.79% | 7.63% | 11 | 4.37% | 11.48% |
Width is the full channel as a percent of the basis, averaged over the year.
In that study, a 1 ATR channel was hardly an envelope on these contracts. It contained only 60.32% of ES closes, against 88.49% at 2 ATR and 99.21% at 3 ATR. NQ ran looser at every setting: 2 ATR contained 83.33% of its closes, and the same setting is about 7.65% of price wide on NQ against 5.09% on ES. That is the trap of carrying one setting between markets and assuming the readings are comparable.
How to choose a Keltner Channel multiplier
Pick the multiplier from a target, not a habit. Decide what share of sessions you want flagged as unusual, then read the multiplier off a frequency count like this guide's. On ES daily bars from November 2025 to November 2026, 1 ATR flagged roughly two sessions in five, 1.5 ATR about one in five, 2 ATR about one in nine, and 3 ATR almost never. Any of those can be defensible. Running 2 ATR on one instrument and 1 ATR on another while treating both signals as equal is not.
The basis and ATR periods matter less than the multiplier. A shorter ATR period (such as 10) reacts faster to a burst of volatility, and StockCharts shows that a 100-period ATR is much smoother. A shorter basis turns sooner but whipsaws more.
Why two platforms show different Keltner Channels
Two traders can compare screens, see different breakouts, and both be looking at "Keltner Channels." This guide's study measured how often the variants disagreed about whether the close was outside the channel on 252 sessions of daily ES and NQ futures (November 2025 to November 2026), all at a multiplier of 2.
| Variant at 2x | ES closes outside | ES share | ES sessions classified differently from the default | NQ closes outside | NQ sessions classified differently |
|---|---|---|---|---|---|
| Modern default, EMA basis and Wilder ATR | 29 | 11.51% | 0 | 42 | 0 |
| Simple 20-period basis, Wilder ATR | 36 | 14.29% | 9 | 53 | 11 |
| EMA basis, simple average of true range | 30 | 11.90% | 3 | 40 | 2 |
| Keltner 1960 original | 10 | 3.97% | 25 | 17 | 29 |
Swapping the EMA basis for a simple one changed the status of the close on 9 ES sessions (3.57%) and 11 NQ sessions (4.37%). Swapping Wilder smoothing for a plain average of true range changed only 3 ES sessions (1.19%). The 1960 original is a different instrument entirely: at a multiplier of 1 it put 87 ES closes outside (34.52%), and at 2 it put only 10 outside, because the high-low range it uses is smaller than ATR. If you copy a rule from an old book onto a modern default chart, you are testing a different idea.
Using Keltner Channels to Identify Trending and Flat Markets
Keltner Channels are often taught as a way to tell trending markets from flat ones, and this guide's study of daily ES and NQ futures bars supports that use more strongly than it supports any entry signal. The test splits 252 sessions (November 3, 2025 to November 3, 2026) into thirds by basis slope, measured as the size of the 10-session change in the basis as a percent of price, and counts outside closes in each third.
| Basis slope third | ES slope range | ES outside closes | ES share | NQ slope range | NQ outside closes | NQ share |
|---|---|---|---|---|---|---|
| Flattest 84 sessions | 0.00% to 0.43% | 1 | 1.19% | 0.01% to 0.71% | 3 | 3.57% |
| Middle 84 sessions | 0.44% to 0.99% | 0 | 0.00% | 0.72% to 1.81% | 3 | 3.57% |
| Steepest 84 sessions | 1.00% to 4.02% | 28 | 33.33% | 1.82% to 6.20% | 36 | 42.86% |
In this guide's study, 28 of the year's 29 ES outside closes came in the steepest third. The flattest third produced one. NQ told the same story, with 36 of 42 in the steepest third.
That changes how the indicator should be read. A close outside a Keltner Channel is mostly a statement that the basis is already moving fast. It fires far more often when you could already see the trend than when you needed the indicator to tell you one was starting.
The flat-market use follows from the same table. When the basis is flat, outside closes are rare, so the outer lines behave more like boundaries than breakout levels. That matches StockCharts' description of the channel lines as overbought and oversold levels in a sideways trend. A flat channel is a poor source of signals and a reasonable source of levels.
Keltner Channel Breakouts Measured Against Random Entries
The common Keltner Channel breakout signal says a close above the upper line is bullish and a close below the lower line is bearish. That is a claim about what happens next, so it can be measured. This guide's test, on 252 sessions of Yahoo Finance daily ES and NQ futures bars from November 3, 2025 to November 3, 2026, takes every outside close in the steepest third of basis slope (the 84 sessions where the 10-session change in the 20-period EMA was largest), follows its direction for 10 sessions, and subtracts an assumed 0.50 point per round turn for slippage and commission.
On ES that rule produced 28 events (26 long, 2 short), with 20 winners, a 71.43% win rate and a net of 1,010.50 points. That sounds like an edge. It is not evidence on its own, because the window was mostly a rising market and a long-biased sample tends to look good in a rising market whatever triggered it.
Keltner breakouts compared with 4,000 random entries
To separate the Keltner breakout signal from market drift, the study compared the same trades with 4,000 random entry draws using identical sides, the same 10-session holding period and the same number of trades.
| Measure | ES | NQ |
|---|---|---|
| Outside closes in the steepest third, followed 10 sessions | 28 | 35 |
| Longs and shorts | 26 long, 2 short | 32 long, 3 short |
| Win rate | 71.43% | 65.71% |
| Net points after cost | 1,010.50 | 11,983.25 |
| Mean of 4,000 random draws | 848.25 | 4,362.42 |
| 5th percentile of random draws | -519.85 | -5,461.25 |
| 95th percentile of random draws | 2,299.36 | 14,534.90 |
| Percentile of the real result | 58.5th | 89.0th |
In this study, the ES breakout result sat at the 58.5th percentile of random entries. That is close to the middle, which means the signal added little beyond the market's own drift. On NQ the same rule landed at the 89.0th percentile, which is better but still short of the 95th percentile, and it rests on 35 events. One NQ event from November 2 was dropped because it did not yet have 10 sessions of follow-through.
So here is the plain reading. In this sample, a Keltner Channel breakout identified a trend that was already in motion. It did not reliably add return beyond what random entries in the same direction would have produced. That does not make the breakout useless. It means the breakout alone is not the edge, and anything you build on it needs its own test before real money or a drawdown limit rides on it.
Price Returning Inside the Keltner Channel
Price returning inside the Keltner Channel after an outside close is the counter-case most guides skip. If outside closes usually reverse, a breakout plan needs to know. If they rarely reverse, a fade plan does. This guide's study measured it on every close outside the default 20 / 10 / 2 channel in 252 sessions of Yahoo Finance daily ES and NQ futures bars, November 3, 2025 to November 3, 2026.
| Sessions after the outside close | ES back inside | ES share | NQ back inside | NQ share |
|---|---|---|---|---|
| Within 1 session | 8 of 29 | 27.59% | 9 of 42 | 21.43% |
| Within 3 sessions | 16 of 29 | 55.17% | 16 of 41 | 39.02% |
| Within 5 sessions | 21 of 29 | 72.41% | 20 of 41 | 48.78% |
In that study, more than a quarter of ES outside closes were back inside the channel the next session, and 72.41% were back inside within five sessions. NQ held outside longer, with 48.78% back inside within five sessions.
A return inside is not a reversal. Price can slip back inside the channel while the trend continues, and the basis and ATR keep moving too, so the line itself often comes to meet price. That is how, in the same study, ES outside closes followed for 10 sessions could still finish positive on balance while most of them were back inside the channel within a week.
Reversal and fade ideas therefore need more than "price came back inside." A fade from the upper line makes the most sense when the basis is flat, where outside closes were rare in this sample. In a steep trend, a return inside the channel is more often a pullback than a top. Decide in advance which one your plan assumes, and what would prove it wrong.
Trend Following and Entry Timing With Keltner Channels
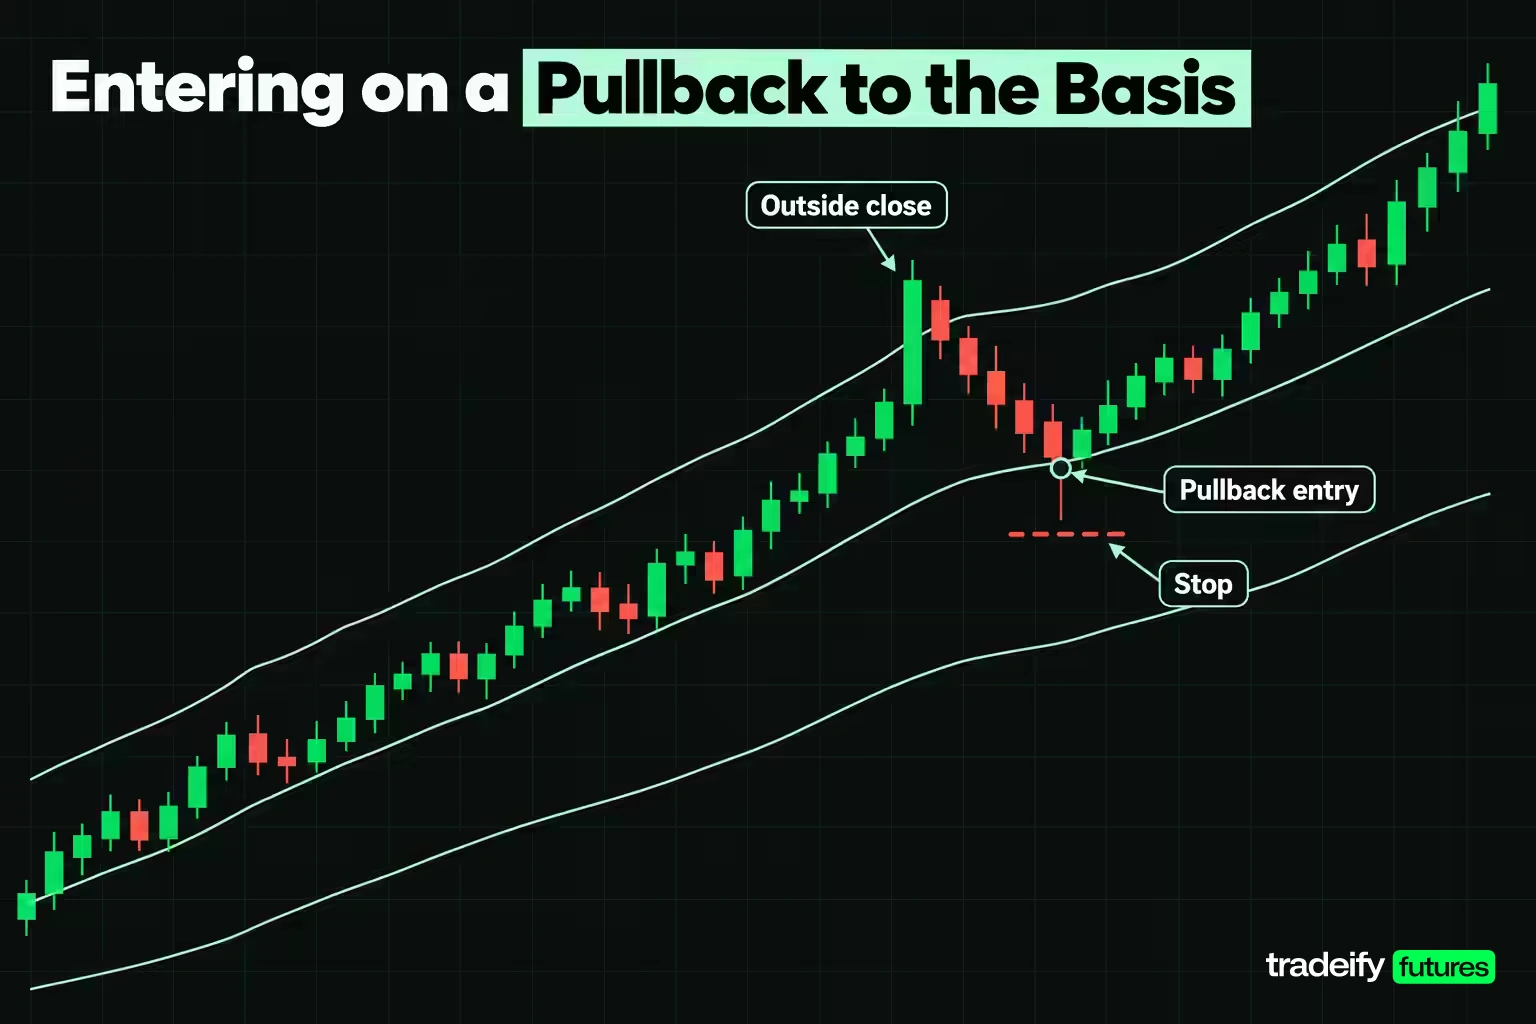
Trend following with Keltner Channels usually splits two jobs: the channel confirms that a trend exists, and a pullback toward the basis times the entry. StockCharts makes the same point, noting that after a new uptrend is established it is often prudent to wait for a pullback or better entry point to improve reward to risk.
The logic is simple, and the temptation is the problem. An outside close tells you the basis is moving, and watching it run without you is uncomfortable. But buying that close puts your entry at the most stretched point of the move, with the widest distance to any sensible stop. Waiting for a pullback toward the middle line moves the entry closer to the trend reference and shrinks the stop. Sometimes the pullback never comes, and missing that trade is the price of the rule.
Exiting a Keltner Channel trend at the basis
The exit matters as much as the entry. One common rule enters on an outside close and exits on the first close back through the basis. On 252 sessions of daily ES and NQ futures bars (November 2025 to November 2026), this guide's study found that rule produced few trades and no clear edge:
- ES: 3 trades in the year, 1 winner, net +52.50 points after cost (trades of -239.25, +395.25 and -103.50 points)
- NQ: 4 trades, 1 winner, net -154.00 points (trades of -1,030.50, +3,029.25, -1,550.25 and -602.50 points)
One large winner carried each instrument, and the rest gave back most of it. A basis exit sits inside the normal pullback range of a trend, so it tends to close positions on the dips a trend needs to survive. Trailing a stop behind the opposite channel line instead keeps the position alive through deeper pullbacks, at the cost of giving back more when the trend actually ends. Which suits you is a question about how much open profit you can watch shrink, not about the indicator.
Entry timing on intraday Keltner Channels
On intraday charts, a Keltner pullback entry works the same way with smaller numbers. A 5-minute Keltner Channel uses 5-minute ATR, so the stop distance shrinks with the bar size. The order of operations does not change: confirm the slope, wait for the pullback, define the stop before the entry, and accept that many sessions will not offer a clean setup.
Keltner Channels vs Bollinger Bands
Keltner Channels and Bollinger Bands look alike on a chart, but they measure width differently, and that changes how they behave. Bollinger Bands, developed by John Bollinger, use a 20-period simple moving average with bands set 2 standard deviations of the close away. Keltner Channels use an EMA with bands set a multiple of ATR away.
Standard deviation reacts sharply to a single large close and to a quiet stretch of tight closes. ATR is smoothed and tied to bar ranges, so it moves more slowly. On 252 sessions of daily ES and NQ futures bars (November 2025 to November 2026), this guide's study found the difference was large.
| Measure over 252 sessions | ES Bollinger 20, 2 | ES Keltner 20, 10, 2 | NQ Bollinger 20, 2 | NQ Keltner 20, 10, 2 |
|---|---|---|---|---|
| Mean daily change in width | 5.57% | 3.37% | 5.98% | 3.39% |
| Narrowest width, percent of price | 2.23% | 3.36% | 2.66% | 5.04% |
| Widest width, percent of price | 15.10% | 8.22% | 20.44% | 10.88% |
| Closes outside the bands | 26 | 29 | 27 | 42 |
The Bollinger width ranged from 2.23% to 15.10% of price on ES. Keltner width stayed between 3.36% and 8.22%. That stability is the main practical difference. A Keltner line makes a steadier reference for a trailing stop or a trend filter, while Bollinger Bands pinch harder in quiet markets and balloon after shocks, which is what makes them useful for spotting volatility compression.
Which to use, Keltner Channels or Bollinger Bands
Neither is better in general. Use Keltner Channels when you want a smooth trend envelope and stop reference that does not jump on one big bar. Use Bollinger Bands when you want to measure how stretched price is against its own recent dispersion, or to spot compression. Many traders use both, which is exactly what the squeeze setup does.
Related lesson: Bollinger Bands
The Keltner Channel Squeeze and Narrow Channels
The Keltner Channel squeeze compares Bollinger Bands with Keltner Channels. When the Bollinger Bands sit completely inside the Keltner Channels, volatility by standard deviation has compressed below volatility by ATR, and the market is said to be "in a squeeze." The best-known version is John Carter's TTM Squeeze. StockCharts notes that Carter uses 20 periods for the average and ATR, a 1.5 ATR multiplier, and the original 1960 Keltner formula, so a squeeze on one platform may not match another.
The usual claim is that a squeeze precedes a strong breakout. Here is what this guide's study of 242 daily ES and NQ futures sessions (November 2025 to October 2026, each with 10 sessions of follow-through) showed, using Bollinger Bands (20, 2) inside a Keltner Channel of the 20-period EMA plus or minus 1.5 times 10-period ATR, measured by the average absolute 10-session move that followed.
| Group | ES sessions | ES mean 10-session move | NQ sessions | NQ mean 10-session move |
|---|---|---|---|---|
| Squeeze on | 52 | 111.70 points | 54 | 820.00 points |
| Squeeze off | 190 | 134.31 points | 188 | 800.19 points |
On ES, squeeze sessions were followed by smaller moves, not larger ones. On NQ the difference was small, 820.00 points against 800.19. In this sample the squeeze did not reliably lead to a bigger move.
Narrow Keltner Channels and smaller moves
A second test in the same study looked at the Keltner Channel on its own. Of 242 sessions with 10 sessions of follow-through, the narrowest fifth on ES (48 sessions, bandwidth at or below 4.03% of the basis) was followed by a mean absolute move of 81.71 points, against 141.26 points for the other sessions. ATR on those narrow sessions averaged 69.45 points against 96.68. NQ showed the same direction, 740.24 points after narrow sessions against 820.54 after the rest.
Narrow channels preceded quieter stretches here, not explosive ones. Volatility tends to persist in the short run, so low ATR often stays low for a while. If your reason for watching a squeeze is that expansion must follow, this sample does not support it. If your reason is that your usual stop is now too wide for the conditions, it does.
Combining Keltner Channels With ADX and Momentum
Combining Keltner Channels with a separate trend-strength measure is the most common way to filter breakouts. The average directional index (ADX), another Wilder indicator, measures trend strength regardless of direction. StockCharts summarizes Wilder's guide: a strong trend is present when ADX is above 25, no trend when it is below 20, with a gray zone between.
This guide's study split Keltner outside closes by ADX(14) on 252 sessions of daily ES and NQ futures bars (November 3, 2025 to November 3, 2026), with each event followed for 10 sessions after an assumed 0.50-point cost.
| ADX(14) group | ES sessions | ES outside closes | ES net 10-session points | NQ sessions | NQ outside closes | NQ net 10-session points |
|---|---|---|---|---|---|---|
| ADX 25 or higher | 89 | 27 | 1,091.00 | 104 | 35 | 16,559.00 |
| ADX 20 to 25 | 33 | 2 | -132.50 | 38 | 3 | -2,547.25 |
| ADX below 20 | 130 | 0 | 0.00 | 110 | 4 | 1,842.75 |
ADX largely confirms that Keltner outside closes cluster in strong trends. On ES, 27 of 29 outside closes came with ADX at 25 or higher, and none came with ADX below 20. The ADX filter does not add many new trades so much as label the ones the channel was already flagging.
In the study's comparison with 4,000 random entries using the same sides and holding period, the ES ADX 25+ group landed at the 61.5th percentile (random mean 832.64 points). The NQ group landed at the 98.0th percentile (random mean 4,214.35 points), which is the strongest result in this study. One strong year on one contract is a reason to test further, not proof of an edge.
Momentum oscillators for Keltner pullback timing
Momentum oscillators fill a different gap. Once the channel and ADX agree a trend is running, an oscillator such as StochRSI or RSI can mark when a pullback has gone far enough to consider an entry near the basis. StockCharts shows this pairing with StochRSI on an uptrend. The oscillator should time the entry, not create the trend call.
Related lesson: Average directional index ADX
Keltner Channel Strategies From Entry to Exit
A complete Keltner Channel strategy needs a condition, an entry, a stop, a target or exit, and a reason to stand aside. Here are three Keltner templates: a trend pullback, a flat-channel fade and a squeeze breakout. They are frameworks to test, not systems with a proven edge.
Keltner trend pullback strategy
- Condition: basis rising (or falling) steeply, ideally with ADX at 25 or higher
- Entry: a pullback toward the basis, timed with a momentum oscillator turning back in the trend's direction
- Stop: beyond the opposite channel line, or a fixed ATR multiple from entry
- Exit: trail behind the opposite channel line, or take partial profit at the outer line in the trend's direction
- Stand aside: the basis flattens or price closes beyond the opposite line
Keltner flat-channel fade strategy
- Condition: flat basis and ADX below 20
- Entry: a rejection at the upper or lower line, back toward the middle
- Stop: a fixed ATR distance beyond the line that was tested
- Exit: the basis
- Stand aside: the basis starts tilting in the direction of the test, because a sloping basis is when outside closes become far more common
Keltner squeeze breakout strategy
- Condition: Bollinger Bands inside the Keltner Channel, with the exact squeeze definition written down
- Entry: the first close outside the Keltner Channel after the squeeze releases
- Stop: the opposite side of the compression range
- Stand aside: the squeeze persists, which in this guide's year of daily ES data was followed by smaller moves rather than larger ones
Turning a Keltner reading into a stop and a size
Every Keltner strategy ends in the same arithmetic: convert the channel into points, the points into dollars, and the dollars into a position size. Here is that conversion from the November 3, 2026 ES session, with ATR at 93.58 points. ES is $50 per index point and the Micro E-mini S&P 500 (MES) is $5 per point. Each line includes the same assumed 0.50-point round-turn cost, which is $25.00 on ES and $2.50 on MES. The target is twice the stop.
| Stop distance | Stop points | Stop as share of price | Target points | Net risk, one ES | Net reward, one ES | Break-even win rate | Net risk, one MES |
|---|---|---|---|---|---|---|---|
| 1 ATR | 93.58 | 1.23% | 187.16 | $4,704.00 | $9,333.00 | 33.51% | $470.40 |
| 1.5 ATR | 140.37 | 1.85% | 280.74 | $7,043.50 | $14,012.00 | 33.45% | $704.35 |
| 2 ATR | 187.16 | 2.46% | 374.32 | $9,383.00 | $18,691.00 | 33.42% | $938.30 |
Read the break-even column first. A 2-to-1 target needs about a one-in-three win rate after cost whether the stop is 1 ATR or 2 ATR, because the reward-to-risk ratio sets it. What the wider stop changes is the size of each loss. A 2 daily ATR stop on one MES contract risks $938.30. With an illustrative $500 risk budget per trade, even one micro contract does not fit, so the trade is a pass at that stop, or it moves to an intraday channel with a smaller ATR.
That order matters: stop first, then dollars, then size. Working backward from the size you want is how a sensible channel stop turns into an account-sized loss.
Related lesson: Volatility-based position sizing
Common Keltner Channel Mistakes
Most Keltner Channel mistakes come from reading one line without the context that gives it meaning. They are easy to make because the chart looks so clear. Each one below is tied to a measurement from this guide's study of 252 sessions of Yahoo Finance daily ES and NQ futures bars, November 3, 2025 to November 3, 2026.
- Treating every outside close as rare. In the study, at 1 ATR, 39.68% of ES closes finished outside the channel. "Outside" only means something once you know the setting.
- Comparing charts with different variants. The simple-basis version disagreed with the EMA version on 9 ES sessions in a year, and the 1960 original on 25. Name the basis, the distance type and the multiplier before comparing signals.
- Fading a strong trend at the outer line. In the study, outside closes clustered in the steepest third of basis slope (28 of 29 on ES). In that state, a close at the upper line usually describes strength rather than exhaustion.
- Reading a return inside as a reversal. In the study, 72.41% of ES outside closes were back inside within five sessions, while the 10-session follow-through still finished positive on balance.
- Trusting a raw win rate. In the study, a 71.43% win rate on ES breakouts sat at the 58.5th percentile of random entries. Always ask what the same trades would have done without the signal.
- Expecting a squeeze to force a breakout. In the study, narrow ES channels were followed by smaller moves (81.71 points against 141.26), not larger ones.
- Sizing from the signal instead of the stop. A daily 2 ATR stop on ES was 2.46% of price. The channel decides the distance, and your budget decides whether the trade is possible.
- Judging a rule on a tiny sample. The basis-exit rule produced three ES trades in a year. Three trades cannot confirm or reject anything.
Keltner Channels Across Timeframes, Markets and Platforms
Keltner Channels work on any timeframe and any market with high, low and close data, because the formula only needs those three inputs. Stocks, futures, currencies and crypto can all be charted with them. What changes from market to market is the typical channel width and how often price leaves it, which is why a setting tuned on one instrument should be re-checked on another. In this study, the same 2 ATR setting was about 5.09% of price wide on ES and 7.65% on NQ.
Shorter timeframes produce more signals and more noise. A daily channel can frame the trend for intraday decisions, and TradingView's Keltner Channels include an Indicator Timeframe input that lets a higher-timeframe channel display on a lower-timeframe chart, so a 1-hour channel can sit on a 5-minute chart.
Scanning for Keltner Channel pullback candidates
Scanning for Keltner pullback candidates is a two-part filter: confirm the trend, then find price resting inside the channel. Filter first for a rising basis, for example a 10-session basis change in the top third of its own history or ADX at 25 or higher. Then flag instruments whose close has pulled back into the lower half of the channel without closing below the lower line. That separates "trend intact, price resting" from "trend broken." Most charting platforms with a scanner can express both conditions.
Building Keltner Channels in a spreadsheet or script
Implementing Keltner Channels yourself is a good way to check a platform. In a spreadsheet, use one column each for close, true range, EMA, ATR, upper and lower line. Seed the EMA with the average of the first 20 closes and the ATR with the average of the first 10 true ranges, then apply the update formulas row by row. Compare your last row with your platform. If it differs, check the seed method, the basis type (EMA or simple) and the distance type (ATR or range) in that order.
On our accounts every position is closed by 4:45 PM ET, so a daily Keltner Channel like the one measured here serves as context for intraday decisions, not as a reason to hold a trade for ten sessions. Keltner Channels are a built-in indicator in TradingView, which our traders reach through the Tradovate connection, and WealthCharts' Chart Replay lets you practise reading channels on historical bars. Our funded accounts are simulated.
How This Keltner Channels Study Was Built
This guide's Keltner Channels study uses Yahoo Finance daily continuous futures bars for ES and NQ, 504 completed sessions from November 1, 2024 to November 3, 2026, with every measurement taken on the last 252 sessions (November 3, 2025 to November 3, 2026). The default channel is a 20-period EMA of the close seeded with a simple average, a 10-period Wilder ATR and a multiplier of 2. Forward results use closing prices, a 10-session horizon and an assumed 0.50-point round-turn cost, and the random comparison draws 4,000 sets of entries with the same sides and horizon. These are historical, illustrative measurements on one year of two contracts, not a forecast or a record of any account.
Keltner Channels FAQ
What are Keltner Channels?
Keltner Channels are a moving average with a volatility envelope around it. Most platforms use a 20-period EMA as the middle line, with the outer lines set 2 times a 10-period ATR above and below. Chester Keltner published the original in 1960, and Linda Bradford Raschke popularized the ATR version in the 1980s.
What is the best setting for Keltner Channels?
The best Keltner setting is the multiplier that flags as many sessions as you want flagged, starting from the 20-period EMA, 10-period ATR and 2x default. In this guide's study of a year of ES daily bars, 1 ATR put 39.68% of closes outside, 2 ATR put 11.51% outside, and 3 ATR put 0.79% outside.
Which is better, Bollinger Bands or Keltner Channels?
They do different jobs. Keltner Channels use ATR and change width smoothly, which suits trend filters and stop references. Bollinger Bands use standard deviation and react sharply, which suits measuring stretch and compression.
Are Keltner Channels a buy or sell signal?
Not on their own. A close outside the channel shows the basis is moving, but in this guide's study of a year of ES daily bars the 10-session follow-through after outside closes landed at the 58.5th percentile of matched random entries. Treat the channel as context, and test any entry rule you build on it.
Why do two platforms show different Keltner Channels?
Usually the basis type, the distance type or the EMA seed differs. In this guide's study of a year of ES daily bars, switching from an EMA to a simple basis changed whether the close was outside the channel on 9 of 252 sessions, so check those three settings before you question the data feed.
This guide is educational, not investment advice, and its measurements are historical and do not predict future results. Futures are leveraged and can lose more than you expect, and simulated or funded evaluation accounts are simulated, not live trading.


