




TL;DR: Bull vs bear markets describe a broad index's trend: a bull market rises 20% or more, a bear market falls 20% or more. The labels are confirmed only after the move, so they describe conditions rather than tell you the next trade. S&P 500 bear markets since 1928 averaged a 36.6% loss over 341 days, while bull markets ran longer and gained more. The practical decision is how to size and when to stand aside as volatility changes.
Every market cycle produces the same two headlines. One says stocks have entered a bull market, the other says a bear market has arrived, and both usually show up after most of the move is already on the chart. If you trade off the headline, you are trading the last move.
The words are still useful. They just describe the past more reliably than the future, and the decision that matters (how much size to carry, and when to stand aside) has to be made before anyone prints the label.
This guide defines a bull market and a bear market the way regulators do, shows what each has looked like in S&P 500 history since 1928, and turns the difference into decisions an investor or a futures trader can actually make. It covers where the names came from, how long each market type tends to last, how a correction differs from a bear market, why the labels arrive late, and what a decline does to a position and to the math of getting back to even.
Bull vs Bear Markets Defined
A bull market is a period when prices in a broad market index are rising and sentiment is optimistic. A bear market is the opposite: prices in a broad index are falling and sentiment is pessimistic. Investor.gov, the SEC's investor education site, puts a working number on both. A bull market generally means a rise of 20% or more in a broad market index over at least a two-month period. A bear market generally means a fall of 20% or more over at least a two-month period.
Two parts of that definition matter more than the 20% itself.
- Broad market index. The label belongs to an index such as the S&P 500, not to a single stock. A stock that is 30% below its high is in a drawdown. The market is in a bear market only when the broad index has fallen 20%.
- At least two months. The time condition separates a sustained trend from a single violent week. A sharp drop that reverses within days is a shock, not a regime.
The 20% line is a convention, not a law of nature. Research firms measure it slightly differently. Yardeni Research, whose S&P 500 tables are widely used for market history, counts a bear market as a decline of 20% or more from a peak and treats the bull market as the gain between one bear market's low and the next bear market's peak. Capital Group uses a similar rule: bear markets are peak-to-trough declines of 20% or more in the S&P 500, and bull markets are all other periods.
Key differences between a bull market and a bear market
The difference between the two market types is more than direction. A bull market and a bear market behave differently in speed, volatility and the kind of mistakes they invite.
- Direction. A bull market makes higher highs and higher lows over months. A bear market makes lower highs and lower lows.
- Speed. Bear markets in the S&P 500 have tended to be shorter and sharper. Bull markets tend to grind higher for years.
- Volatility. Daily ranges usually widen in a bear market, and rallies inside it can be violent.
- Sentiment. Optimism and rising risk appetite in a bull market; fear, selling pressure and caution in a bear market.
A useful shorthand: the bull market label tells you the index has risen 20% from a low, and the bear market label tells you it has fallen 20% from a high. Neither tells you what happens next. Reading the direction correctly and having a trade are two different things.
Why Rising Markets Are Called Bull Markets
The bull and bear market names come from 18th-century London trading slang, and the bear came first. According to the Online Etymology Dictionary, the stock market sense of "bear", a speculator betting on a fall, dates to at least 1709. It is a shortening of "bearskin jobber", from the proverb about selling the bearskin before you have caught the bear. A bearskin jobber sold stock for future delivery, expecting the price to fall before the delivery date so it could be bought back cheaper.
The stock market "bull", someone who tries to push a price higher, appears by 1714, and the two words were paired from about 1720.
The popular explanation is simpler and easier to remember. A bull attacks by thrusting its horns up, while a bear attacks by swiping its paws down. Capital Group describes this as a popular belief rather than the documented origin, and that is the honest way to hold it. The horns-and-paws image is a memory aid. The bearskin trade is the recorded history.
The terms then spread from people to markets. A bull is a trader who expects a rise; a bull market is a period when most of those expectations are being paid. The same logic gives you "bullish" and "bearish" for a view on any single instrument, which is why a trader can be bearish on crude oil inside a bull market in stocks.
Bull Market Characteristics vs Bear Market Signs

A bull market and a bear market can be described by the same handful of traits. What changes is which side of each trait the market is on. Reading them together is more useful than any single sign, because each one gives false signals on its own.
| Trait | Bull market | Bear market |
|---|---|---|
| Index trend | Higher highs and higher lows over months | Lower highs and lower lows over months |
| Working threshold | Up 20% or more from a low, at least two months | Down 20% or more from a high, at least two months |
| Sentiment | Optimism, rising risk appetite, fear of missing out | Pessimism, fear, demand for safety |
| Breadth | Most sectors and large stocks participating | Narrowing participation, rallies failing at prior highs |
| Volatility | Usually lower, orderly daily ranges | Usually higher, wide ranges and sharp counter rallies |
| Business backdrop | Growing earnings, available credit | Slowing growth, earnings cuts, tighter credit |
| Typical investor error | Sizing up after winners, chasing extended moves | Selling at the low, averaging down without a plan |
| Typical trader error | Buying every dip because dips always worked | Calling the bottom early, shorting into exhaustion |
How bull market characteristics show up on a chart
In a bull market, pullbacks tend to stop above the prior low and the index recovers to new highs. A trader sees this as support holding and breakouts sticking. Sentiment is not uniformly cheerful. Some of the strongest stretches of a bull market happen while many investors are still doubtful, which is part of why the market keeps climbing.
Even inside a bull market, declines can be deep. The S&P 500 fell 10.3% between its July 31, 2023 close and its October 27, 2023 close, and 18.9% between February 19, 2025 and April 8, 2025, both inside the bull market that began in October 2022. Neither crossed the 20% line on a closing basis, so the bull market label never changed. That is the clearest sign that "bull market" does not mean "calm market".
How bear market signs show up on a chart
In a bear market, rallies tend to stall below the prior high and the index makes a lower low. Ranges widen. Counter-trend rallies can be fast enough to convince people the bottom is in, and then roll over. The emotional texture is fear rather than greed, but the behavior risk is the same as in a bull market: a trader acting on the last few weeks rather than on a plan.
Related lesson: Market structure highs lows and trends
What Starts and Ends a Bull Market
No single cause starts or ends a bull market, and the same trigger can work differently in different cycles. A few drivers show up repeatedly.
- Interest rates. Lower rates make borrowing cheaper and future earnings worth more today. Rising rates do the reverse. In 2022 the Federal Reserve raised its target range seven times, from 0.25%-0.50% in March to 4.25%-4.50% in December, and the S&P 500 spent most of that year in a bear market.
- Inflation. High inflation tends to pull rates up and squeeze profit margins, which pressures stock valuations.
- Earnings. Rising corporate profits support a bull market. Earnings cuts often accompany a bear market.
- Credit and liquidity. When lenders pull back, companies and households spend less, and markets tend to price that in early.
- Recessions. A recession often comes with a bear market, but not always, and the order varies.
Bear markets and recessions are different events
A bear market measures prices. A recession measures economic activity, and in the US it is dated by the National Bureau of Economic Research. The two often overlap, as in 2007 to 2009 and in early 2020, when the NBER dated a recession from February to April 2020. They do not have to.
The 1987 bear market had no recession at all: the NBER dates none between November 1982 and July 1990. The 2022 bear market also had no NBER-dated recession, as of the NBER table checked in November 2026. Prices can fall sharply on rates, valuations or fear while the economy keeps growing.
How Long Bull and Bear Markets Last
Bull markets have historically lasted much longer than bear markets and gained far more than bear markets lost. Yardeni Research's S&P 500 tables list 22 bear markets since 1928. Across those 22, the average decline was 36.6% over 341 days. The median was a 32.7% decline over 261 days, and the range was wide: from a 20.6% decline in 1948 to 1949 to an 83.0% decline between 1930 and 1932, and from 33 days in 2020 to 929 days between 2000 and 2002.
The 24 bull markets in the same tables, running from the 1928 low to the January 2022 peak, averaged a 121.4% gain over 1,102 days. That average includes several short rebounds of the early 1930s. Starting from the June 1949 low, the 11 bull markets averaged a 191.6% gain over 2,022 days, or about 5.5 years. Capital Group reaches a similar conclusion for roughly the past seven decades: bull markets lasted about five and a half years with an average cumulative return of 265%, while bear markets lasted about one year with an average loss of 33%. Its figures run to June 30, 2024 and exclude the bull market that began on October 12, 2022.
S&P 500 bear markets since 1928
A selection of S&P 500 bear markets from the Yardeni series, with day counts that include weekends and holidays:
| Peak date | Trough date | Peak level | Trough level | Decline | Days |
|---|---|---|---|---|---|
| 9/7/1929 | 11/13/1929 | 31.92 | 17.66 | 44.7% | 67 |
| 4/10/1930 | 6/1/1932 | 25.92 | 4.40 | 83.0% | 783 |
| 1/11/1973 | 10/3/1974 | 120.24 | 62.28 | 48.2% | 630 |
| 8/25/1987 | 12/4/1987 | 336.77 | 223.92 | 33.5% | 101 |
| 3/24/2000 | 10/9/2002 | 1,527.46 | 776.76 | 49.1% | 929 |
| 10/9/2007 | 3/9/2009 | 1,565.15 | 676.53 | 56.8% | 517 |
| 2/19/2020 | 3/23/2020 | 3,386.15 | 2,237.40 | 33.9% | 33 |
| 1/3/2022 | 10/12/2022 | 4,796.56 | 3,577.03 | 25.4% | 282 |
Two honest readings of that history. Depth and duration are loosely linked at best: the 1987 bear market fell 33.5% in 101 days, while 1973 to 1974 fell 48.2% over 630 days. And with 22 events in nearly a century, the averages describe the past. They are not a countdown clock for the next bear market.
The current bull market as of November 2026
On the 20% convention, the current S&P 500 bull market dates from the October 12, 2022 low of 3,577.03. As of the November 3, 2026 close, the index stood at 7,568.92, up 111.6% from that low and about four years into the run. Its record close at that point was 7,818.93 on October 6, 2026, so the index was 3.2% below its high. Those figures are a dated snapshot and will change with the next session.
Market Corrections vs Bear Markets

Not every decline is a bear market, and the label you put on a decline changes how you respond to it. The usual ladder runs by depth, with speed as a second dimension.
- Pullback. A decline of a few percent from a recent high. Normal market noise.
- Correction. A decline of 10% or more from a high, but less than 20%. Yardeni's tables list dozens of them since 1928.
- Bear market. A decline of 20% or more from a high, held long enough to count as a trend.
- Crash. A bear market that happens very quickly. The 2020 bear market took the S&P 500 down 33.9% in 33 days.
A 20% market drop is called a bear market. A drop of 10% to just under 20% is a correction.
Corrections that almost became bear markets
The line between a correction and a bear market can come down to a fraction of a percent. The S&P 500 fell 19.9% in 1990, 19.8% in late 2018 (over 95 days) and 19.4% in 2011, according to Yardeni's corrections table, and none of those became official bear markets on a closing basis. In 2025 the index fell 18.9% from February 19 to April 8, closing short of the 20% line.
For a trader, the label in those cases mattered less than the volatility. A 19.8% decline and a 20.6% decline cost an account roughly the same. What changes is the headline, and the headline is not what hits your stop. The range does.
Related lesson: What is volatility
Why Bull and Bear Market Labels Arrive Late
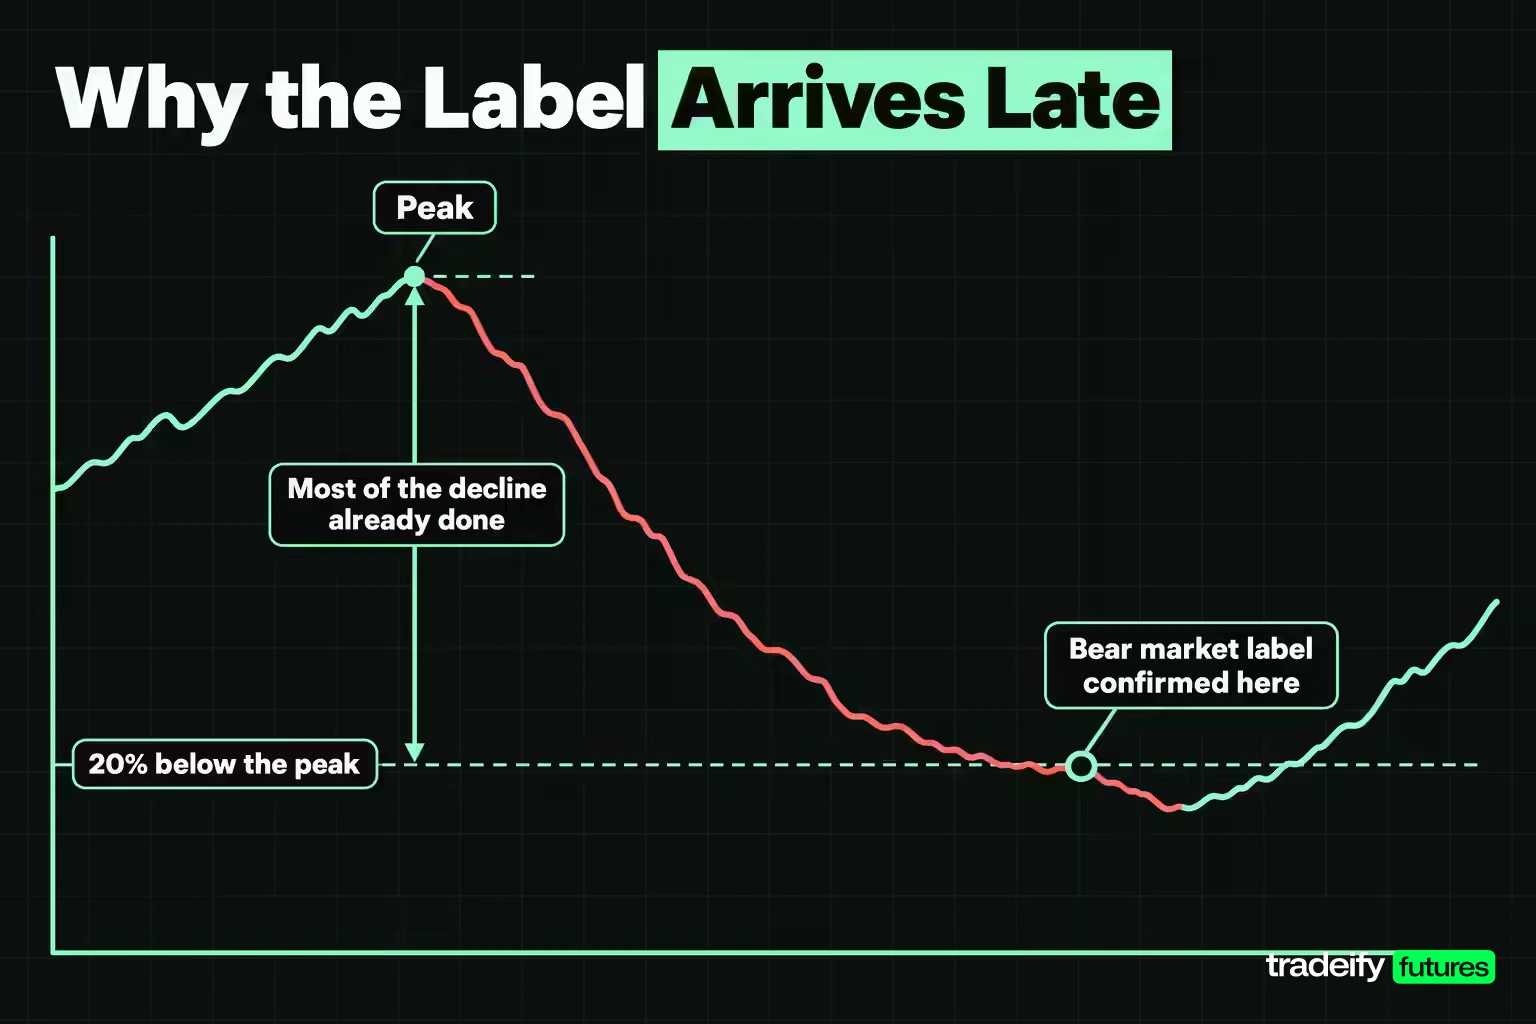
Bull and bear markets are confirmed in hindsight, which is why no one can reliably predict when one starts or ends. Capital Group puts it directly: the exact length and scope of these markets are never clear until after the fact. The 2022 bear market shows what that means in index points.
The S&P 500 closed at its peak of 4,796.56 on January 3, 2022. The 20% bear market line sat at 3,837.25. The first close below that line came on June 13, 2022, at 3,749.63, 161 days after the peak. By that close the index was already 21.8% below its high, and 85.8% of the decline that eventually bottomed at 3,577.03 on October 12, 2022 was already done.
The same delay works on the way back up. A new bull market is dated from the October 12, 2022 low, but the 20% rise that confirms it (to 4,292.44) did not arrive until the June 8, 2023 close, 239 days later. Anyone waiting for the official bull market label before buying index exposure missed the first 20% of the move.
What forecasting the next bear market can and cannot do
Rates, inflation, earnings and sentiment can raise or lower the odds that a bull market is late in its run. None of them has a reliable record of timing the turn. A forecast is an opinion; a position is a decision with a defined loss. The thesis can be right and the trade still wrong, usually because the timing or the size was. The useful version of the question is not "will the next year be a bull or a bear market?" but "what does my plan do if the index falls 20%, and what does it do if it rises 20%?"
The 2022 Bear Market in Futures Dollars
Index percentages feel abstract until they hit a position. Here is the 2022 S&P 500 bear market carried through the two most common S&P 500 futures contracts. CME Group specifies the E-mini S&P 500 (ES) at $50 times the index, with a 0.25-point tick worth $12.50, and the Micro E-mini S&P 500 (MES) at $5 times the index, with a 0.25-point tick worth $1.25.
| Stage of the 2022 bear market | S&P 500 level | Points from peak | One ES contract | One MES contract |
|---|---|---|---|---|
| Peak close, January 3, 2022 | 4,796.56 | 0 | $0 | $0 |
| 20% bear market line | 3,837.25 | 959.31 | $47,965.50 | $4,796.55 |
| Trough close, October 12, 2022 | 3,577.03 | 1,219.53 | $60,976.50 | $6,097.65 |
Three lessons fall out of that table.
- Most of the move came before the label. The index fell 959.31 points before it reached the bear market line and only 260.22 points after it, worth $1,301.10 on one MES contract.
- Contract size decided survival. One ES contract held long through the whole decline lost $60,976.50, more than the full balance of many trading accounts. The same index move on one MES contract was $6,097.65.
- You do not need a 20% move for a bear market to matter. At a round, illustrative index level of 7,000, a 2% day is 140 points, or $7,000 on one ES and $700 on one MES. Bear markets tend to produce more of those days.
Futures carry real leverage, so a holding through a bear market is not the same exposure as owning an index fund. The CFTC warns that many retail futures speculators lose all their money and can owe more than they invested.
Related lesson: Mini and micro futures contracts
Bear Market Recovery Math
Losses and recoveries are not symmetrical. After a loss of L percent, the gain needed to get back to the old high is L divided by (100 minus L). The deeper the bear market, the faster that gap grows.
| Bear market decline | Gain needed to recover | Example from S&P 500 history |
|---|---|---|
| 10% | 11.1% | Correction threshold |
| 20% | 25.0% | Bear market threshold |
| 25.4% | 34.0% | 2022 bear market |
| 33.9% | 51.3% | 2020 bear market |
| 49.1% | 96.5% | 2000 to 2002 bear market |
| 56.8% | 131.5% | 2007 to 2009 bear market |
| 83.0% | 488.2% | 1930 to 1932 bear market |
How long bear market recoveries take
Time adds to the cost of a bear market. Yardeni's tables show the S&P 500 needed 2,623 days after the October 9, 2002 low to set a new record high, and 1,997 days after the March 9, 2009 low. After the March 23, 2020 low it took 181 days. The fastest recoveries followed the fastest crashes, which is another reason depth and duration should be judged separately.
The account-level version of the lesson is the same. A trader who loses half an account needs to double what is left just to get back to the start, which is why most risk plans cap the size of a single loss and a single day rather than trying to trade back quickly.
Related lesson: Maximum drawdown
Investor Mindset and Emotions in Bull and Bear Markets
Bull and bear markets test the same discipline from opposite sides. In a bull market the pressure is greed and fear of missing out: the urge to add size because everything is working. In a bear market the pressure is fear: the urge to sell everything after a big decline, or to buy too early because the price "looks cheap".
Both feelings are normal, and most traders have felt each of them in the same year. The problem is acting on them without a rule written in advance. A precommitted plan, set when markets are calm, does the work that willpower cannot do in the middle of a 3% down day.
The four sentiment stages of a market cycle
Investor Sir John Templeton summarized the emotional arc of a bull market in one line: "Bull markets are born on pessimism, grow on skepticism, mature on optimism and die on euphoria." Read as stages, it looks like this.
- Pessimism. Near the end of a bear market, most people expect worse. Prices are low and few want to buy.
- Skepticism. Prices start to rise, but investors doubt the recovery and wait for more proof.
- Optimism. The trend is clear, results improve, and money that waited comes back.
- Euphoria. Caution fades, valuations stretch, and the market runs out of new buyers.
The framework is descriptive, not a timing tool. Nobody gets a notice when skepticism turns into optimism. Its practical value is as a self-check: if every conversation you hear sounds euphoric, that is information about risk, not a reason to add size.
Time horizon and risk tolerance in bull and bear markets
Investor.gov frames the core decisions around two personal inputs rather than market forecasts. Time horizon is the expected number of months, years or decades you will be investing for a goal; a longer horizon can wait out slow economic cycles and the ups and downs of markets. Risk tolerance is your ability and willingness to lose some or all of an investment in exchange for greater potential returns.
Those two inputs answer most bull and bear market questions before the market asks them. A trader has a third input: a fixed amount of risk per trade and per day, decided before the session starts.
Related lesson: Fear and greed in trading
Long-Term Investment Strategies for Bull and Bear Markets
For long-term investors, the strategy usually changes less between a bull market and a bear market than the headlines suggest. The common building blocks come from investor education rather than from market calls.
- Asset allocation. Investor.gov describes the mix of stocks, bonds and cash as a personal decision driven by time horizon and risk tolerance, not by whether the market is currently rising.
- Rebalancing. A bull market pushes the stock share of a portfolio up; Investor.gov's example is a 60% stock allocation that drifts to 80% after gains. Rebalancing every six or 12 months, or when an asset class moves past a preset band, sells some of what rose and buys what lagged. In a bear market the same rule buys stocks after they fall.
- Dollar-cost averaging. Investing equal amounts at regular intervals buys more shares when prices are low and fewer when they are high, which takes the timing decision out of a bear market.
- Staying diversified. Capital Group's guidance is to create a plan, diversify, and invest for the long term rather than chase short-term trends.
What investors tend to get wrong in each market
In a bull market, the common mistake is concentration: letting winners grow into an oversized share of the portfolio and treating recent returns as the new normal. In a bear market, it is selling near the low and then waiting for the official bull market label to buy back, which the 2022 to 2023 cycle shows can mean missing the first 20% of the recovery.
Neither mistake is about intelligence. Both come from acting on the most recent few months instead of a written plan, and both feel completely reasonable at the time. Investors close to needing their money have a stronger case for a lower stock allocation all the time, not just after a bear market starts.
Futures Trading Strategies for Bull and Bear Markets
Active traders treat bull and bear markets as regimes that change which setups work and how much size the account can carry. The same behavior that pays in one regime can be destructive in the other.
- Trend following in a bull market. Buying pullbacks toward support in a market making higher highs tends to work while the structure holds. The risk is that it keeps "working" right up to the first lower low.
- Shorting in a bear market. Futures make a short as simple as a sell order, with no stock borrow. Shorts tend to work best on rallies into resistance inside a downtrend, not after a vertical drop when a sharp counter rally is most likely.
- Ranges between regimes. When the index is neither making new highs nor new lows, trend entries get chopped up. Smaller size and fewer trades is often the honest response.
- Volatility-based sizing. Size from the stop distance, not from conviction. With an illustrative $500 risk budget, a 20-point stop is $100 per MES contract, so 5 contracts; if bear market ranges double the stop to 40 points, the same budget buys 2 contracts.
A bull and bear market regime checklist
A regime check takes a few minutes before the week starts. Answer each question with the reference index you trade, such as the S&P 500.
- Trend. Is the index making higher highs and higher lows, lower highs and lower lows, or neither?
- Distance from extremes. Is the index within a few percent of its high, in correction territory (10% or more down), or past the 20% bear market line?
- Breadth. Are most sectors participating, or is a handful of large stocks carrying the index?
- Range. Are daily ranges stable, or expanding with frequent gaps?
- Sentiment. Are readings extreme after a long move? Treat extremes as context, not a trigger.
- Your own results. Are your last 20 trades behaving the way your testing said they would?
If the trend and distance answers agree, the regime is reasonably clear. If they disagree, treat the market as a range and trade smaller until they line up.
Bull and bear market failure modes
| Failure mode | Market type | What it looks like | Rule that addresses it |
|---|---|---|---|
| Confidence sizing | Bull | Size grows after winners until one loss erases weeks of gains | Fixed risk per trade, set before the session |
| Structureless dip buying | Late bull | Every pullback is bought because pullbacks always worked | A defined level and a confirmation before entry |
| Averaging down | Bear | Adding to a losing long to lower the average price | A maximum loss per position, honored every time |
| Early bottom calling | Bear | Going long because the fall "looks big enough" | Wait for a higher low and a break of the last lower high |
| Revenge trading | Either | Raising size after a loss to win it back fast | A daily loss limit that ends the session |
| Shorting exhaustion | Bear | Selling after a vertical drop, right into the rally | Short rallies into resistance, not breakdowns already extended |
Bear market volatility in an intraday prop account
Intraday traders feel a bear market mostly through range and speed. When ranges expand, a stop that fit a calm bull market can be too tight to survive normal noise, and a stop wide enough to survive can be too expensive for the account's daily limit. That trade-off is why size, not direction, is usually the first thing to change. Cutting size on a wide day can feel like giving up opportunity. It is really keeping the same risk on a bigger move.
On our accounts, every position is closed by 4:45 PM ET and there are no overnight or weekend holds, so bear market gaps between sessions never sit on an open position. Size is capped by contract limits (a 50K account allows 4 minis or 40 micros), and shorting ES or MES is an ordinary sell order, but long in one equity index product while short another, such as long ES and short NQ, counts as prohibited hedging. Our funded accounts are simulated, and the end-of-day trailing drawdown is enforced in real time, so a wide bear market range is something to size for before the open.
Related lesson: Trend following
Bull vs Bear Markets FAQ
What is a 20% market drop called?
A 20% drop in a broad market index, held for at least two months, is called a bear market. A decline of 10% to just under 20% is usually called a correction. A very fast bear market is often called a crash.
Why are bulls and bears in the stock market?
The terms come from 18th-century London trading slang. "Bear" for a speculator betting on a fall dates to at least 1709, from the "bearskin jobber" who sold before owning, and "bull" followed by 1714. The horns-up, paws-down image is a popular memory aid.
What is the 7% rule in stocks?
It is a loss-cutting rule taught by Investor's Business Daily: sell a stock if it falls 7%-8% below what you paid for it. IBD says the rule comes from its study of more than 130 years of market history. On a leveraged futures contract the percentage does not transfer directly, so traders usually cap loss per trade in dollars instead.
Should a 70 year old get out of the stock market?
There is no age at which the answer is automatically yes. Investor.gov ties the stock and bond mix to time horizon and risk tolerance, and both change with retirement income needs. The money most exposed is what you need within a few years, since after the 2009 low the S&P 500 took 1,997 days to set a new record. Many investors reduce stock exposure gradually, and a licensed financial professional can help set that mix.
Is the stock market in a bull market or a bear market right now?
As of the November 3, 2026 close, the S&P 500 was in a bull market on the 20% convention. The index was 3.2% below its October 6, 2026 record and far above its October 2022 low. That reading is a dated snapshot and can change with any session.
Do bear markets always come with a recession?
No, bear markets do not always come with a recession. A bear market measures prices and a recession measures economic activity. The 1987 and 2022 bear markets came without an NBER-dated recession, while 2007 to 2009 and 2020 had both.
Is it better to buy in a bull market or a bear market?
Neither is better in general, because the answer depends on whether you invest on a schedule or trade a method. Long-term investors who keep buying on a schedule buy in both, and bear markets let the same contribution buy more. Traders are paid for matching a method to the regime. Trend entries are easier in a bull market, while bear markets offer short setups along with violent counter rallies.
Run a Bull or Bear Market Regime Check Before Your Next Session
Definitions are the easy part of bull vs bear markets. The work is deciding what your rules do in each regime and then measuring which one you are in rather than arguing about it.
Before your next session, write down four answers. Which index is your reference for the regime? How far is it from its last confirmed high and low, in percent? What does your position size become if the daily range doubles? And what dollar loss for the day or week ends trading when you hit it? If any answer is missing, filling it in is your next task, not your next trade.
Related lesson: Long vs short positions
This page is educational and is not financial advice or a recommendation to buy or sell any instrument. Trading futures and other leveraged products carries substantial risk, and losses can exceed what you expected or deposited. Historical market figures do not predict future results, and simulated or funded evaluation accounts are simulated and do not reproduce live market execution.


