



TL;DR: CCI indicator readings show how far price sits from its own recent average, so +100 and -100 are conventions, not hard limits. On 252 E-mini S&P 500 sessions, CCI(20) stayed inside +/-100 only 59.1% of the time, not the 70% to 80% usually quoted. Lambert's threshold rule lost 306.50 points over 28 trades that year, and no setting from 10 to 50 made money. Treat a reading as a location check that still needs a trend filter, a stop and a size.
The CCI indicator looks simple on a chart. A line pushes through +100, the textbook says a trend is starting, and the temptation is to hit the buy button on that bar.
The harder question is whether that crossing tells you anything once you pay for the entry, the exit and the whipsaws. This guide explains what the commodity channel index measures, works one calculation through by hand, and then tests the most quoted CCI claims on a year of E-mini S&P 500 (ES) futures data so you can see where the indicator helps and where it quietly costs money.
What the CCI Indicator Measures
The CCI indicator (commodity channel index) measures how far the current bar's typical price sits from its own simple moving average, expressed in units of how far prices in that same window normally stray from the average. Donald Lambert introduced it in Commodities magazine in 1980 to find cyclical turns in commodity markets. Despite the name, the arithmetic has nothing commodity-specific in it, and it runs the same way on stock indexes, single stocks, currencies and futures.
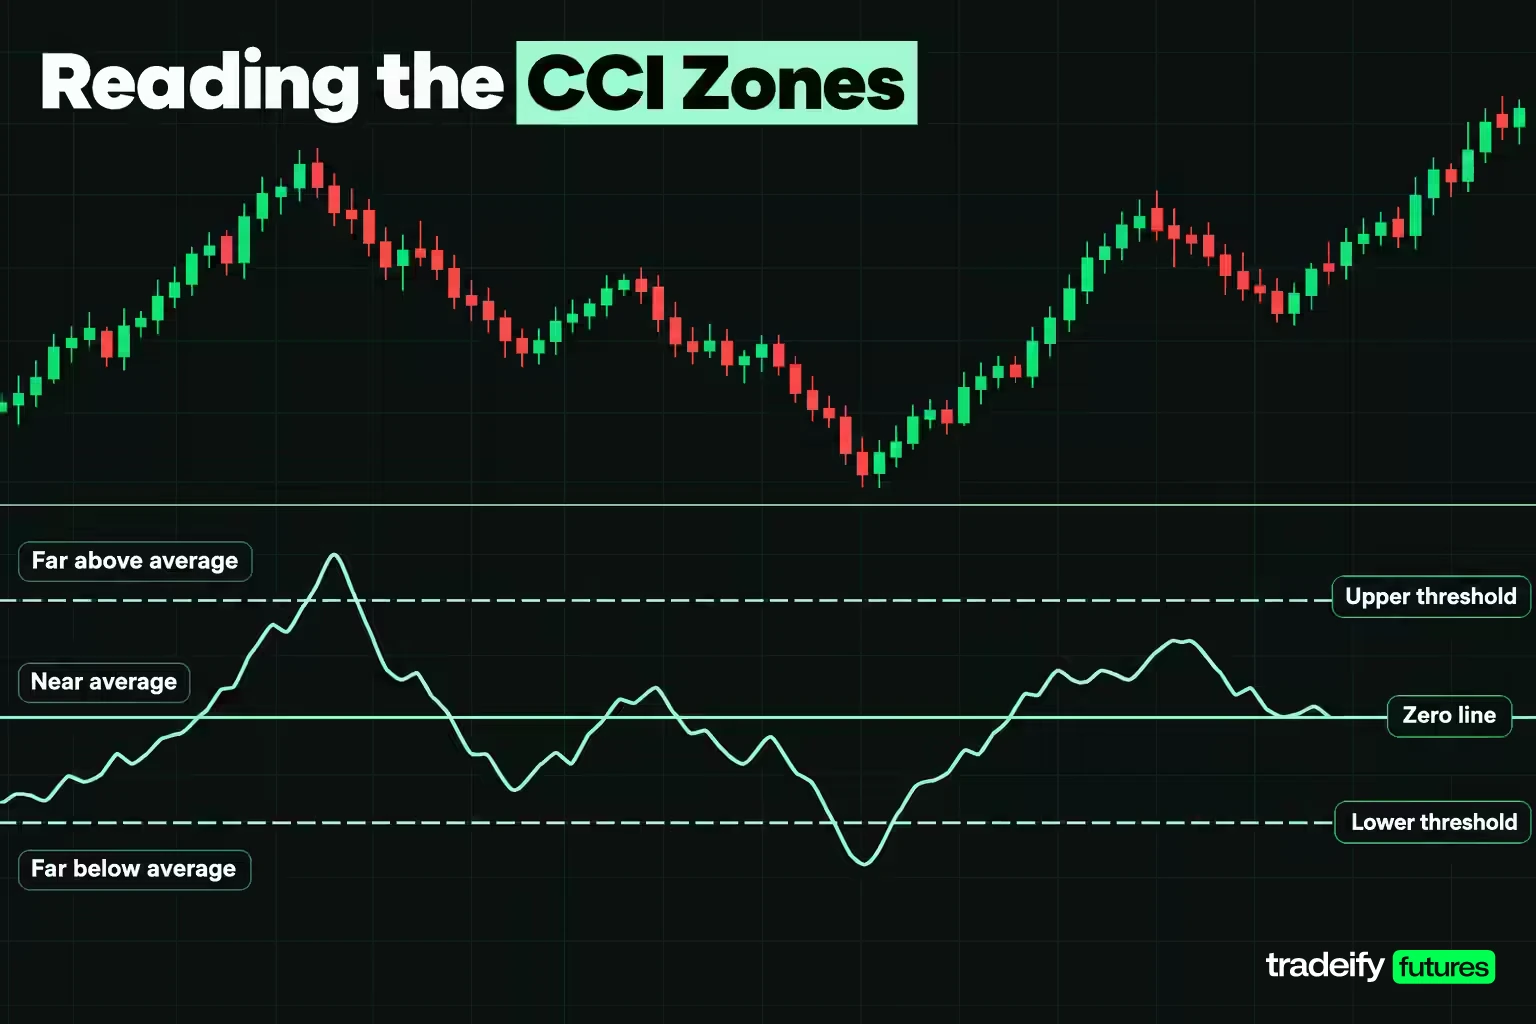
Reading the line comes down to three zones:
- Above zero: the latest typical price is above its recent average. The further above, the stronger the recent push relative to that window's normal noise.
- Below zero: the latest typical price is below its recent average.
- Beyond +100 or -100: the gap is large relative to the window's own mean deviation. Traditional texts call these zones overbought and oversold, and Lambert used them as trend signals.
Two details change how you should read any CCI indicator value. First, CCI is unbounded. There is no ceiling at +100 and no floor at -100, so a reading of +250 is possible and does not mean price must turn. Second, CCI is relative to its own window. A reading of +150 on a quiet index and +150 on a volatile commodity describe very different moves in price terms.
One naming caution helps searchers too. In economics, CCI usually means the Consumer Confidence Index. On a trading chart, CCI is Lambert's commodity channel index and nothing else.
How the CCI Indicator Is Calculated
The CCI indicator is calculated in four steps, and the lookback (N, usually 20) is used for both the average and the deviation:
- Typical price for each bar = (high + low + close) / 3.
- Simple moving average (SMA) of the last N typical prices.
- Mean deviation = the average of the absolute gaps between each of those N typical prices and that same SMA.
- CCI = (current typical price - SMA) / (0.015 x mean deviation).
The 0.015 constant is a scaling choice. Lambert set it so that, by his description, roughly 70% to 80% of readings would fall between -100 and +100. It stretches the line but does not change the order of any two readings.
A Worked CCI Calculation on ES Futures
Formulas hide where the number comes from, so here is one real session worked through. On October 12, 2026, the ES continuous contract printed a high of 7,887.00, a low of 7,846.25 and a close of 7,858.00. The typical price is (7,887.00 + 7,846.25 + 7,858.00) / 3 = 7,863.75.
The 20-session window runs from September 15 to October 12, 2026. Its typical prices sum to 155,177.62, so the SMA is 7,758.88.
| Session | Typical price | Absolute gap from the 7,758.88 average |
|---|---|---|
| 2026-09-15 | 7,599.75 | 159.13 |
| 2026-09-16 | 7,565.92 | 192.96 |
| 2026-09-17 | 7,615.33 | 143.55 |
| 2026-09-18 | 7,650.95 | 107.93 |
| 2026-09-21 | 7,798.17 | 39.29 |
| 2026-09-22 | 7,830.25 | 71.37 |
| 2026-09-23 | 7,791.50 | 32.62 |
| 2026-09-24 | 7,752.58 | 6.30 |
| 2026-09-25 | 7,789.00 | 30.12 |
| 2026-09-28 | 7,758.58 | 0.30 |
| 2026-09-29 | 7,738.33 | 20.55 |
| 2026-09-30 | 7,734.33 | 24.55 |
| 2026-10-01 | 7,721.50 | 37.38 |
| 2026-10-02 | 7,770.25 | 11.37 |
| 2026-10-05 | 7,811.33 | 52.45 |
| 2026-10-06 | 7,866.83 | 107.95 |
| 2026-10-07 | 7,851.00 | 92.12 |
| 2026-10-08 | 7,819.17 | 60.29 |
| 2026-10-09 | 7,849.08 | 90.20 |
| 2026-10-12 | 7,863.75 | 104.87 |
The twenty absolute gaps sum to 1,385.29, so the mean deviation is 69.26. The numerator is 7,863.75 - 7,758.88 = 104.87 points. The denominator is 0.015 x 69.26 = 1.0390. Dividing gives a CCI(20) reading of 100.94, up from 93.95 the session before.
That is a textbook CCI indicator buy signal under Lambert's rule: a close above +100. What happened next is the useful part. The next session closed at 7,855.75 with CCI at 83.89, back under +100, so the rule exited for a 2.25-point loss before costs. Two sessions later price was 7,770.25. A valid signal and a profitable trade are two different things, and the CCI calculation only delivers the first.
Related lesson: Moving averages SMA vs EMA
CCI Overbought and Oversold Levels Measured
CCI overbought and oversold levels are conventions. The standard bands are +100 and -100. ChartSchool and Fidelity both suggest +200 and -200 for more volatile instruments, and Investopedia recommends reading each market's own history because one stock may reverse near +200 and -150 while a commodity reverses near +325 and -350.
ChartSchool, Fidelity and Wikipedia all repeat the same claim: the 0.015 constant keeps 70% to 80% of CCI indicator readings inside +/-100. It is testable, so here is the test.
Why the 70% to 80% Figure Holds Only in Theory
For normally distributed, independent data, the mean deviation settles at 0.7979 standard deviations. A CCI reading of 100 is therefore a gap of about 1.197 standard deviations, and 76.9% of independent normal values fall inside that. If you swapped in a standard-deviation denominator, the band would be 1.5 standard deviations wide and hold 86.6%.
Two simulations of 300 runs each, using the real day-to-day volatility of ES typical prices, show where the theory breaks:
| Data | Share of CCI(20) readings inside -100 to +100 |
|---|---|
| Analytic, independent normal values, mean deviation | 76.9% |
| Analytic, independent normal values, standard deviation | 86.6% |
| Simulation, each typical price drawn independently | 77.3% |
| Simulation, typical prices following a random walk | 58.3% |
| Measured, 252 real ES sessions | 59.1% |
When each bar is drawn independently, the constant does what Lambert said, and 77.3% of readings land inside the band. Make price a random walk, so each bar starts where the last one ended, and the share drops to 58.3%. Real ES data landed at 59.1%, almost on top of the random walk.
The constant is not wrong. The 70% to 80% figure simply describes data that does not trend. Real prices inside an overlapping 20-bar window are correlated, so the latest bar strays further from the average than independent data would, and more readings spill past the thresholds.
CCI Readings by Setting on ES
The same count across five lookbacks, on the 252 daily ES sessions from November 3, 2025 to November 3, 2026:
| CCI setting | Inside -100 to +100 | Above +100 | Below -100 | Lowest reading | Highest reading | Readings beyond +/-200 |
|---|---|---|---|---|---|---|
| CCI(10) | 56.7% | 21.0% | 22.2% | -290.97 | 238.95 | 7 |
| CCI(14) | 61.1% | 19.0% | 19.8% | -245.17 | 238.47 | 9 |
| CCI(20) | 59.1% | 20.6% | 20.2% | -214.65 | 217.10 | 7 |
| CCI(30) | 60.3% | 25.0% | 14.7% | -238.94 | 253.77 | 10 |
| CCI(50) | 57.9% | 30.6% | 11.5% | -251.12 | 249.85 | 14 |
ChartSchool notes that a shorter CCI should hold fewer readings inside the band and a longer one more. On this year of ES, that tidy relationship did not show up: every setting sat between 56.7% and 61.1%. The longer settings mostly shifted readings toward the upside, because a rising market stays above a slow average for longer.
The practical takeaway: on ES, a CCI indicator reading beyond +/-100 happened on roughly four sessions in ten. That is ordinary, not extreme. The +/-200 band was far rarer, with 7 sessions out of 252 on CCI(20).
CCI Buy and Sell Signals From Lambert's Rule

Lambert's published CCI indicator buy and sell signals are mechanical. Buy when CCI moves above +100 and close the position when it moves back below +100. Sell short when CCI moves below -100 and cover when it moves back above -100. Because readings are supposed to sit inside the band 70% to 80% of the time, Lambert expected a signal to be in force only 20% to 30% of the time.
Here is that rule run on daily ES bars, with these assumptions:
- CCI(20) on the ES continuous futures series, signals taken at the daily close and filled at that close.
- A cost of 2 ticks per round trip (0.50 index points), standing in for slippage; commissions are left out because they vary by account.
- Dollars shown for one Micro E-mini S&P 500 (MES) contract, which moves $5 per index point.
- Window: November 3, 2025 to November 3, 2026, 252 sessions. One short opened on October 30, 2026 was still open at the end and is left out.
- The continuous series is spliced at each quarterly roll without back-adjustment, so a few bars carry the jump between contract months. That affects the rule and the buy-and-hold comparison alike.
CCI(20) Signal Ledger on Daily ES Futures
| Entry session | Side | Exit session | Sessions held | Net points | Net dollars on one MES |
|---|---|---|---|---|---|
| 2025-11-14 | short | 2025-11-24 | 6 | 33.50 | 167.50 |
| 2025-12-22 | long | 2025-12-30 | 5 | 13.50 | 67.50 |
| 2026-01-20 | short | 2026-01-22 | 2 | -116.00 | -580.00 |
| 2026-01-27 | long | 2026-01-29 | 2 | -16.25 | -81.25 |
| 2026-02-04 | short | 2026-02-09 | 3 | -77.50 | -387.50 |
| 2026-02-13 | short | 2026-02-18 | 2 | -44.25 | -221.25 |
| 2026-03-03 | short | 2026-03-04 | 1 | -51.75 | -258.75 |
| 2026-03-06 | short | 2026-03-10 | 2 | -44.00 | -220.00 |
| 2026-03-11 | short | 2026-03-17 | 4 | 57.25 | 286.25 |
| 2026-03-18 | short | 2026-03-24 | 4 | 19.50 | 97.50 |
| 2026-03-26 | short | 2026-04-01 | 4 | -93.25 | -466.25 |
| 2026-04-08 | long | 2026-04-23 | 11 | 319.25 | 1,596.25 |
| 2026-05-05 | long | 2026-05-18 | 9 | 138.00 | 690.00 |
| 2026-05-26 | long | 2026-06-03 | 6 | 34.25 | 171.25 |
| 2026-06-09 | short | 2026-06-12 | 3 | -42.75 | -213.75 |
| 2026-07-06 | long | 2026-07-07 | 1 | -40.75 | -203.75 |
| 2026-07-10 | long | 2026-07-13 | 1 | -57.75 | -288.75 |
| 2026-07-15 | long | 2026-07-16 | 1 | -37.50 | -187.50 |
| 2026-07-23 | short | 2026-07-31 | 6 | -74.75 | -373.75 |
| 2026-08-03 | long | 2026-08-14 | 9 | 176.25 | 881.25 |
| 2026-09-01 | short | 2026-09-03 | 2 | -112.50 | -562.50 |
| 2026-09-09 | short | 2026-09-17 | 6 | 3.25 | 16.25 |
| 2026-09-21 | long | 2026-09-24 | 3 | -67.00 | -335.00 |
| 2026-09-25 | long | 2026-09-28 | 1 | -57.50 | -287.50 |
| 2026-10-06 | long | 2026-10-08 | 2 | -58.25 | -291.25 |
| 2026-10-12 | long | 2026-10-13 | 1 | -2.75 | -13.75 |
| 2026-10-16 | short | 2026-10-20 | 2 | -51.50 | -257.50 |
| 2026-10-23 | short | 2026-10-26 | 1 | -55.25 | -276.25 |
CCI Signal Results Against Buy and Hold
Lambert's CCI(20) rule closed 28 trades on daily ES bars from November 3, 2025 to November 3, 2026, 13 long and 15 short, and was in the market for 100 of the 252 sessions. It lost 306.50 points after costs, or $1,532.50 on one MES. Only 32.1% of trades were winners. Over the same window, simply holding the contract gained 714.00 points, from 6,882.75 to 7,596.75.
The best trade, a long from April 8 to April 23, 2026, made 319.25 points. Without it, the year would have lost 625.75 points. The worst, a short from January 20 to January 22, lost 116.00. A result that leans on one trade is a result you should not size against.
End dates matter more than most backtests admit. Run on the 252 sessions ending September 15, 2026, the same rule finished 108.00 points positive. The 21 trades from November 14, 2025 to September 1, 2026 are identical in both windows to the quarter point. The earlier window simply opened with three longs in autumn 2025 that netted 71.50 points and stopped before the run of losing trades from late September 2026. Same rule, same data source, different end date, opposite sign.
How Reliable Is the CCI Indicator
How reliable the CCI indicator is depends on what you compare it with. A losing year proves little alone, so the 28 daily CCI(20) trades that Lambert's rule produced on ES from November 2025 to November 2026 (a net loss of 306.50 points) were tested against chance: 4,000 random sets of 28 trades, each trade with the same side and the same holding period as a real one, entered on a random session in the same window and charged the same cost.
| Comparison | Trades | Total net points | Note |
|---|---|---|---|
| Lambert rule, CCI(20) | 28 | -306.50 | Ranked at the 28.2nd percentile of random outcomes |
| Random benchmark, median of 4,000 sets | 28 | 12.31 | Same sides, holding periods and cost |
| Random benchmark, 5th percentile | 28 | -900.53 | The unlucky tail of the same design |
| Random benchmark, 95th percentile | 28 | 925.97 | The lucky tail of the same design |
The real rule did worse than 71.8% of random trade sets. That is not proof the CCI is harmful. The random spread runs from -900.53 to 925.97 points, which shows how much a 28-trade sample can swing on luck alone. It does mean this year gave no evidence that crossing +/-100 told you anything a coin flip would not.
CCI Whipsaw Losses on Fast Round Trips
CCI whipsaws had a clear shape when Lambert's CCI(20) rule ran on a year of daily ES bars (November 2025 to November 2026). Of its 28 trades, 14 closed within two sessions, and those 14 lost 746.00 points between them. The other 14 made 439.50. Spells above +100 lasted a median of 2 sessions (longest 11), and spells below -100 a median of 3 (longest 6).
That is the whipsaw every guide warns about, priced. Both the entry and the exit are one-bar events, so a single reversal bar turns a fresh signal into a closed loss. The rule exits on the first close back inside the band, which is the bar where the reading has stopped confirming anything.
The 43,297-Trade CCI Study in Context
A backtest of 43,297 trades, summarized on Wikipedia, reports that CCI(50) crossing up through -100 on a daily S&P 500 chart returned 1,108% from 2003 to 2023 against 555% for buy and hold. The same rule on this year of ES (long on a close back above -100, exit on a close below -100) produced 3 trades held for an average of 70 sessions and made 943.75 points.
Three trades is not evidence. A rule that buys after a dip and then holds for months mostly collects the market's long-run drift, which is why it can look excellent in a rising decade. It is a long-term timing filter, not a short-term signal, and it is unusable on any account that must be flat every day.
If you want to test your own CCI rule rather than trust either result, the method matters more than the indicator.
Related lesson: Backtesting a trading strategy
CCI Crossovers at Zero and at the Thresholds
CCI indicator crossovers come in two kinds, and they mean different things.
- Zero-line crossover: CCI crossing above zero means the typical price has moved above its own average. A bullish zero-line crossover is the first sign that buyers have pushed price back above the recent mean.
- Threshold crossover: CCI crossing above +100 (or back above -100 from below) is a larger move relative to the window's noise. ChartSchool notes that requiring +100 and -100 instead of zero reduces whipsaws, at the cost of later entries.
So a bullish CCI crossover means one of two things: price has reclaimed its average (zero line) or has moved unusually far above it (+100). Neither says how far the move will run.
The zero-line version was measured as a stop-and-reverse rule on the same 252 ES sessions: go long on a close above zero, flip short on a close below zero. It made 34 trades, won 8.8% of them and lost 1,819.75 points after costs. That is the zero-line whipsaw ChartSchool describes. In a market that chops around its own average, the zero line is crossed constantly, 35 times in this year on CCI(20).
A crossover is an observation. It becomes a trade only when something else, such as trend direction, a price level or a defined stop, gives it a reason to work.
Best CCI Settings and Period
There is no best CCI indicator setting. The default is 20 periods, the setting ChartSchool and Investopedia both use, but the period is better treated as a trade-frequency control than a quality dial. Here is Lambert's rule run at five settings on the same 252 daily ES sessions (November 3, 2025 to November 3, 2026), with identical costs:
| Setting | Closed trades | Net points after cost | Net dollars on one MES | Win rate | Average sessions held | Zero-line crossings |
|---|---|---|---|---|---|---|
| CCI(10) | 43 | -786.04 | -3,930.20 | 25.6% | 2.5 | 35 |
| CCI(14) | 31 | -424.54 | -2,122.70 | 22.6% | 3.1 | 35 |
| CCI(20) | 28 | -306.50 | -1,532.50 | 32.1% | 3.6 | 35 |
| CCI(30) | 20 | -123.10 | -615.50 | 25.0% | 4.8 | 31 |
| CCI(50) | 17 | -244.25 | -1,221.25 | 23.5% | 6.0 | 21 |
All five settings lost money on this year of ES. Shorter settings traded more and lost more: CCI(10) produced 43 trades and lost 786.04 points. Longer settings cut the trade count but did not turn the result positive.
The figures with odd cents come from quarterly expiry days, when the continuous series prints the expiring contract's final settlement price instead of a tick-rounded close.
What a CCI period actually changes:
- Shorter (10 to 14): more signals, shorter holds, more cost and more whipsaw per month.
- Default (20): the most common reference setting, so it is the one other traders are watching.
- Longer (30 to 50): fewer signals, longer holds, a line that leans in the direction of the bigger trend.
If you test a setting, pick it on one stretch of data and judge it on another. A period chosen because it looked best on the same bars it was tested on is a curve fit, not a setting.
CCI Divergence and What Confirmation Adds
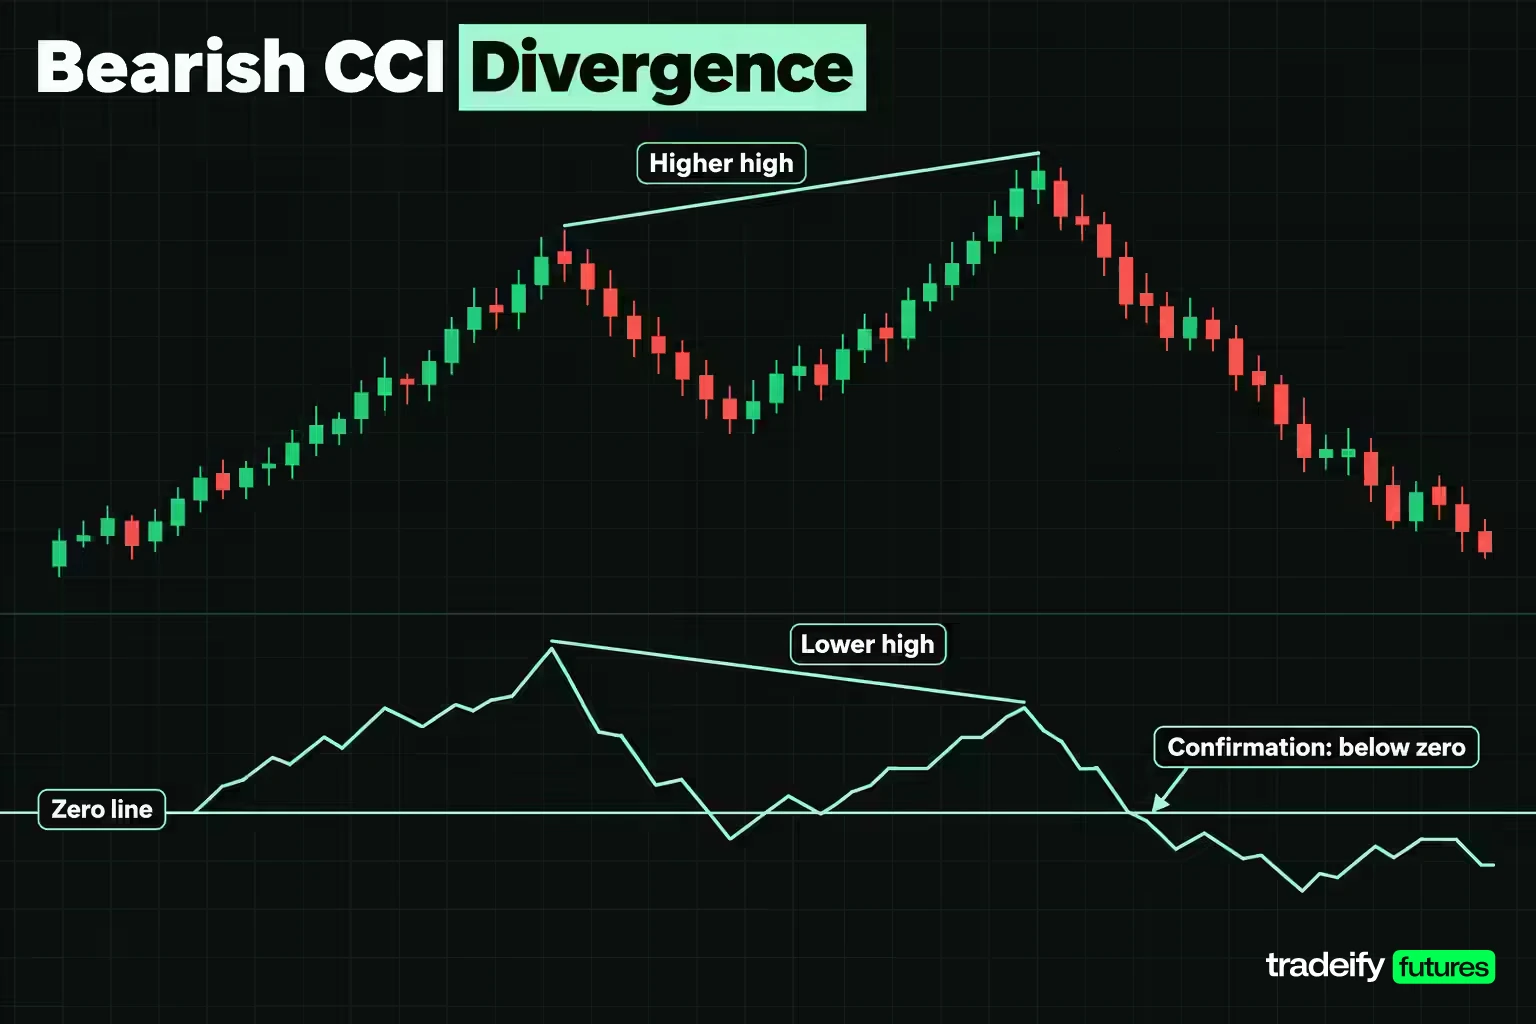
CCI divergence is a disagreement between price and the CCI indicator at two comparable swing points. A bearish divergence is a higher high in price with a lower high in CCI. A bullish divergence is a lower low in price with a higher low in CCI. ChartSchool's guidance is that divergence needs confirmation: a CCI break below zero for a bearish divergence, or above zero for a bullish one.
To see how often CCI divergence pays, 252 daily ES sessions (November 2025 to November 2026) were scanned for divergences between consecutive swing points up to 60 sessions apart, where a swing high or low is a bar higher (or lower) than the four bars on each side. Because a swing point is only known four bars later, outcomes were measured from that fourth bar, over the next 10 sessions.
- Bearish divergences: 5. Four of the five were confirmed by CCI closing below zero within 10 sessions. Price was lower 10 sessions later in only 2 of the 5.
- Bullish divergences: 2. Both were confirmed, and price was higher 10 sessions later in both.
The failure case is the most instructive. The bearish divergence between April 17 and May 14, 2026 never confirmed, and price rose 149.25 points over the next 10 sessions. The one that followed (May 14 to June 1) did confirm and still saw price rise 140.75 points. In a strong uptrend, bearish divergences keep printing while price keeps climbing, which is exactly what ChartSchool warns about.
Seven divergences in a year is too few to size against. Treat a CCI divergence as a reason to tighten a stop or skip a fresh entry in the trend direction, not as a reversal trigger.
Is the CCI Leading or Lagging
The CCI indicator is a lagging calculation. Every input is a price that has already traded, and the reading is anchored to a 20-bar average, so a large single bar only partly shifts it. Investopedia notes that a move to +100 or -100 can come after price has already had its run.
ChartSchool describes two uses that sound like leading behavior. As a coincident indicator, a surge through +100 or -100 reflects strong price action happening now. As a leading indicator, overbought or oversold readings and divergences can hint that momentum is fading before price turns. Both are still built from past bars. The "leading" part is an interpretation: on a year of daily ES data, only 2 of 5 bearish CCI divergences were followed by lower prices 10 sessions later.
The lag itself is not the main cost. When Lambert's rule ran on a year of daily ES bars, the losses clustered in trades that exited on the first close back inside the band, one or two bars after entry. That is where a lagging line hurts most.
CCI vs RSI and the Stochastic Oscillator
CCI, RSI and the stochastic oscillator are often treated as interchangeable momentum oscillators. They are built from different raw material, which changes what their levels mean.
| Measure | Built from | Range | Default lookback | Usual extreme levels | Main weakness |
|---|---|---|---|---|---|
| CCI | Typical price versus its own SMA, scaled by mean deviation | Unbounded | 20 | +100 and -100, or +200 and -200 | Levels differ by instrument, so readings need each market's own history |
| RSI | Average gains versus average losses | 0 to 100 | 14 | 70 and 30 | Can stay extreme for long stretches in a strong trend |
| Stochastic oscillator | Close relative to the high-low range of the lookback | 0 to 100 | 14, with a 3-period %D | 80 and 20 | Can stay near the top or bottom of its range during trends |
Which is better, RSI or CCI? Neither, in general. RSI is bounded, so its levels are comparable across markets and over time. CCI is unbounded and measures distance from an average, so it shows the size of an extreme rather than squeezing it into 0 to 100. Traders who want a consistent scale tend to prefer RSI. Traders who want to see how stretched price is in deviation terms tend to prefer CCI.
Running both rarely adds much. They react to the same price moves, so two oscillators agreeing is closer to one opinion counted twice than to real confirmation.
Related lesson: Relative strength index RSI
Combining the CCI With Other Indicators
Combining the CCI with other indicators works when the second tool removes a failure the CCI actually has. On a year of daily ES signals under Lambert's rule (November 2025 to November 2026), the obvious failure was shorting a rising market: the 15 shorts lost 650.00 points between them while the index climbed.
ChartSchool's own CCI scans pair the indicator with a 200-day moving average: CCI turns are used in the direction of the long-term trend. That filter was tested on the same 252 sessions. Longs were allowed only when the close was above its 200-day SMA, shorts only when it was below.
| Version on CCI(20) | Closed trades | Net points after cost | Win rate | Sessions in the market |
|---|---|---|---|---|
| Lambert rule, no filter | 28 | -306.50 | 32.1% | 100 |
| Lambert rule with a 200-day SMA trend filter | 15 | 269.75 | 40.0% | 60 |
The filtered version made 269.75 points on 15 trades. Before treating that as a fix, read the condition behind it. ES closed above its 200-day average on 238 of the 252 sessions, so the filter mostly said "only take longs." It helped because this was a rising year. In a falling or sideways year, the same filter would have behaved differently, and the test cannot tell you how.
Other common pairings, each with a specific job:
- Average true range (ATR): sets stop distance by current volatility, so a CCI signal arrives with a defined risk.
- ADX: measures trend strength, which helps separate a +100 breakout in a trending market from one in a range.
- Price levels: support, resistance and prior highs give the CCI signal a place where the idea is clearly wrong.
Related lesson: Average true range ATR
CCI Trading Strategies and Position Sizing
CCI indicator trading strategies fall into three families. Each answers a different question, and each fails in a recognizable way.
- Trend threshold (Lambert): trade in the direction of a break through +100 or -100 and exit on the return. It catches strong pushes and whipsaws in ranges; on a year of daily ES bars it closed 28 trades with 32.1% winners.
- Pullback in a trend: Investopedia describes waiting, after CCI moves above +100, for a pullback and then a rally in both price and CCI before buying. This trades the second push instead of the first bar, which cuts the one-bar whipsaw at the cost of missing some moves.
- Extreme reversion: fade a move back inside +/-200. ChartSchool notes that waiting for the cross back inside reduces whipsaws, and that the approach is not foolproof.
The reversion idea was tested on the ES year: short when CCI(20) fell back below +200, buy when it rose back above -200, exit when CCI reached zero. It closed 6 trades and won 66.7% of them, yet lost 277.75 points. One short opened on April 10, 2026 stayed open for 39 sessions while the market rallied and lost 545.75 points. A high win rate with no stop can hide one loss that erases every winner.
Turning a CCI Signal Into a Sized Trade
Every one of those strategies needs a stop, a target and a size before the signal is worth anything. Here is the arithmetic with round, illustrative numbers. Imagine a long signal on ES at 7,600 with a daily average true range of about 100 points (ES's 14-day ATR was 96.59 at the November 3, 2026 close). A stop 1.5 ATR away is 150 points, or 600 ticks.
On one MES contract, at $5 per point and $1.25 per 0.25-point tick, 150 points is $750 of risk, plus a 0.50-point cost that makes it $752.50.
| Target | Target price | Net reward points | Net risk per MES | Break-even win rate | MES contracts on a $1,000 risk budget | Expected value per trade at a 40% win rate |
|---|---|---|---|---|---|---|
| 1R | 7,750 | 149.50 | $752.50 | 50.17% | 1 | -$152.50 |
| 2R | 7,900 | 299.50 | $752.50 | 33.44% | 1 | $147.50 |
| 3R | 8,050 | 449.50 | $752.50 | 25.08% | 1 | $447.50 |
The direction call is not the point of the table. The point is that a daily-chart CCI signal with a volatility stop costs about $752.50 per MES, so a $1,000 risk budget buys one contract and a $500 budget buys none. Seeing "-170, oversold, buy" and clicking without this math is sizing by feel.
The break-even column is the bar a CCI strategy has to clear. A 32.1% win rate, which is what Lambert's CCI(20) rule managed on a year of daily ES bars, needs the average winner to be about 2.1 times the average loser just to break even. Rules that exit on the first close back inside the band rarely let winners run that far.
Related lesson: Position sizing
Using the CCI Indicator for Day Trading
Using the CCI indicator for day trading means running it on intraday bars, where the number of signals and the cost per signal both go up. To see what that does, Lambert's rule was run on 5-minute ES bars across 49 regular sessions, from August 27 to November 4, 2026:
- CCI(20) computed on the full 5-minute series, including overnight bars.
- Entries allowed on bars closing from 9:35 AM to 3:45 PM ET, and every open trade closed by 3:55 PM ET, so nothing was held overnight.
- The same 0.50-point round-trip cost per trade.
| Measure on 5-minute ES bars | Result |
|---|---|
| CCI(20) readings inside -100 to +100 | 58.3% |
| Closed trades | 361 |
| Trades per session | 7.4 |
| Gross points before cost | 12.25 |
| Total cost at 0.50 points per trade | 180.50 |
| Net points after cost | -168.25 |
| Net dollars on one MES | -$841.25 |
| Win rate | 31.6% |
| Trades closed within two bars (10 minutes) | 153, net -682.75 points |
What the 5-Minute CCI Test Means for Day Traders
Before costs, the 5-minute CCI indicator rule made 12.25 points across 361 trades, which is close to nothing. The 0.50-point cost per trade then turned it into a 168.25-point loss. The intraday CCI kept 58.3% of readings inside the band, close to the daily figure, so the indicator was not behaving differently on 5-minute bars. The trade count was the problem: a +/-100 signal fired roughly seven times a session, and each one paid the round-trip cost.
This matches the criticism summarized on Wikipedia, which notes that CCI on 5-minute charts is not recommended because of poor performance. If you use the CCI indicator intraday, treat it as context (is price stretched relative to its recent average, and in which direction is the session leaning) and take entries from price structure with a defined stop, rather than trading every crossing.
On our Tradeify accounts, every position must be closed by 4:45 PM ET and nothing can be held overnight or over a weekend. So a daily-chart CCI indicator rule that holds trades for several sessions cannot be run as written on a Tradeify account; the intraday form, flat before the close, is the one that fits our rules.
CCI for Futures, Stocks, Forex and Commodities
The CCI indicator works the same on any market with a high, low and close, because the formula only compares a bar with its own recent history. What changes between markets is the level that counts as extreme.
ChartSchool points out that the CCI range for a broad index fund such as SPY is usually smaller than for a single stock such as Google. Investopedia gives the example of a stock that tends to reverse near +200 and -150 next to a commodity that reverses near +325 and -350. So before trusting +100 or +200 on a new market, look at where that market's CCI has peaked and bottomed over a year or more.
Which indicator is best for commodity trading? No single one. The CCI was designed for commodity cycles, which makes it a natural fit for seasonal or range-bound contracts, but it inherits the same whipsaw risk in trending markets. Commodity traders usually get more from a combination: a trend measure for direction, ATR for stop distance, and CCI or RSI for timing within that trend.
CCI Indicator FAQ
What does a bullish CCI crossover mean?
A bullish CCI crossover means the indicator has moved up through a reference level. Above zero, it means the typical price has climbed back above its recent average. Above +100, it means price is unusually far above that average relative to normal noise, which Lambert treated as the start of a strong uptrend.
Which is better, RSI or CCI?
Neither is better in general, because they measure different things. RSI is bounded from 0 to 100 and compares average gains with average losses, so its levels are consistent across markets. CCI is unbounded and measures distance from an average, so it shows how stretched price is but needs each market's own history to judge extremes.
What is the best CCI setting?
The default is 20 periods. In a test of Lambert's rule on a year of daily ES data, settings of 10, 14, 20, 30 and 50 all lost money, with shorter settings trading more and losing more. Treat the period as a frequency control and test it on data you did not use to choose it.
Is the CCI indicator lagging?
Yes. CCI is built from past prices and a moving average, so it confirms moves after they start. It can hint at fading momentum through divergence, but that hint is often early or wrong in a strong trend.
What is the most successful trading indicator?
No indicator, the CCI included, is reliably the most successful on its own. Results depend far more on the market, timeframe, costs, stop placement and position size than on the indicator chosen.
This guide is educational, not investment advice, and its measurements use historical ES prices rather than any account's results, so past indicator behavior does not predict future results. Futures are leveraged and losses can exceed what you expect, and evaluation and funded prop accounts are simulated, with fills that do not reproduce live market liquidity.


