



TL;DR: SMA vs EMA comes down to weighting: a 20 SMA gives each bar 5.00%, a 20 EMA gives the newest bar 9.52%. Both lines average data 10.5 bars old at 20 periods, so the EMA turns sooner without lagging less on average. The EMA whipsaws more in ranges, and at 200 periods the two are nearly identical. Use the SMA for levels and long filters, the EMA for short-horizon timing.
The SMA vs EMA question usually gets a one-line answer: the exponential moving average is faster, the simple moving average is smoother. That answer is not wrong, but it hides the part that changes your trading. If you have ever swapped a 20 SMA for a 20 EMA after a rough week, hoping the faster line would have caught the turn, this is worth knowing first. Both lines lag, they lag by the same average amount at the same length, and on a long setting the difference almost disappears.
What actually differs is how each line spreads its weight across the bars it averages. Once you can see that, choosing between them stops being a matter of taste. It becomes a question of what job you want the line to do on your chart, and what kind of mistake you would rather live with.
What a Simple Moving Average (SMA) Is
A simple moving average is the arithmetic mean of the last N prices, usually closing prices. A 20-period SMA adds the last 20 closes and divides by 20, then repeats the calculation on every new bar as the oldest close drops out of the window.
Every bar inside the window carries the same weight. On a 20-period SMA each close counts for 5.00% of the value, whether it printed this morning or 19 bars ago. The moment a bar leaves the window, its influence goes to zero.
The SMA's purpose in technical analysis is to smooth out bar-to-bar noise so the underlying direction is easier to read. A rising SMA says that, on average, recent prices are higher than the prices they replaced. A falling SMA says the reverse. StockCharts' ChartSchool describes the SMA and the EMA as the two most popular moving averages, with the SMA averaging prices over the chosen timeframe and the EMA giving more weight to recent prices.
Moving averages are usually applied to closes, but the same math works on opens, highs, lows, volume or even another indicator. When a chart says "20 SMA" without anything else, assume 20 closing prices on whatever timeframe the chart shows.
How to Calculate an SMA
The SMA formula is the sum of the closing prices in the window divided by the number of periods.
SMA = (C1 + C2 + ... + CN) / N
Take five hypothetical closes: 5,010, 5,020, 5,015, 5,030 and 5,025. They sum to 25,100, and 25,100 divided by 5 is 5,020. That is the five-period SMA for the fifth bar.
On the next bar, the 5,010 close drops out and the new close comes in. If the new close were also 5,010, the SMA would not move at all, because the same value left and arrived. This drop-off effect matters in practice. An SMA can change direction because of a bar that left the window, not because of anything the current bar did. A sharp move from 20 bars ago can make a 20-period SMA tick up or down on a quiet day, and traders who forget this read meaning into a turn that is pure arithmetic.
On a chart, "20 SMA" therefore means the simple average of the last 20 closes on that chart's timeframe. A 20 SMA on a 5-minute chart covers 100 minutes of trading. A 20 SMA on a daily chart covers roughly a month of sessions.
What an Exponential Moving Average (EMA) Is
EMA stands for exponential moving average. In charting software, where indicators are often called "studies", an EMA study is the same thing: a moving average that gives more weight to the most recent prices and progressively less to older ones.
The weighting falls away exponentially, which is where the name comes from. Charles Schwab's explainer gives the 10-period case: the newest bar counts as 18.2% of the value and the oldest bar in the window only about 3%.
The other defining feature is memory. An EMA does not use a fixed window. Each new EMA value is built from the previous EMA value, so a given bar's EMA depends on every calculation that came before it. Old prices never fully drop out. They fade. Schwab notes that only about 87% of the data behind an EMA comes from the bars inside its stated length, and that beyond about two times the length the weighting is small enough to ignore.
The purpose is the same as the SMA's, to smooth price into a readable direction, with one deliberate tilt: the EMA is built to react to new information sooner.
How to Calculate an EMA
The EMA calculation has three steps, as ChartSchool lays them out.
- Seed the first value. An EMA has to start somewhere, so the first "previous EMA" is a simple moving average of the first N closes.
- Calculate the multiplier. Multiplier = 2 / (N + 1). For a 10-period EMA that is 2 / 11, which is 0.1818, or 18.18%.
- Update on every bar. EMA = (Close minus previous EMA) x multiplier + previous EMA.
A one-step example with hypothetical prices: the previous 10-period EMA is 5,000 and the new close is 5,022. The close is 22 points above the line, and 22 x 2/11 is exactly 4. The new EMA is 5,004. The line moves 18.18% of the way toward the new close and keeps the other 81.82% of its old value.
Why the EMA Seed Matters
The seed never fully leaves an EMA. It decays. On a 10-period EMA, about 13.44% of the value still traces back to the seed 10 bars later, 1.81% after 20 bars and 0.24% after 30 bars. A 20-period EMA keeps 13.51% of its seed after 20 bars and 1.83% after 40.
That is why two platforms can print slightly different EMA values for the same symbol: they started the calculation at different bars. It also means an EMA on a chart with very little history loaded reflects your starting point more than the market. A practical rule is to load at least three times the period length before the first bar you intend to act on.
SMA vs EMA Key Differences
The SMA vs EMA comparison works best across specific properties rather than a single "faster or slower" label. All figures here are for the same period length.
| Property | SMA | EMA |
|---|---|---|
| Calculation | Sum of the last N closes divided by N | Previous EMA plus a share of the gap to the new close |
| Weight on the newest bar | 1 / N, so 5.00% at 20 periods | 2 / (N + 1), so 9.52% at 20 periods |
| Older data | Drops to zero when it leaves the window | Fades but never fully leaves |
| Average age of the data | (N + 1) / 2 bars | (N + 1) / 2 bars, the same |
| Reaction to a new move | Slower to change direction | Faster to change direction |
| Reaction to one extreme bar | Smaller jump, then a second jump when the bar leaves | Larger jump, then a gradual fade |
| Behaviour in a range | Fewer turns at longer settings | More turns, more whipsaws |
| Common use | Reference levels and long-term trend filters | Short-horizon timing and indicator inputs such as MACD |
Two rows carry most of the practical weight. The newest-bar weight is about double for the EMA at any period, which is why it turns sooner. The average age row is identical, which is why "the EMA has no lag" is a myth. Schwab sums up the trade-off: the EMA tracks price more closely, but it often gets whipsawed, while the SMA's built-in lag smooths price action into a steadier trend read.
Lag and Responsiveness in SMA and EMA Lines
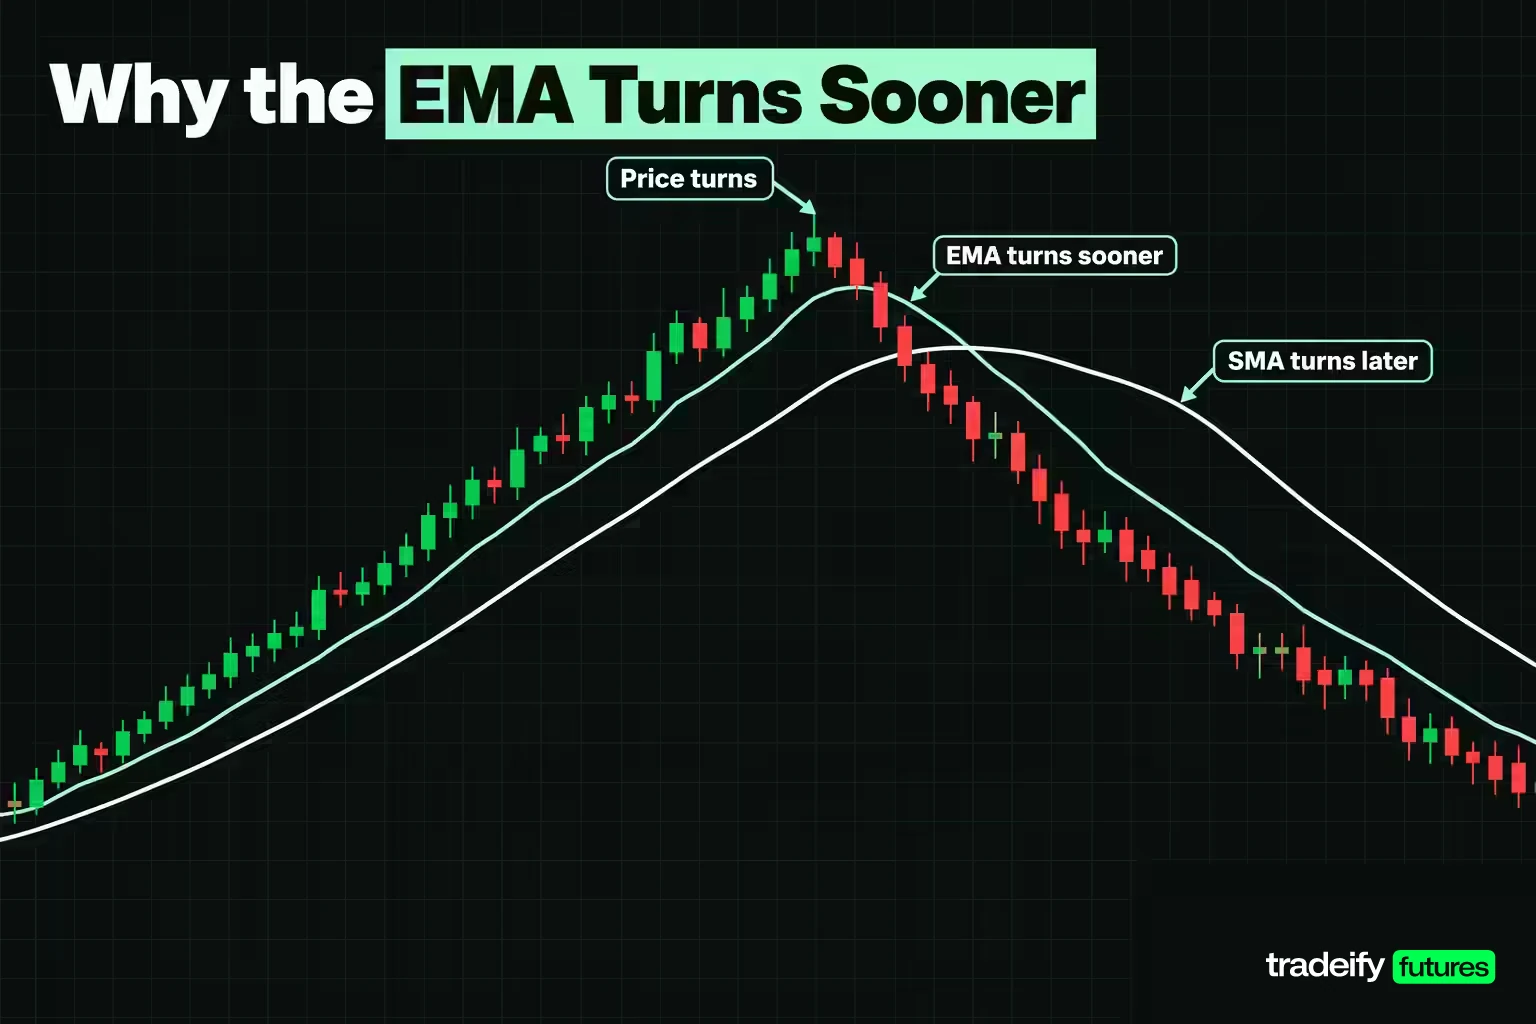
Lag is the gap between a turn in price and the turn in the line. Every moving average has it, because every moving average is built from bars that have already closed.
Robert Nau's forecasting notes at Duke University put a number on it. The average age of the data in an m-period simple moving average is (m + 1) / 2 periods, and the line tends to lag turning points by about that much. For exponential smoothing with smoothing factor alpha, the average age is 1 / alpha.
Charting platforms set alpha to 2 / (N + 1). Flip it and 1 / alpha becomes (N + 1) / 2, the same as the SMA. A 20-period SMA and a 20-period EMA both work with data that is 10.5 bars old on average. Nau makes the same point with a 9-term SMA and alpha of 0.2: both have an average age of 5, but the exponential version puts more weight on the last three values and does not entirely forget older ones.
So the EMA does not lag less on average. It distributes the same average lag differently, front-loading the newest bars and keeping a thin tail of old ones. That front-loading is what makes it change direction sooner after a turn.
Newest-Bar Weight by Period
The table shows how the two weightings compare at common settings. The EMA always puts close to double the SMA's weight on the newest bar, yet both lines keep the same average age.
| Period | EMA multiplier | EMA weight on newest bar | SMA weight on newest bar | EMA to SMA ratio | EMA weight inside the period | EMA half-life in bars | Average data age |
|---|---|---|---|---|---|---|---|
| 5 | 0.3333 | 33.33% | 20.00% | 1.67 | 86.83% | 1.7 | 3 bars |
| 9 | 0.2000 | 20.00% | 11.11% | 1.80 | 86.58% | 3.1 | 5 bars |
| 10 | 0.1818 | 18.18% | 10.00% | 1.82 | 86.56% | 3.5 | 5.5 bars |
| 20 | 0.0952 | 9.52% | 5.00% | 1.90 | 86.49% | 6.9 | 10.5 bars |
| 50 | 0.0392 | 3.92% | 2.00% | 1.96 | 86.47% | 17.3 | 25.5 bars |
| 100 | 0.0198 | 1.98% | 1.00% | 1.98 | 86.47% | 34.7 | 50.5 bars |
| 200 | 0.0100 | 1.00% | 0.50% | 1.99 | 86.47% | 69.3 | 100.5 bars |
Three things stand out. The ratio climbs toward 2 but never reaches it, so "roughly double" is accurate at every length. The share of EMA weight inside the stated period barely moves, from 86.83% at 5 periods to 86.47% at 200, which matches Schwab's "about 87%". And the period changes responsiveness far more than the type does: going from a 20-period to a 10-period EMA nearly doubles the newest-bar weight, from 9.52% to 18.18%, which is the same size of change as switching a 20-period SMA to a 20-period EMA.
When the responsiveness trade-off matters depends on the setting. At 5 to 20 periods the type does real work in your signals. At 200 periods the EMA's newest-bar weight is 1.00% against the SMA's 0.50%, and no single bar moves either line much.
Why Every Moving Average Is a Lagging Indicator
Both the SMA and the EMA are lagging indicators. ChartSchool puts it bluntly: moving averages identify trend reversals as they occur at best, or after they occur at worst. Neither line can lead price, because neither contains any information that price has not already printed.
The difference between them is degree, not category. The EMA's heavier weight on recent bars lets it turn a bar or two sooner after a clean reversal. It does not let it see the reversal coming.
That has a direct consequence for signal timing. A moving-average signal confirms that a move has already happened. If you buy on an EMA turn after a decline, you are buying after the low, and the distance from the low to your entry is the price you pay for confirmation. A trader who expects the line to call the turn ends up frustrated by every entry and starts chasing earlier, unconfirmed signals. A trader who treats the line as confirmation plans for that distance in the stop and the target before the trade.
SMA vs EMA on the Same 22 Bars
A worked series shows the difference in timing better than any definition. The closes here are hypothetical, 22 bars that drift near 5,000, drop to a low close of 4968 at bar 14, then recover to 5040. Both lines use 10 periods, and the EMA is seeded with the bar-10 SMA of 5005.00, so both start from the same value.
| Bar | Close | SMA 10 | EMA 10 | Close minus SMA | Close minus EMA |
|---|---|---|---|---|---|
| 10 | 5012 | 5005.00 | 5005.00 | 7.00 | 7.00 |
| 12 | 4986 | 5003.00 | 5000.50 | -17.00 | -14.50 |
| 14 | 4968 | 4996.90 | 4990.80 | -28.90 | -22.80 |
| 16 | 4980 | 4991.10 | 4986.04 | -11.10 | -6.04 |
| 17 | 4991 | 4989.80 | 4986.94 | 1.20 | 4.06 |
| 18 | 5003 | 4989.10 | 4989.86 | 13.90 | 13.14 |
| 19 | 5014 | 4989.90 | 4994.25 | 24.10 | 19.75 |
| 20 | 5024 | 4991.10 | 4999.66 | 32.90 | 24.34 |
| 22 | 5040 | 5000.00 | 5011.95 | 40.00 | 28.05 |
The EMA dropped faster during the decline and bottomed at 4986.04 on bar 16. It turned up on bar 17. The SMA kept falling until its low of 4989.10 on bar 18 and did not turn up until bar 19, two bars later. By bar 22 the EMA sat at 5011.95 and the SMA at 5000.00, 11.95 points apart.
Reading the 22-Bar SMA vs EMA Result
In the 22-bar series, price closed above both lines for the first time after the low on the same bar, bar 17. So in this series the EMA's advantage showed up in the slope of the line, not in the price cross. That distinction matters more than the type. If your rule is "the line turns up", the EMA gave the signal two bars sooner. If your rule is "price closes above the line", both types gave it together, and switching averages would have changed nothing.
Notice also what happened during the drop. On bar 14 the close sat 28.90 points under the SMA and 22.80 under the EMA. The EMA hugged price more closely on the way down, just as it did on the way up. That is the same property in both directions: closer tracking, earlier turns, and less room between price and the line.
How Volatility Affects SMA and EMA Signals
Volatility changes how each moving average behaves, and the clearest way to see it is a single extreme bar.
Take a hypothetical flat market closing at 5,000 every bar, with one spike close at 5030 on bar 16. A 10-period SMA jumps 3.00 points to 5003.00, sits there for exactly 10 bars, then drops 3.00 points back to 5000.00 on bar 26 when the spike leaves the window. A 10-period EMA jumps further, 5.45 points to 5005.45, then fades steadily: 5002.00 by bar 21 and 5000.49 by bar 28.
Each line reacts badly in its own way:
- The EMA overreacts on the day of the spike, because it gives the newest bar 18.18% of the weight instead of 10.00%.
- The SMA reacts twice, once when the spike arrives and once when it leaves 10 bars later, and that second move happens on a bar where nothing occurred.
- The EMA never produces that second, phantom move. The spike just fades.
SMA and EMA Turns in a Choppy Range
Ranges are where the faster line usually pays for its speed. A hypothetical 40-bar range with closes between 4992 and 5010 produced these counts:
| Setting | SMA turns | EMA turns | Price crossings of each line |
|---|---|---|---|
| 10 periods | 7 | 8 | 9 for both |
| 20 periods | 3 | 6 | 6 for both |
At 10 periods the two were nearly tied. At 20 periods the EMA turned twice as often while price went nowhere. That is one hand-built series, so treat it as an illustration of the mechanism rather than a statistic. The pattern it shows is the one Schwab describes: the EMA moves with price sooner but often gets whipsawed. In volatile, directionless conditions the EMA's extra sensitivity produces more false turns. In a strong trend, the same sensitivity gets you aligned with the move sooner.
The practical takeaway is to count rather than guess. Before trusting either line on a market you trade, count how many times it turned during the last range. That count is the false-signal rate you are signing up for, and it is better learned on a chart than in your account.
Related lesson: Average true range
SMA Advantages and Disadvantages
The simple moving average has clear strengths:
- Easy to calculate and verify. Any two platforms with the same closes produce the same SMA.
- Smoother line at longer settings, which means fewer turns in a range.
- A true average of the window, which ChartSchool says makes the SMA better suited to identifying support and resistance levels.
- The 200-day SMA is widely watched, and a level that many traders watch tends to draw reactions for that reason alone.
Its weaknesses come from the same design:
- Slower to turn after a reversal at the same length, because the newest bar gets only 1 / N of the weight.
- Equal weighting treats a close from 19 bars ago as just as relevant as today's.
- The drop-off effect: an old bar leaving the window can move the line on a day when price did nothing.
EMA Advantages and Disadvantages
The exponential moving average trades smoothness for speed:
- Turns sooner after a reversal, because the newest bar gets roughly double the SMA's weight.
- Tracks price more closely in a trend, so the gap between price and line stays tighter.
- No drop-off effect, since old bars fade rather than vanish.
- Feeds widely used indicators, including MACD, which is built from 12-period and 26-period EMAs.
Its costs:
- More whipsaws in ranges, because a single bar moves the line more.
- Bigger overreaction to one extreme bar.
- Depends on its seed and on how much history is loaded, so values can differ slightly between platforms.
- The formula is recursive, which makes it harder to check by hand.
When to Use an SMA
Reach for the simple moving average when stability matters more than speed:
- Reference levels. When you want a level that price is pulled back to, the 20-day and 200-day SMAs are the common ones. ChartSchool notes a short-term uptrend may find support near the 20-day SMA, and a long-term uptrend near the 200-day SMA.
- Long-term trend filters. A 100-period or 200-period line on a daily chart is a direction filter, not an entry trigger, and the SMA's smoothness suits that job.
- Choppy markets. On a hand-built 40-bar range, a 20-period SMA turned 3 times while the 20-period EMA turned 6, which means fewer signals to filter.
- Matching what others watch. If your thesis is that a level matters because many traders watch it, use the version they watch. ChartSchool calls the 200-day moving average perhaps the most popular, and the 50-day popular for the medium-term trend.
When to Use an EMA
Reach for the exponential moving average when an earlier read on direction is worth more false turns:
- Short-horizon timing. On intraday charts and 5 to 20 period settings, the EMA's earlier turns can matter, because a bar or two is a meaningful share of the move.
- Trending, fast markets. When price is moving with conviction, the EMA keeps closer to price and tells you sooner when momentum fades.
- Trailing a position. A line that hugs price leaves a tighter gap for a trailing exit.
- Indicator inputs. MACD, its signal line and the Percentage Price Oscillator are all EMA-based, so if you use them, you are already using EMAs.
Common Moving Average Periods
There is no single best EMA setting or SMA setting. The right period comes from the timeframe you trade and the job the line has to do. ChartSchool's rough bands are a good starting point:
| Horizon | Typical length | Common settings |
|---|---|---|
| Short-term trend | 5 to 20 periods | 9 EMA, 10 EMA, 20 EMA or SMA |
| Medium-term trend | 20 to 60 periods | 50 SMA or EMA |
| Long-term trend | 100 periods or more | 100 and 200 SMA |
A few settings come up constantly. The 20 SMA is the middle line of Bollinger Bands. The 9-period EMA is the MACD signal line, applied to MACD rather than price, and the 12-period and 26-period EMAs build MACD itself. The 50 and 200 are the classic medium and long-term lines.
Two cautions. First, a period is measured in bars, so a 200-period line on a 1-minute chart covers just over three hours of trading, not a long-term trend. Second, re-running a test with different periods until one looks good produces a setting that fits the past and not much else. Pick the period from the timeframe before you test, and write it down.
SMA vs EMA for Day Trading, Swing Trading and Position Trading
The trading style decides the period first and the type second.
| Style | Typical chart | Usual choice | Why |
|---|---|---|---|
| Scalping and day trading | 1-minute to 15-minute | EMA, 9 to 20 periods | Earlier turns matter when a move lasts minutes |
| Swing trading | 1-hour to daily | 20 EMA for timing, 50 SMA for structure | Mixes a responsive entry line with a steadier level |
| Position trading | Daily to weekly | 50 and 200 SMA | Smoothness and widely watched levels outweigh speed |
For day trading, the EMA's speed is often worth the extra whipsaws, provided you filter them, for example by requiring a close beyond the line rather than a touch. For swing trading, many traders split the work between the two types. For position trading, the type matters least: at 200 periods the two lines are close to the same indicator.
Holding style also has practical limits that have nothing to do with the indicator. Swing and position trades are held overnight and over weekends, which adds gap risk on top of everything a moving average can tell you.
Related lesson: Strategy timeframes
How to Trade With SMA and EMA Lines
Moving averages show up in trading plans in four main roles.
Moving Average as a Trend Filter
The simplest use is direction. ChartSchool gives the classic version: if price is above the 200-day moving average, only take bullish signals, such as price moving back above the 50-day. The long line decides which side you trade; it does not time the entry.
Dynamic Support and Resistance
In a trend, pullbacks often stall near a moving average that other traders watch. Treat the line as an area, not a price. A pullback that pierces the line by a few ticks and closes back above it is still respecting it. A close well beyond the line, followed by a retest from the other side, is a change in behaviour.
Stop Placement
A moving average can mark where a trade idea is wrong, and the type you choose changes your risk. Take the hypothetical 22-bar series at bar 20: the close is 5024, the 10-period SMA is at 4991.10 and the 10-period EMA at 4999.66. A stop just under each line risks roughly:
| Stop reference | Points from close | One MES contract | One ES contract |
|---|---|---|---|
| 10-period SMA | 32.90 | $164.50 | $1,645 |
| 10-period EMA | 24.34 | $121.70 | $1,217 |
MES (Micro E-mini S&P 500) is $5 per index point and ES (E-mini S&P 500) is $50, which is how the points convert. The EMA stop is tighter and cheaper, and also easier to hit on normal noise. Neither is better on its own. The question is which distance your position size can carry.
Moving Average Trend Confirmation
A rising line with price holding above it confirms an uptrend that already exists. It does not forecast one. Use it to stay in a move or to stay out of trades against it.
Related lesson: Support and resistance
Moving Average Crossovers With SMA and EMA

A crossover strategy uses two moving averages of different lengths. A bullish crossover is the shorter line crossing above the longer one, and a bearish crossover is the reverse.
The best-known pair is the 50 and 200. When the 50-day crosses above the 200-day, it is called a golden cross; the reverse is a death cross. These are usually SMA-based and slow by design. ChartSchool classes a 50/200 SMA system as medium to long term and a 5-day and 35-day EMA system as short term.
Crossover signals are late, because the system combines two lagging indicators. ChartSchool notes they work well when a strong trend takes hold and produce many whipsaws when there is no trend. Using EMAs for the pair moves the signals earlier and adds whipsaws, the same trade-off as with a single line.
A few practical points help:
- Keep the type consistent within a pair unless you have a reason not to, so you know what you are comparing.
- Filter crosses with a time rule, such as the cross holding for a set number of bars, or a price rule, such as a minimum gap between the lines.
- Expect the strategy to lose small and often in ranges, and size it so that a string of whipsaws does not end your week. The hard part is rarely spotting the cross. It is taking the next valid one after three in a row failed.
Related lesson: Moving average crossovers
Using SMA and EMA Together
Many traders stop choosing and use one of each, each with a different job. A common split is a slower SMA for context and a faster EMA for timing: for example, a 50-period SMA defines the trend and the level the market has been respecting, and a 20-period or 9-period EMA times entries in that direction.
This works because the two lines answer different questions. The SMA answers "where has the market been valuing this?" The EMA answers "has short-term direction turned yet?" When both agree, you have a cleaner read. When the EMA turns against the SMA, that is the warning to tighten up or stand aside.
Keep expectations grounded. Valeriy Zakamulin's study of moving-average trading rules over 155 years of stock market data found that the shape of the weighting function did not improve the performance of timing rules, and that all the rules generated many false signals. That study tested mechanical market-timing rules, not discretionary intraday trading, but it is a fair warning: switching from SMA to EMA, or adding both, is not an edge on its own. The edge, if any, comes from the rule you build around the lines and how consistently you follow it.
Related lesson: Trend following
SMA and EMA Checklist Before You Trade
Run through these before you put either moving average on a live chart:
- Pick the period from your timeframe. A 200-period line means something different on a daily chart and a 1-minute chart.
- Pick the type from the job. Stable level or long filter, SMA. Earlier turns on a short horizon, EMA.
- Compare types at the same length. A 20 EMA against a 200 SMA tells you about length, not type.
- Load enough history. At least three times the period before you trust an EMA reading.
- Count the false turns. Check how many times the line turned during the last range on your market.
- Write the rule in testable terms. "Close above the 20 EMA after the 50 SMA has risen for five bars" can be tested. "The line looks supportive" cannot.
On our accounts every position is closed by 4:45 PM ET, with no overnight, weekend or swing holds, so a daily 50 or 200 line is context for an intraday trade, not a reason to hold one. If you chart on WealthCharts, one of the platforms we support, its 200+ indicators cover both averages, and Chart Replay lets you replay past sessions to count each line's false turns before you trade them.
Frequently Asked Questions About SMA and EMA
Is SMA the same as moving average?
No. "Moving average" is the family, and the simple moving average is one member, alongside the exponential, weighted, Hull and others. Many platforms default a plain moving average to the simple version, which is why the names get used interchangeably. Always check which type and which period a chart is showing.
What does EMA stand for in the context of studies?
EMA stands for exponential moving average. Many charting platforms call indicators "studies", so an EMA study is an exponential moving average plotted on the chart. It weights recent prices more heavily than older ones.
What does "20 SMA" mean?
A 20 SMA is the simple moving average of the last 20 closes on the chart's timeframe. Each close counts for 5.00% of the value. On a daily chart it covers roughly a month of sessions, and on a 5-minute chart it covers 100 minutes.
Which EMA setting is best?
The best EMA setting is the one that matches your timeframe, not a universal number. Short-term traders often use 9 to 20 periods, swing traders often watch the 20 and 50, and long-term traders the 200. Choose the period from your timeframe, then test it without changing it until the results look good.
What is the difference between a 50 EMA and a 50 SMA?
The 50 EMA puts 3.92% of its weight on the newest close against 2.00% for the 50 SMA, so it turns a little sooner and whipsaws a little more. Both still have an average data age of 25.5 bars. On a chart the two lines sit close together.
What is the difference between a 200 SMA and a 200 EMA?
Very little in practice. The 200 EMA weights the newest close at 1.00% against 0.50% for the 200 SMA, so neither line moves much on any one bar. The 200 SMA is the more widely quoted version, which is the main reason to prefer it as a reference level.
Is EMA better than SMA for day trading?
The EMA is the more common choice for day trading, because it turns sooner on short settings where a bar or two matters. It also produces more false turns in ranges. Whether that trade-off helps depends on how you filter signals, not on the line itself.
Moving Average Trading Risk
This article is education, not investment advice or a recommendation to trade any instrument. Every price series, stop distance and dollar figure here is hypothetical and illustrative, not a record of a real trade or a promise of any result. Moving averages describe prices that have already printed and cannot predict what comes next. Futures are leveraged, and losses can be larger than you expect; a stop order does not guarantee your exit price in a fast market. Simulated and funded account results are simulated and do not reflect live trading conditions.


