



TL;DR: Commodity seasonality is a recurring calendar tendency in futures prices, useful as context but never a forecast on its own. Real patterns trace to harvests, gas storage (April to October in, November to March out) and heating demand. In 20 years of CL, HO, NG, GC, ZC and ZS data, only 3 of 24 quarterly cells passed a t of 2.0, about what chance gives. Gold rose in 17 of 20 first quarters; natural gas fell in 16 of 20 fourth quarters. Continuous charts add roll gaps, so test on held contracts and size for the worst year.
Commodity seasonality is the habit some futures markets have of moving in a similar way at a similar time of year. Corn is planted in spring and harvested in fall. Natural gas is injected into storage from April to October and pulled out from November to March. Heating oil demand rises when the Northeast gets cold.
Those calendars are real, and they leave fingerprints on prices. The trap is treating a smooth seasonal chart as a schedule. You see a line that rises every October, you buy on October 1, and you find out the hard way that the line was an average of very different years. The years that broke the pattern are where the risk lives.
This guide explains where commodity seasonality comes from, how seasonal charts are built, and what 20 years of futures data on crude oil, heating oil, natural gas, gold, corn and soybeans actually show once contract rolls are handled properly.
What Commodity Seasonality Means
Commodity seasonality is a recurring tendency in a commodity's price, volatility, volume or spreads that lines up with the calendar. It can show up by month, by quarter, by crop year, by heating season, or around scheduled reports.
The key word is tendency. A seasonal pattern is a distribution of past outcomes, not a forecast. If natural gas fell in 16 of the last 20 fourth quarters, the four years it rose still happened, and one of them could be this year.
That changes the question a trader asks. "What does gas do in Q4?" invites a one-word answer. "What did gas do in comparable fourth quarters, how wide was the range, and what would tell me this year is different?" invites a plan.
Commodity seasonality also differs from stock-market calendar effects. Stock patterns such as "sell in May" rest mostly on investor behavior. Commodity patterns usually rest on something physical: a crop that has to be planted, a storage cavern that has to be filled, a furnace that has to run. That physical anchor is what makes commodity seasonality worth studying, and also what makes it break when the physical facts change.
Related lesson: Seasonal trading
Why Commodity Prices Follow a Seasonal Calendar
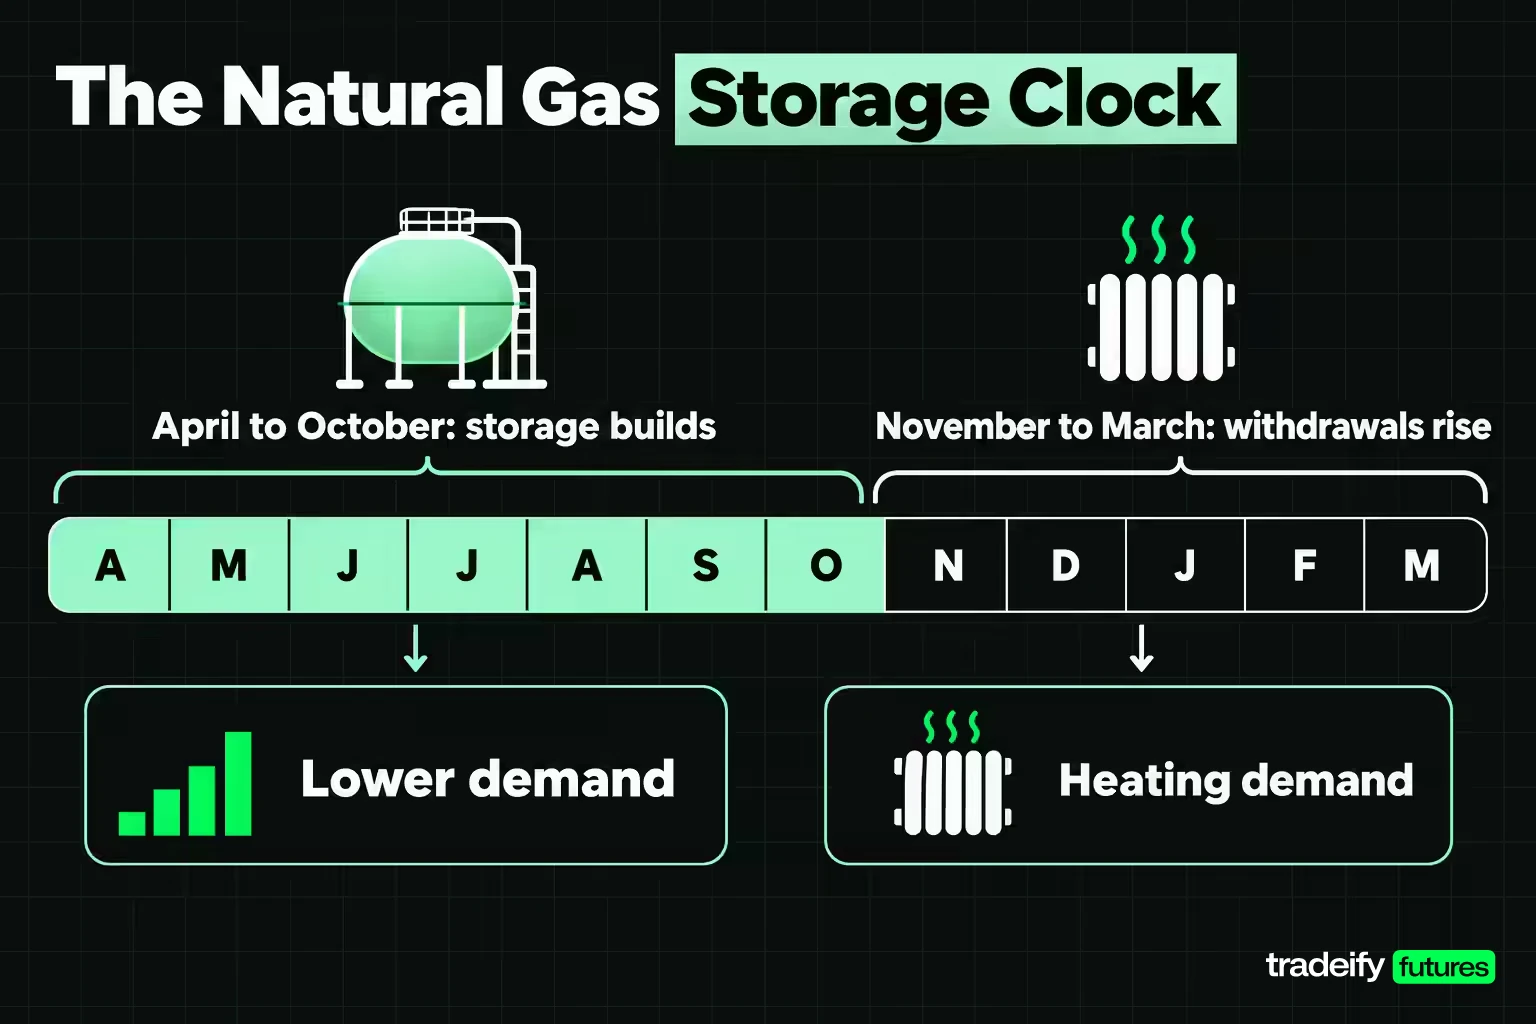
Seasonal commodity prices start with supply and demand that cannot move evenly through the year. Four drivers do most of the work.
Planting and harvest cycles in grain seasonality
Crops arrive once a year. USDA's usual planting and harvesting dates put the most active corn planting in Iowa between April 25 and May 18, with harvest between October 5 and November 9. Illinois runs a little wider, with planting from April 21 to May 23 and harvest from September 23 to November 5.
Before harvest, supply is an estimate, and weather can change it fast. After harvest, physical grain is in the bins. CME Group's grain education describes this as the old-crop versus new-crop split: during planting months, the grain for sale is last year's crop, and each grain has one new-crop delivery month when the fresh harvest comes to market.
Storage cycles behind natural gas seasonality
Storable commodities follow an inventory clock. The EIA notes that natural gas in storage typically increases from April through October, when demand is lower, and typically decreases from November through March, when withdrawals rise to meet heating demand. In recent years, injections have often run into the first half of November.
That rhythm is why natural gas traders watch the weekly storage number against the five-year average rather than against last week alone.
Weather-driven seasonality in energy demand
Heating and cooling move energy demand. The EIA says U.S. natural gas consumption typically peaks during the winter heating season from November to March, while hot summers raise power-sector demand for gas through air conditioning. For heating oil, the EIA notes that home heating oil prices tend to rise from October through March, and a Northeast home might burn 850 to 1,200 gallons in a typical winter.
Gasoline has its own season. The EIA defines the summer driving season as April through September.
Hedging deadlines and commodity seasonality
Producers, processors, utilities and refiners hedge around business deadlines. Their buying and selling can pressure particular contract months and the spreads between them. The direction is not fixed. It depends on inventories, the shape of the futures curve, and who needs protection that year.
Seasonal Patterns by Commodity
Seasonal patterns differ by commodity because each market runs on a different physical constraint. The map below is a research starting point, not a list of trades.
| Commodity | Physical driver | Season that matters | Report that tests the idea |
|---|---|---|---|
| Natural gas (NG) | Storage injection and heating demand | Injection April to October, withdrawal November to March | EIA Weekly Natural Gas Storage Report |
| Heating oil (HO) | Winter heating demand in the Northeast | October to March demand peak | EIA Weekly Petroleum Status Report |
| Crude oil (CL) | Refinery runs and gasoline demand | Driving season April to September | EIA Weekly Petroleum Status Report |
| Corn (ZC) | Planting, pollination and harvest | Spring planting, fall harvest | USDA Crop Progress and WASDE |
| Soybeans (ZS) | Planting and harvest | Harvest September to mid-November | USDA Crop Progress and WASDE |
| Gold (GC) | Jewelry and investment demand, no harvest | No physical season; calendar effects are statistical | None specific |
Energy seasonality is mostly about storage and weather. As of the EIA report for the week ending October 23, 2026, working gas in storage was 3,724 Bcf, up 80 Bcf on the week, 147 Bcf below a year earlier and 38 Bcf above the five-year average of 3,686 Bcf. That single line tells a gas trader more about this winter than any seasonal average.
Grain seasonality is about the crop calendar. CME Group notes that corn tends to be near its seasonal high around July, when new-crop production is most uncertain, then declines into harvest, and that grains tend to post their lowest seasonal prices in the new-crop month.
Gold is the odd one out. It has no harvest and no heating season, so any calendar effect in gold is a statistical observation looking for an explanation. That does not make it false. It does mean it deserves more suspicion.
How Commodity Seasonality Is Calculated
Seasonal patterns are calculated by lining up the same calendar window across many years and summarizing what happened. The method matters more than most charts admit.
Rebasing each year in a seasonality study
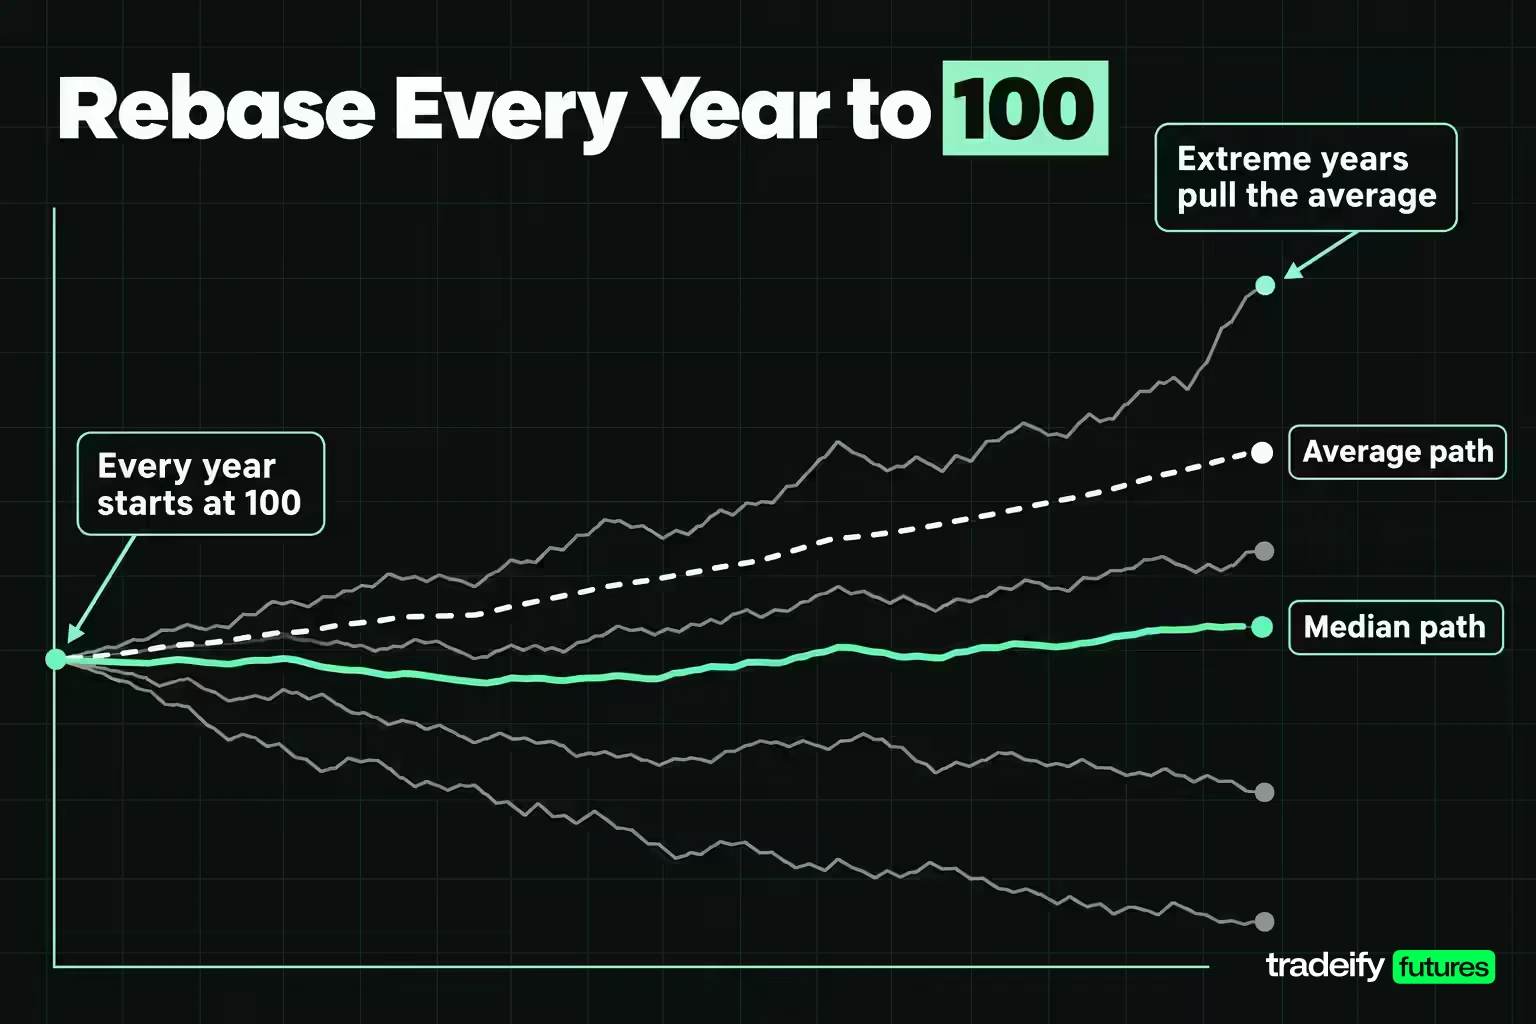
Raw prices from different decades cannot be averaged directly, because a $2 move means something different at $3 gas than at $12 gas. The standard fix is to rebase every year to 100 at the start of the window, then track the percentage path from there. Each year becomes one line, and the seasonal chart is a summary of those lines.
Average versus median seasonality paths
Most seasonal charts plot the average path. The average is pulled hard by extreme years, so it can describe a year that never happened.
Natural gas in the November to March withdrawal season shows the problem. Across 20 seasons from 2006 to 2025, using roll-adjusted front-month data, the mean return was -4.71% and the median was -9.86%. Only 8 of 20 seasons finished higher. But four seasons gained more than 45%, and the worst lost 67.04%.
Drop the single best season and the mean falls to -8.82%. Drop the single worst and it rises to -1.43%. One year out of 20 moves the "seasonal tendency" by several percentage points either way.
What a commodity seasonality study should record
A seasonal study worth trusting reports the median, the share of years up, the best and worst year, and a middle range such as the 25th to 75th percentile. Those figures show whether the pattern is broad or whether a few outliers are carrying it.
Quarterly Commodity Seasonality in 20 Years of Futures Data
Quarterly commodity seasonality is the simplest annual-cycle test: does a market tend to rise or fall in the same quarter year after year? The table below comes from an illustrative study of Yahoo Finance front-month continuous futures data for six commodities.
Method: daily closes from November 2006 to October 2026, with each contract roll session set to a zero return so the series approximates holding the front contract and rolling it. Q1 to Q3 use 2007 to 2026 and Q4 uses 2006 to 2025, so every cell has 20 observations. Each cell shows the mean quarterly return and how many of the 20 years were up.
| Market | Q1 mean (years up) | Q2 mean (years up) | Q3 mean (years up) | Q4 mean (years up) |
|---|---|---|---|---|
| Crude oil (CL) | 7.17% (13 of 20) | 5.71% (13 of 20) | -0.15% (10 of 20) | -4.21% (10 of 20) |
| Heating oil (HO) | 10.47% (14 of 20) | 5.18% (12 of 20) | 5.35% (11 of 20) | -2.41% (11 of 20) |
| Natural gas (NG) | 1.20% (10 of 20) | 4.77% (12 of 20) | -3.90% (5 of 20) | -8.99% (4 of 20) |
| Gold (GC) | 4.66% (17 of 20) | -0.70% (11 of 20) | 3.00% (12 of 20) | 1.70% (12 of 20) |
| Corn (ZC) | 2.07% (9 of 20) | -0.72% (8 of 20) | -2.50% (8 of 20) | 6.27% (12 of 20) |
| Soybeans (ZS) | 3.13% (12 of 20) | 6.12% (12 of 20) | -0.94% (8 of 20) | 5.27% (13 of 20) |
Reading the quarterly commodity seasonality grid
Two cells stand out on consistency. Gold rose in the first quarter in 17 of 20 years. Natural gas fell in the fourth quarter in 16 of 20 years, with a mean of -8.99%.
Other big numbers are less convincing than they look. Crude oil's 7.17% first-quarter mean sits on a range from a 96.30% gain to a 66.64% loss, with a median of 3.33%. One or two violent years explain most of it.
Annual seasonality cycles drift between decades
Splitting each cell into its first and last 10 years shows how unstable annual cycles can be. Crude's Q1 averaged 0.64% in the first decade and 13.70% in the second. Natural gas Q3 averaged -14.75% in the first decade and 6.96% in the second. Soybean Q2 went from 13.47% to -1.22%.
Gold's Q1 is the exception: 4.34% in the first decade and 4.99% in the second. A commodity seasonality pattern that holds its sign and size across both halves deserves more attention than one that flips.
Testing Commodity Seasonality With Statistics
Testing commodity seasonality with statistics answers one question: could this pattern have appeared by luck? Time series methods do this by comparing the seasonal result with what random calendars would produce.
The t-statistic for one seasonality cell
A t-statistic compares a cell's mean return with its year-to-year noise and the number of years. With 20 years, a t of about 2.0 is the usual first screen. In the quarterly grid, three of 24 cells clear it: natural gas Q4, gold Q1 and soybean Q4.
Multiple testing in a commodity seasonality grid
Test 24 cells and some will pass by chance. A permutation test makes this concrete. Shuffling the quarter labels inside each market 2,000 times keeps every real return but destroys any true calendar link. Those shuffled calendars flagged 2.99 cells on average, and 62% of the shuffles flagged three or more.
In other words, three flagged cells is about what a calendar with no real seasonality would produce from these fat-tailed markets. The grid looks like it is full of patterns. Statistically, it is mostly noise with two or three candidates worth a second look.
A stricter Bonferroni bar for seasonality
A Bonferroni correction divides the 5% significance level across all 24 tests. That raises the required t to about 3.56. Gold's first quarter, the strongest cell, scores 3.30 and falls short.
This does not prove commodity seasonality is fake. Natural gas Q4 and gold Q1 may well reflect something real. It does mean a seasonal grid needs a physical reason and an out-of-sample check before the pattern earns any weight.
Related lesson: Overfitting and look-ahead bias
Calendar-Based Commodity Seasonality Strategies
Calendar-based seasonal strategies enter and exit on fixed dates tied to a recurring window: a month, a quarter, a season, or the turn of the year. Most take one of three forms.
- Outright windows: buy or sell a single contract at the start of a window and exit at the end.
- Turn-of-year or turn-of-season entries: position ahead of a known shift, such as the start of the heating season or the new crop year.
- Seasonal spreads: buy one contract month and sell another, betting on the shape of the curve rather than direction.
The honest way to test a calendar strategy is to choose the window from the physical story first, then look at the data once. The table that follows does that for six windows taken from the physical drivers of commodity seasonality, using this guide's study of roll-adjusted Yahoo Finance front-month futures data from November 2006 to October 2026, with 20 seasons per row.
| Market and window | Physical story | Mean | Median | Years up | t-stat |
|---|---|---|---|---|---|
| NG, November to March | Storage withdrawal season | -4.71% | -9.86% | 8 of 20 | -0.51 |
| NG, April to October | Storage injection season | -1.06% | -14.34% | 7 of 20 | -0.12 |
| HO, November to March | Winter heating demand | 6.10% | -1.06% | 10 of 20 | 0.91 |
| HO, April to October | Pre-winter stock build | 10.40% | 5.11% | 12 of 20 | 2.27 |
| CL, April to September | Driving season | 4.28% | 2.15% | 11 of 20 | 1.22 |
| ZC, July to October | Pollination into harvest | -0.35% | -0.59% | 9 of 20 | -0.09 |
In that study, only heating oil from April to October clears a t of 2.0, and its first half of the sample averaged 3.67% against 17.14% in the second half. Most of that edge arrived in recent years.
The lesson is uncomfortable but useful. A sound physical story does not guarantee a tradable outright window. Everyone in the market knows winter is coming, so the story often shows up in the curve, in spreads, or in volatility instead of in a clean directional move.
Popular Seasonal Commodity Trades Checked Against the Data
Popular seasonal commodity trades get repeated because they make intuitive sense. Here is what this guide's 20-year study of roll-adjusted Yahoo Finance front-month futures data (November 2006 to October 2026) says about five of them.
Natural gas seasonality into winter
The popular version says gas rallies as heating demand arrives. This guide's 20-year study of front-month natural gas futures says the opposite for a held front-month position: Q4 averaged -8.99% with only 4 of 20 years up, and the November to March season averaged -4.71%. Winter demand is real, but the futures curve usually prices it in advance, so a trader rolling front contracts tends to pay for that expectation.
Heating oil seasonality ahead of winter
In this guide's study of Yahoo Finance front-month futures data from 2007 to 2026, heating oil from April to October averaged 10.40% with 12 of 20 seasons up. It is the most supportive window in this study, but the gain is concentrated in the last decade, which raises a fair question: is this a season, or a recent regime that happened to line up with the calendar?
Corn seasonality from the July high to harvest
CME describes corn's tendency to peak around July and fall into harvest. In this guide's study of corn futures from 2007 to 2026, a held position from July to October averaged only -0.35%, with 9 of 20 years up. Much of the seasonal decline on a corn chart sits in the gap between the old-crop July contract and the new-crop contracts that follow, which a single held contract never earns.
Soybean seasonality into harvest
In this guide's study of soybean futures from 2007 to 2026, soybeans from July to October averaged 0.45% on a held basis, with 11 of 20 years up. As with corn, the familiar harvest decline lives mostly in contract changes.
Gold seasonality in January
In this guide's study of gold futures from 2007 to 2026, January averaged 3.42% with 14 of 20 years up and a t of 3.33. It is the most statistically consistent month in this study, and it has no physical harvest or weather story behind it. Treat it as an observation that still needs an explanation.
Holiday and Report-Driven Commodity Seasonality
Holiday and report-driven commodity seasonality comes from the calendar of events rather than the weather. Two kinds matter: market holidays and scheduled government reports.
Pre-holiday seasonality in commodity futures
This guide's study of Yahoo Finance daily futures data from November 2006 to October 2026 contains 185 weekday market closures. Comparing the session before each closure with all other sessions gives a simple pre-holiday test.
Corn averaged 0.357% on the 184 pre-holiday sessions against 0.001% on other days, with 108 of 184 up. Crude oil averaged 0.444% against 0.021%, with 113 of 184 up. Natural gas, heating oil, soybeans and gold showed no meaningful difference.
Six markets means six tests, so a fair cut is p of 0.0083 (0.05 divided by 6). Corn passes at p of 0.004. Crude, at p of 0.043, does not. The pre-holiday effect in corn is interesting; in crude it is a maybe.
Holiday sessions also bring thin liquidity and early closes, and exchange holiday hours are usually finalized shortly before each holiday. A pre-holiday tendency is worth nothing if the fill is poor.
Report-day seasonality in energy and grains
The EIA releases its Weekly Petroleum Status Report on Wednesdays at 10:30 AM ET and its Weekly Natural Gas Storage Report on Thursdays at 10:30 AM ET, with holiday exceptions. For example, the storage report for Thanksgiving week 2026 moves to Wednesday, November 25, 2026 at 12:00 PM ET.
Report days show up in volatility more than in direction. In this guide's 20-year study of daily futures closes, heating oil's average absolute move on Wednesdays was 1.75% against 1.54% on other days, about 13% larger. Crude's Wednesday move was 1.94% against 1.76%. Natural gas on Thursdays was only slightly busier, at 2.60% against 2.49%, and the difference was not significant.
For grains, the USDA's monthly WASDE report comes out at 12:00 PM ET, and the weekly Crop Progress report runs from April to November on Mondays at 4:00 PM ET. A seasonal grain view should be checked against both before every planting and harvest window.
Day-of-Week Seasonality in Commodity Futures
Day-of-week seasonality is the shortest calendar cycle traders test. This guide's study of Yahoo Finance daily futures closes from November 2006 to October 2026 gives roughly 850 to 1,000 sessions per weekday in each of six markets, which is far more data than any monthly or quarterly test.
Even with that much data, the results are thin. Testing each weekday's mean return against zero, 3 of 30 market-weekday cells reach a t of 2.0. Against each market's own average day, only one does: heating oil on Mondays, at a t of -2.60. With 30 tests, one or two cells at that level are expected by chance.
What does vary by weekday is size. Natural gas averages a 2.51% absolute move per session, but its Monday move averages 3.03%, the largest of any weekday, and Friday averages 2.19%. Monday's close-to-close return includes the whole weekend, when weather forecasts keep changing and the market is closed.
For a short-term trader, that matters more than any directional weekday edge. Position size that fits a quiet Friday in natural gas can be too large for a Monday, and a stop that survives Tuesday noise can get tagged on a Monday for no reason beyond the weekend weather run.
How Contract Rolls Distort Commodity Seasonality
Contract rolls distort commodity seasonality because most seasonal charts use continuous series, and a continuous series splices one contract onto the next. When the expiring contract and the next one trade at different prices, the chart shows a jump that no trader holding a position ever experienced.
Roll gaps in commodity futures contracts
Each futures contract stops trading on a schedule set by the exchange. CME's rules end natural gas trading on the third-last business day of the month before the contract month, crude oil three business days before the 25th of the prior month, and corn and soybeans on the business day before the 15th of the contract month.
In this guide's study of Yahoo Finance continuous futures data from November 2006 to October 2026, the average absolute price change on roll sessions was 5.09% for natural gas, 3.48% for corn, 2.38% for heating oil, 2.31% for soybeans, 2.30% for crude and 1.01% for gold. Corn's July roll sessions alone averaged -4.03%, with a worst of -23.56%, because the old-crop July contract hands off to new-crop months.
Unadjusted versus held seasonality results
This guide's 20-year study of Yahoo Finance futures data measures the same window two ways: on an unadjusted continuous chart, and with roll sessions removed so the result reflects holding contracts.
| Window | Unadjusted chart mean (years up) | Held-contract mean (years up) |
|---|---|---|
| Soybeans, July to October | -5.89% (8 of 20) | 0.45% (11 of 20) |
| Natural gas, April to October | 22.29% (13 of 20) | -1.06% (7 of 20) |
| Natural gas, November to March | -13.28% (8 of 20) | -4.71% (8 of 20) |
| Corn, July to October | -1.13% (10 of 20) | -0.35% (9 of 20) |
The unadjusted chart shows the classic soybean harvest decline and a strong summer rally in natural gas. A trader holding contracts would have seen neither. In natural gas, the "summer rally" on a continuous chart is mostly the curve stepping up from cheap summer contracts to more expensive winter ones.
Before using any seasonal chart, find out how it handles rolls. If the source cannot say, assume the pattern includes roll gaps.
Related lesson: Futures rollover
Backtesting a Commodity Seasonality Rule
Backtesting a commodity seasonality rule means testing it the way you would trade it, on data the rule never saw while it was being designed.
- Write the physical hypothesis first. One sentence on why supply, demand, storage or hedging should recur in this window.
- Fix the instrument and roll rule. Individual contracts, a held-and-rolled series, or a spread, and the exact date you switch contracts.
- Fix the window before looking. Entry and exit dates come from the hypothesis, not from scanning for the best-looking stretch.
- Hold out years. Design the rule on an earlier period, then check it once on later years that played no part in the design.
- Shift the dates. Move entry and exit a week or two either way. A real tendency survives nearby dates; a fitted one collapses.
- Add costs and slippage. Include commissions, the bid-ask spread and roll costs for every season.
- Record the full distribution. Median, years up, worst year, worst drawdown inside the window, and the longest losing streak.
How many years are enough depends on how big the edge is relative to the noise. Twenty seasons can confirm a large, consistent tendency. They cannot reliably separate a small one from luck, which is why the split-half and permutation checks matter.
Related lesson: Backtesting a trading strategy
Applying Commodity Seasonality Step by Step
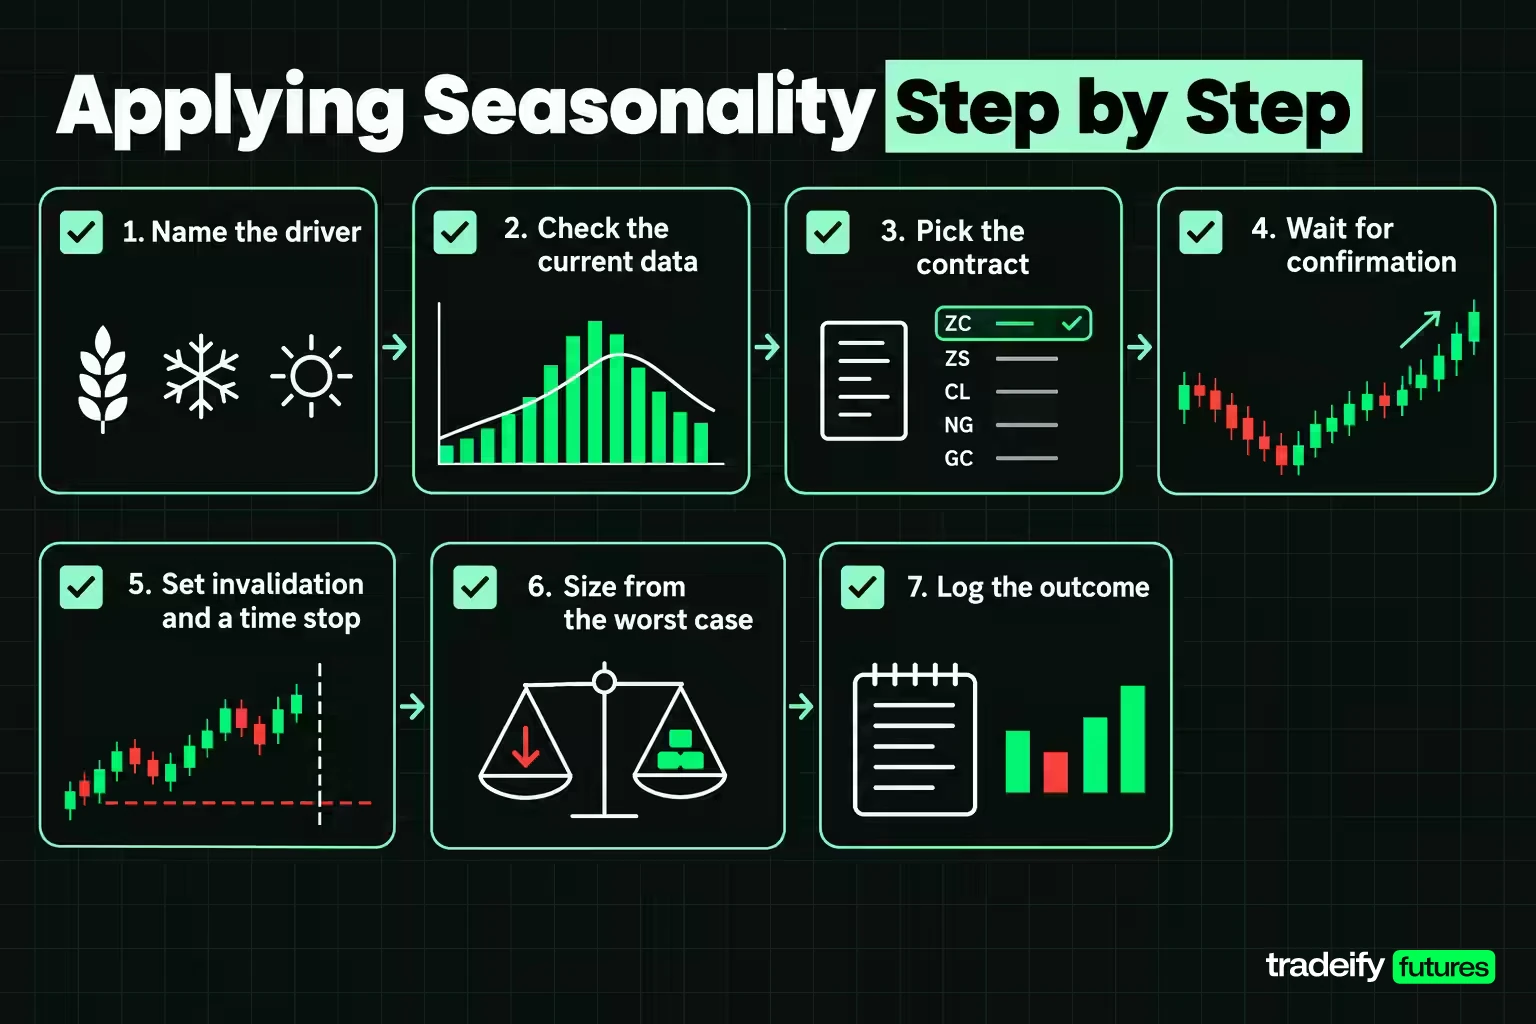
Applying commodity seasonality works best as a preparation routine, not an entry signal. Seasonality decides which markets deserve attention and which risks to expect; price action decides the trade.
- Name the driver. State the physical reason the window should matter this year.
- Check the current data. Compare storage, crop progress, inventories and the futures curve with the seasonal norm. If gas storage is already well below last year's level going into winter, the usual winter story starts from a different place.
- Pick the contract. Decide which contract month expresses the idea, and note its last trading day.
- Wait for confirmation. Define what price behavior would show the seasonal pressure is actually arriving, rather than buying because a date arrived.
- Set invalidation and a time stop. Decide the price that proves the idea wrong and the date by which the move should have started.
- Size from the worst case. Use the window's historical adverse excursion, not its average return.
- Log the outcome. Record whether the driver, timing and execution behaved as expected, including the trades you skipped.
A missed seasonal move is not a reason to chase. If price has already done what the season usually does, the seasonal edge has been spent, and buying late turns a research idea into a hope trade. Doing nothing is a valid outcome of seasonal research.
Risk Management for Seasonal Commodity Trades
Risk management for seasonal commodity trades starts with how far a window can move against you before it works. Averages hide that; adverse excursion shows it.
Adverse excursion in natural gas and gold seasonality
In this guide's study of Yahoo Finance front-month futures data from 2006 to 2025, a natural gas short held through the fourth quarter looks like the cleanest seasonal trade, because gas fell in 16 of 20 fourth quarters. Being right about the quarter did not make it comfortable. In the median year, gas still rallied 14.70% against the short at some point inside the quarter, and in the worst year the move against the short reached 60.70%. Most traders stop out of a trade like that long before the season pays.
Gold's first quarter was gentler in the same study of 2007 to 2026 futures data. Holding long from the end of December, the median worst close inside the quarter was 1.78% below entry, and the worst year was 12.24% below.
Contract math for a commodity seasonality trade
Contract size turns those percentages into dollars. A natural gas futures contract covers 10,000 MMBtu. At an illustrative price of $3.000 per MMBtu, one contract controls $30,000 of gas.
- Median adverse move of 14.70%: $4,410 per contract.
- Worst adverse move of 60.70%: $18,210 per contract.
- Average daily move of 2.51%: $753 per contract.
With a $500 risk budget, the median adverse move supports about 0.11 contracts, and even one average day supports only 0.66. A full natural gas contract held through a seasonal window is far larger than most small accounts can carry.
Crude oil tells a similar story. A contract covers 1,000 barrels, so at an illustrative $70 it controls $70,000, and the average session move of 1.79% is about $1,253.
Futures are leveraged. Losses can exceed the planned amount when price gaps through a stop, and seasonal windows give price weeks to do it.
Risk controls for a seasonality trade plan
- Maximum loss in dollars and the position size that keeps the window inside it.
- The price level and the fundamental data point that would cancel the thesis.
- A time stop: the date by which the seasonal move should have started.
- Report and holiday dates inside the window.
- Roll dates and liquidity in the chosen contract month.
- Correlated positions, such as crude and heating oil, that double the same exposure.
Related lesson: Position sizing
Pros and Cons of Commodity Seasonality
The pros and cons of commodity seasonality come down to this: it is good at telling you where to look and poor at telling you what to do.
| Strength | Limitation |
|---|---|
| Rooted in physical cycles such as harvests, storage and heating demand | Physical cycles change as production, storage and trade routes shift |
| Gives a calendar of when volatility and reports cluster | Directional averages often rest on a few extreme years |
| Helps plan which markets to study each month | Twenty seasons is a small sample for a calendar claim |
| Can frame spreads and curve trades | Continuous charts include roll gaps a trader never earns |
| Easy to test with public data | Popular patterns attract traders who act early, which can fade the move |
The drift in this guide's 20-year quarterly study of Yahoo Finance futures data shows the decay problem clearly. Soybean Q2 averaged 13.47% in the first decade of the sample and -1.22% in the second. Heating oil's April to October window did the reverse, strengthening from 3.67% to 17.14%. A seasonal pattern is a snapshot of market structure, and market structure moves.
Seasonality Tools and Data Sources
Seasonality tools fall into two groups: tools that draw seasonal charts, and data sources that tell you whether this year fits the pattern.
Seasonality chart tools
TradingView's Seasonals feature plots each year's price change over the same period as a separate line on one chart, with a full-history page where you can set the start and end years. Spreadsheet or Python studies take more work but let you control the data, the roll rule and the statistics.
Whatever the tool, ask four questions before trusting a seasonal chart:
- Does it use a continuous series, and how are rolls handled?
- Does it show the median and each year's path, or only an average?
- How many years are included, and can you change the range?
- Can you see the worst year and how far it moved against the pattern?
Government data that tests a commodity seasonality view
- EIA Weekly Natural Gas Storage Report for gas inventories against the five-year average.
- EIA Weekly Petroleum Status Report for crude, gasoline and distillate stocks.
- USDA WASDE for monthly supply and demand estimates in grains and oilseeds.
- USDA Crop Progress for weekly planting, condition and harvest data during the growing season.
Commodity Seasonality FAQ
What is commodity seasonality?
Commodity seasonality is a recurring calendar tendency in a commodity's price, volatility or spreads. It usually traces back to harvests, storage cycles, weather-driven demand or hedging deadlines. It describes a range of past outcomes, not a guaranteed future move.
Which commodities are the most seasonal?
Natural gas, heating oil and the grains have the clearest physical calendars, because storage, heating demand and harvests recur every year. Whether that shows up as a tradable price pattern depends on the contract and on how much the futures curve has already priced in. Metals such as gold have no harvest or weather cycle.
Does commodity seasonality still work?
Some patterns persist and many fade. In 20 years of futures data, gold's first quarter held steady across both decades, while soybean's second quarter faded and heating oil's April to October window strengthened. Test any pattern on recent, out-of-sample years before relying on it.
How many years of data does a seasonal study need?
There is no fixed minimum. Twenty seasons can support a large, consistent tendency but cannot separate a small edge from luck. Older data may also describe a market structure that no longer exists, so report the sample and check each half separately.
Can you day trade seasonal patterns?
Not directly, because most seasonal windows last weeks or months. Day traders use seasonality as context: which markets to watch, which reports are coming, and how large moves tend to be. The entry and exit still come from the session's own price action.
Commodity Seasonality on an Intraday Funded Account
Commodity seasonality usually plays out over weeks or months, while many traders, including prop traders, hold positions for minutes or hours. The seasonal view still has a job on an intraday account: it sets the backdrop, the report calendar and the size of the moves to expect.
In practice that means using the season to choose which markets to watch, leaning toward setups that agree with the current fundamental data, and cutting size around report days and Monday sessions when ranges widen.
On our accounts, all positions are closed by 4:45 PM ET on regular days (12:59 PM ET on holiday early closes), and no overnight, weekend or swing holds are allowed, so a multi-week seasonal window can only frame single-session trades. Crude oil, natural gas, gold, corn and soybeans are on our supported product list; heating oil is not. Our hedging rule prohibits opposing positions in the same instrument or in two products from the same Product Group, and a calendar spread is a long and a short in the same product, so seasonal spreads such as long one natural gas month and short another fall under that rule. Our funded accounts are simulated.
Trading futures involves substantial risk of loss and is not suitable for every investor. Futures are leveraged, so losses can exceed the amount you planned to risk, and seasonal patterns can fail in any year. Funded and evaluation accounts at prop firms are simulated. The studies in this article are historical and illustrative, past performance does not guarantee future results, and nothing here is trading advice.


