



TL;DR: Overfitting and look-ahead bias both flatter a backtest, but look-ahead bias is a timing error and overfitting is a selection error. On 20 years of ES daily bars, entering on the signal bar's open inflated one breakout rule's points about five times. A 300-combo search found a 0.920R winner, and a random-entry search reached 0.880R on the same in-sample data. Shift every signal one bar, count your trials, open the holdout once, and make a random control lose.
You have a backtest you like. The equity curve climbs, the drawdowns look survivable, and the only question left is whether to put real risk behind it. That question has nothing to do with how good the curve looks. It is whether the curve survives being rebuilt by someone who only knew what you could have known at the time, and who did not get to pick the best of many tries. That is an uncomfortable test, because it is exactly the moment you least want to find a problem.
Two failures break that test. Look-ahead bias and overfitting both make a backtest look better than the trading it describes, so traders lump them together. They have different causes, different symptoms and different fixes, and this guide prices both of them on the same E-mini S&P 500 rule.
Overfitting and Look Ahead Bias Are Two Different Failures
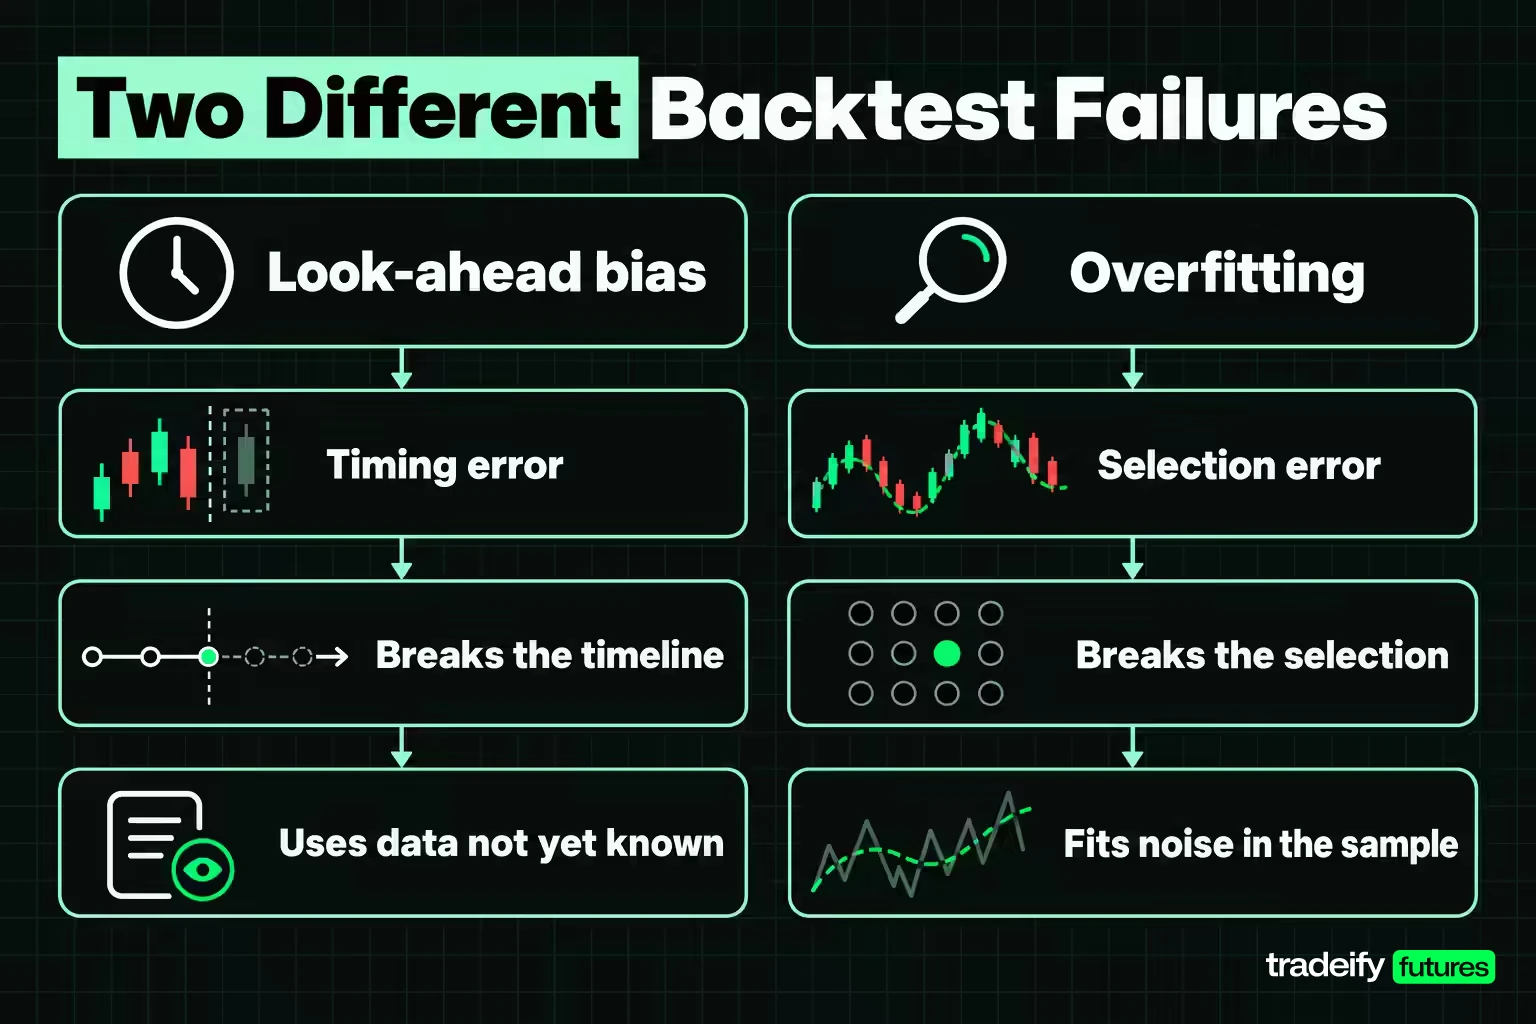
Overfitting and look-ahead bias are both reasons a backtest overstates what a strategy can do, but they break it in different places. One breaks the timeline. The other breaks the selection.
What look-ahead bias means
Look-ahead bias is using information in a decision that did not exist when the decision had to be made. The classic version is a rule that buys at today's open because today's close finished above a moving average. The close does not exist at the open. The backtest got a free look at the future, and the fill it recorded was never available to anyone.
That makes look-ahead bias a wiring error. The result is not fragile, it is wrong. No market regime repairs it, because the trades it printed could not have been placed.
What overfitting means
Overfitting is a model fitting the particular observations in a sample instead of a structure that carries forward. In a backtest, every individual trade may be perfectly executable and the rule may still be worthless, because its settings were chosen after seeing which settings worked. Run 300 versions, keep the best equity curve, and part of what you kept is a description of that sample's noise.
Bailey, Borwein, López de Prado and Zhu, writing in the Notices of the American Mathematical Society in 2014, describe overfitting as a concept borrowed from machine learning: the model targets specific observations rather than general structure. Traders usually call the same thing curve fitting.
Overfitting, underfitting and the bias-variance tradeoff
The word "bias" means two different things in this topic, and that trips people up. In look-ahead bias, it means a systematic error in the test. In machine learning's bias-variance tradeoff, it means error from a model that is too simple.
An overfit model has low bias and high variance: it matches the training data closely and swings hard when the data changes. An underfit model has high bias: it is too simple to capture a real pattern, so it misses both in sample and out of sample. So bias in that statistical sense is the signature of underfitting, and overfitting is the variance side of the same tradeoff.
For a trader, the practical reading is simple. A rule with a dozen tuned settings and a beautiful curve is more likely to be overfit. A rule so crude it never finds anything may be underfit. Neither problem is look-ahead bias, which can contaminate a simple model and a complex one alike.
Where Look Ahead Bias Hides in a Trading Backtest
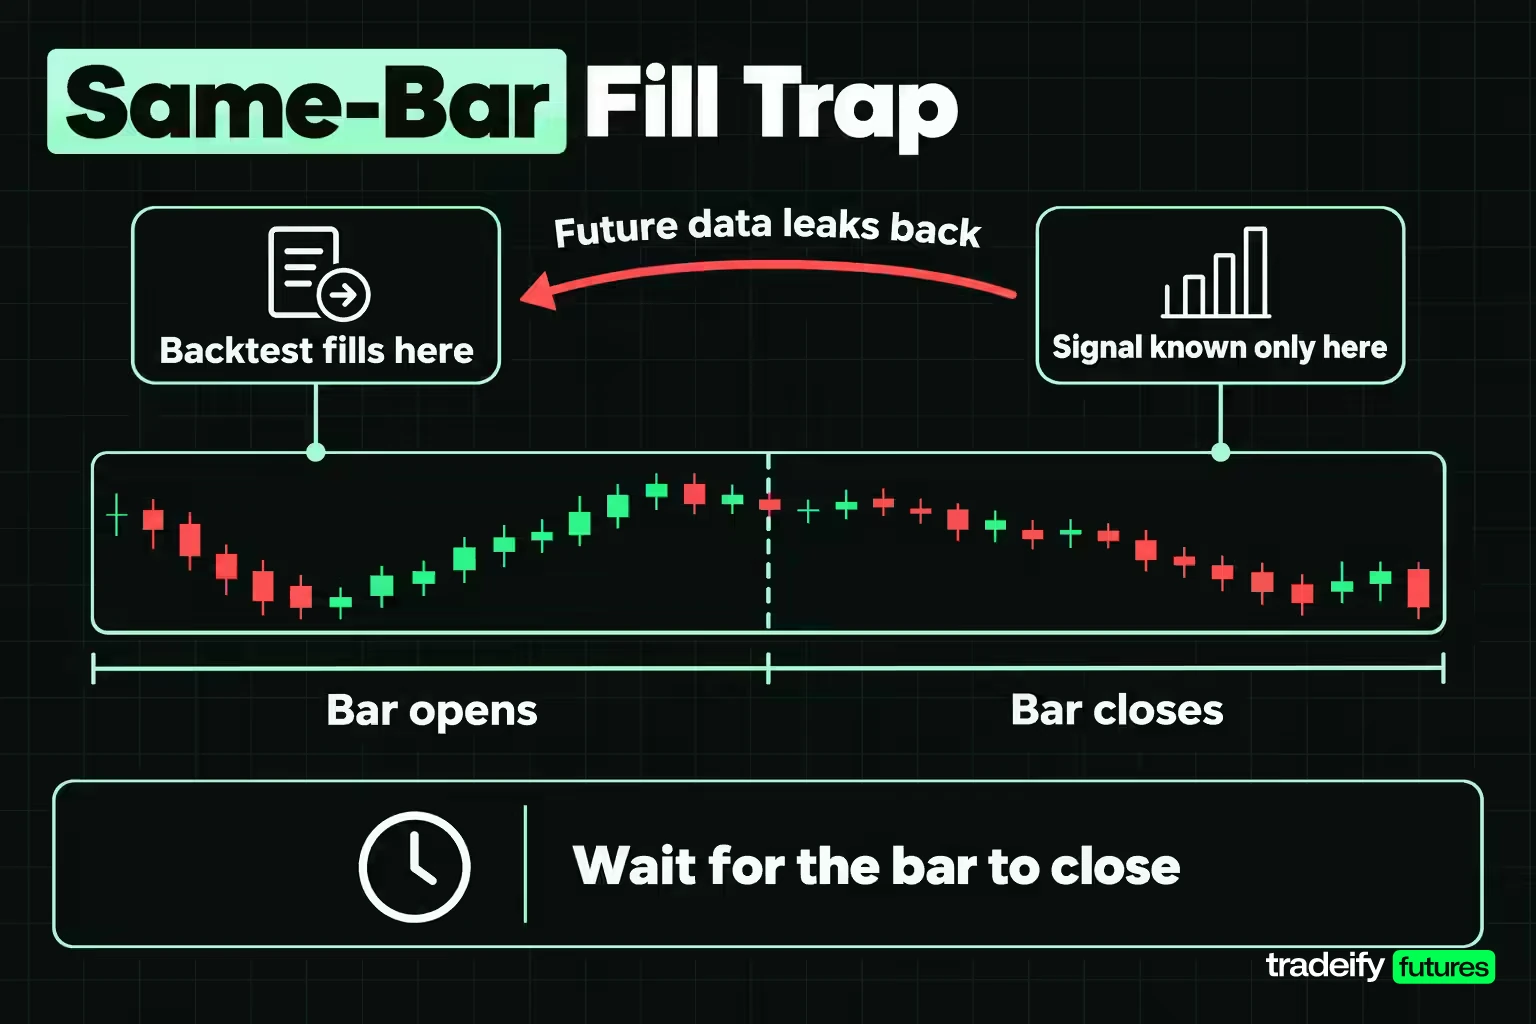
Look-ahead bias rarely announces itself as "using tomorrow's price." It usually hides in a timestamp that nobody checked. These are the places it shows up most often in a trading backtest.
Bar close timing and same-bar fills
A bar's high, low and close are only known when the bar finishes. Any rule that reads those values and then fills inside the same bar is suspect. Common versions:
- Entering at a session's open because of that session's close.
- Setting a stop from the full range of a bar that has not closed yet.
- Computing an average or an average true range that includes the current bar, then trading at that bar's open.
- Assuming a limit order filled because price touched the level, when on daily bars you cannot tell whether the touch came before or after your signal.
Waiting for the bar to close removes the timing leak for signals built from that bar. It does not remove every bias. It does nothing about overfitting, survivorship or revised data, and it can create a different mismatch if the backtest still fills at a price you could not get after the close.
Higher timeframe requests and repainting indicators
Multi-timeframe scripts are a common leak. On a 5-minute chart, a request for the daily high must return the high of the last completed day, not the high of the day still forming. TradingView's Pine Script documentation is explicit about this: the lookahead parameter of request.security() defaults to barmerge.lookahead_off, and using barmerge.lookahead_on without offsetting the requested value by one bar can leak future higher-timeframe values into historical bars. The documented way to avoid that is lookahead_on together with a one-bar offset on the requested series.
Repainting is the visible symptom. A repainting indicator shows one value on historical bars and a different value when the same bars were live, usually because it used information that only became final later. Pivot and fractal markers that need bars on both sides, zigzag lines and some higher-timeframe overlays all behave this way. A signal that looks perfect on history and keeps moving in real time is a look-ahead problem on a chart.
Look-ahead bias from release times and revised data
Data has a release time, and the release time is the only time that matters to a backtest. September 2026 CPI, for example, was released on Wednesday, October 14, 2026, at 8:30 AM ET. A backtest that uses the September figure on September 30 is trading on a number that did not exist yet.
Revisions add a second layer. Many economic series are revised after first release, and today's database shows the revised value. The St. Louis Fed's ALFRED archive stores vintages, the data as it stood on specific past dates, which is the point-in-time version a backtest needs. Company fundamentals have the same problem when a database stores restated figures under the original report date.
Survivorship bias in the tested universe
Survivorship bias is look-ahead bias applied to the list of instruments. Testing a stock strategy on today's index members quietly excludes the companies that were delisted, merged or dropped along the way. Your backtest knew in advance which names would survive. Futures traders meet a milder version when a study only covers contracts that are still liquid today.
Related lesson: Confirmation bias
Pricing a One Bar Timing Error on 20 Years of ES
Definitions describe look-ahead bias. A measurement shows what it costs. This study takes one fully stated rule on E-mini S&P 500 (ES) futures and changes only which bar supplies the entry price.
The data is the continuous front-month ES daily series from Yahoo Finance (symbol ES=F), 5,249 sessions from 2006-01-03 to 2026-11-03, with the first 200 sessions used only to warm up the indicators. One ES contract is $50 times the S&P 500 index, so $50 per index point, and the minimum tick is 0.25 index points, or $12.50, per CME Group's contract specifications.
The ES breakout rule tested three ways
The ES daily breakout rule in this look-ahead study, written so anyone can rebuild it:
- Signal at the close of session i: the close is above the highest close of the previous 20 sessions, and above the 200-session simple average of closes.
- Entry: at the open of session i+1. One position at a time. A new signal is only considered from the session after an exit.
- Initial stop: entry price minus 1.5 times the 14-session average true range, measured at session i.
- Exits, checked each session through the 10th: a session that opens beyond the stop fills at that open; otherwise a session that trades through the stop fills at the stop; otherwise the trade closes at the 10th session's close.
- Cost: 0.58 index points, or $29.00, per round turn. That is one 0.25 tick of slippage per side plus $4.00 of commission. It is a stated modelling assumption, not a broker quote.
- R is net points divided by the points between entry and initial stop.
Three runs use the identical signal. The honest run enters at the next session's open. The second enters at the signal session's close. The third enters at the signal session's open, which means it decides at the open using a close that has not happened yet.
| Entry convention | Trades | Mean R | Net points | Winners | Stop exits |
|---|---|---|---|---|---|
| Next session open (honest) | 226 | 0.088R | 1,252.31 | 55.3% | 87 |
| Signal session close | 227 | 0.081R | 1,239.89 | 54.2% | 89 |
| Signal session open (look-ahead) | 236 | 0.478R | 6,320.12 | 62.7% | 71 |
The look-ahead run produced 5.05 times the honest points. Mean R went from 0.088R to 0.478R, the win rate rose from 55.3% to 62.7%, and stop exits fell from 87 to 71. Nothing about the market changed. The stop count fell because every entry now sat on the right side of a day the trader could not have seen.
Look-ahead inflation at every stop width
One stop setting could be a coincidence. So the ES look-ahead test was repeated at five stop widths, comparing next-open, signal-close and signal-open entries with everything else unchanged.
| Stop width | Honest points | Close-entry points | Look-ahead points | Look-ahead multiple |
|---|---|---|---|---|
| 0.75 ATR | 1,265.31 | 1,478.08 | 7,424.96 | 5.87x |
| 1.0 ATR | 1,180.17 | 1,029.38 | 7,010.24 | 5.94x |
| 1.5 ATR | 1,252.31 | 1,239.89 | 6,320.12 | 5.05x |
| 2.0 ATR | 1,709.52 | 1,620.80 | 6,799.66 | 3.98x |
| 3.0 ATR | 1,873.54 | 1,767.91 | 7,100.83 | 3.79x |
The look-ahead version inflated the result between 3.79 and 5.94 times at every width. That is the cost of one line of timing code on this rule, and nothing on the equity curve would have told you it was there.
Why the close entry did not inflate the result
In the ES timing test, the signal-close entry is the useful surprise. Filling at the signal session's close is not free in practice either, since you would need a market-on-close order placed before you know the close. Yet it landed between 0.87 and 1.17 times the honest points depending on the stop width, with no consistent advantage.
The reason is that the close entry does not use information that arrives after the fill. The signal and the fill come from the same moment. The open-entry error does something different: it takes a fill from the morning and pays for it with knowledge from the afternoon. A timing mistake only inflates a backtest when the decision uses information that arrives after the fill price, not merely when the fill is awkward to get.
How to Detect Look Ahead Bias Before It Costs You
Detecting look-ahead bias means proving, input by input, that every value a rule used existed before the order it triggered. Reading the equity curve does not do it. These checks do.
- Timestamp every input. For each value in the rule, write down when it became known: bar close, release time, report filing date. Then write down when the order is placed. Any input stamped after the order is a leak.
- Run the one-bar shift test. Delay every signal by one bar and re-run. A sound rule usually changes a little. A rule that collapses was likely leaning on timing. On the 20-year ES breakout study, the leaky version produced 5.05 times the honest version's points.
- Check the platform settings. On TradingView, look for request.security() calls with barmerge.lookahead_on and no one-bar offset. In any tool, check whether indicators include the current bar and whether "fill on bar close" settings match how you would trade.
- Watch for symptoms. A very smooth curve, a win rate far above similar rules, stops that almost never get hit, and entries that cluster at the exact low of the day are all reasons to audit before celebrating.
- Reconcile against forward fills. Run the rule forward on live or simulated data for a few weeks and compare each fill with what the backtest would have printed for the same day. If the backtest consistently gets better prices, find out why.
The forward check is the one that catches leaks you did not think to look for. It is slow, which is exactly why it is honest.
How Overfitting Grows With Every Parameter You Try
Overfitting in a trading strategy is mostly a counting problem. Every setting you try is another lottery ticket, and the best ticket from many draws looks better than it is. The temptation is to stop the moment a run finally looks good, and to treat that run as the discovery instead of the twentieth attempt.
Why more trials make overfitting likely
Suppose an idea has no edge at all, and you test it with a significance check that a no-edge rule passes 5% of the time by luck. Test it once and the false-alarm risk is 5%. Test many independent versions and the chance that at least one passes climbs fast.
| Independent tests of a no-edge idea | Chance at least one passes at the 5% level |
|---|---|
| 1 | 5% |
| 10 | 40% |
| 20 | 64% |
| 45 | 90% |
| 100 | 99.4% |
| 300 | effectively 100% |
Real parameter sweeps are not fully independent, since a 20-session lookback and a 40-session lookback overlap a lot. That softens the arithmetic but does not remove it.
What the research says about trial counts
Bailey, Borwein, López de Prado and Zhu turned this into a minimum backtest length. With only five years of data, they write, no more than 45 independent model configurations should be tried, or a researcher is almost guaranteed to find one with an in-sample Sharpe ratio of 1 and an expected out-of-sample Sharpe of zero. After only seven configurations, a two-year backtest is expected to produce that same false Sharpe of 1. Their sharper point is that a backtest that does not report how many trials produced it cannot be judged at all.
Harvey, Liu and Zhu reached a related conclusion for academic factor research in NBER Working Paper 20592. Given how many factors have been tested, they argue a newly claimed factor needs a t-ratio above 3.0, not the usual 2.0.
How to limit overfitting and curve fitting
- Keep the parameter count small relative to the number of trades.
- Write the settings you will test before you see results, and log every run, including the abandoned ones.
- Prefer settings that sit in a broad plateau of decent results over a single sharp peak.
- Treat a parameter that only works at one exact value as a warning, not a discovery.
Related lesson: Backtesting a trading strategy
Data Snooping Bias in a 300 Combo Search
Data snooping bias is what happens when the same data is used to try many ideas and then to judge the winner. To see it directly, the ES breakout rule (20-session breakout, 200-session trend filter, ATR stop, fixed hold, next-open entry, 0.58 points of cost) was turned into a grid of 300 combinations:
- Lookback: 10, 20, 40, 60, 120 or 200 sessions.
- Stop: 0.75, 1.0, 1.5, 2.0 or 3.0 times the 14-session ATR.
- Hold: 5, 10, 20, 40 or 60 sessions.
- Trend filter: on or off.
Before any cell was evaluated, the 5,249 sessions were split once. The first 3,674 sessions (70%) are in sample. The last 1,575 sessions, from 2020-08-03 to 2026-11-03, are the holdout.
The winner and its neighbours
The best in-sample cell of the 300-combo ES search used a 40-session lookback, a 0.75 ATR stop, a 60-session hold and the trend filter on. It earned 0.920R per trade over 65 in-sample trades, then 0.599R over 37 holdout trades. That is a 35% haircut, and it is what picking the best of many tends to cost. The winner was partly skill and partly luck, and the holdout took the luck back.
The neighbourhood tells you whether the winner is a plateau or a spike. Each row moves exactly one setting.
| Setting changed from the winner | In-sample R | Holdout R |
|---|---|---|
| None, the winning cell | 0.920R | 0.599R |
| Hold 40 sessions | 0.497R | 0.557R |
| Hold 20 sessions | 0.231R | 0.275R |
| Hold 5 sessions | -0.052R | 0.158R |
| Stop 1.0 ATR | 0.705R | 0.566R |
| Stop 3.0 ATR | 0.273R | 0.349R |
| Lookback 20 sessions | 0.873R | 0.673R |
| Lookback 200 sessions | 0.288R | 1.306R |
| Trend filter off | 0.914R | 0.516R |
The trend filter barely matters, and a 20-session lookback lands close to the winner, but a 200-session lookback cuts the in-sample result to 0.288R. Hold length carries most of the result: drop from 60 sessions to 5 and the in-sample edge turns negative. The 200-session row also earned 1.306R on the holdout, far above the winner, which tells you the holdout period rewarded slow, patient longs rather than this particular setting. That should make you ask whether the "breakout" is doing the work, or whether a long hold on a rising index is.
A random-entry control that searched the same grid
To separate the signal from the search, the identical 300-cell ES breakout grid was run again with the breakout replaced by a reproducible coin flip. On each session, the control entered when a SHA-256 hash of a fixed seed string, the cell's settings and the date fell below that cell's real signal rate. Stop, hold, cost, trend filter and the one-position limit stayed the same.
| Measure | Breakout search | Random-entry search |
|---|---|---|
| Best in-sample cell | 0.920R on 65 trades | 0.880R on 99 trades |
| Same cell on the holdout | 0.599R on 37 trades | 0.257R on 61 trades |
| Median cell in sample | 0.120R | 0.147R |
| Median cell on the holdout | 0.212R | 0.211R |
| Rank correlation, in sample to holdout | 0.66 | 0.65 |
| Cells positive on the holdout | 97% | 96% |
The random search found an in-sample winner at 0.880R, almost as good as the breakout's 0.920R. Its medians match the real grid's. Its rankings carried into the holdout just as well, which means the "in-sample ranking predicts out-of-sample ranking" comfort comes from the stop and hold structure, not from the breakout.
The breakout does keep one real advantage. Its winner held 0.599R on the holdout while the random winner fell to 0.257R, and the real winner's holdout result sits at the 93rd percentile of all 300 control cells. That is weak evidence of something, not proof of an edge. If a trader took only the in-sample table to a live account, they would have no way to tell which of those two stories they were trading.
How in-sample rank carried to the holdout
Sorting the 300 cells of both the ES breakout search and its random-entry control by in-sample result and cutting them into ten bands of 30 shows how the ranking transferred.
| In-sample band | Breakout in sample | Breakout holdout | Control in sample | Control holdout |
|---|---|---|---|---|
| Top 10% | 0.612R | 0.660R | 0.475R | 0.467R |
| 2nd | 0.357R | 0.516R | 0.322R | 0.402R |
| 3rd | 0.259R | 0.359R | 0.258R | 0.377R |
| 4th | 0.206R | 0.274R | 0.208R | 0.302R |
| 5th | 0.149R | 0.314R | 0.169R | 0.271R |
| 6th | 0.100R | 0.266R | 0.121R | 0.174R |
| 7th | 0.060R | 0.169R | 0.097R | 0.153R |
| 8th | 0.017R | 0.169R | 0.070R | 0.164R |
| 9th | -0.015R | 0.072R | 0.044R | 0.104R |
| Bottom 10% | -0.062R | 0.092R | 0.004R | 0.100R |
Every band in both searches was positive on the holdout, including the bands the in-sample sort called worst. The holdout ran from August 2020 to November 2026, a period in which a long-only rule on the S&P 500 was helped by the index's rise. A holdout that flatters everything cannot tell good settings from lucky ones.
Backtest Validation Methods That Catch Both Problems
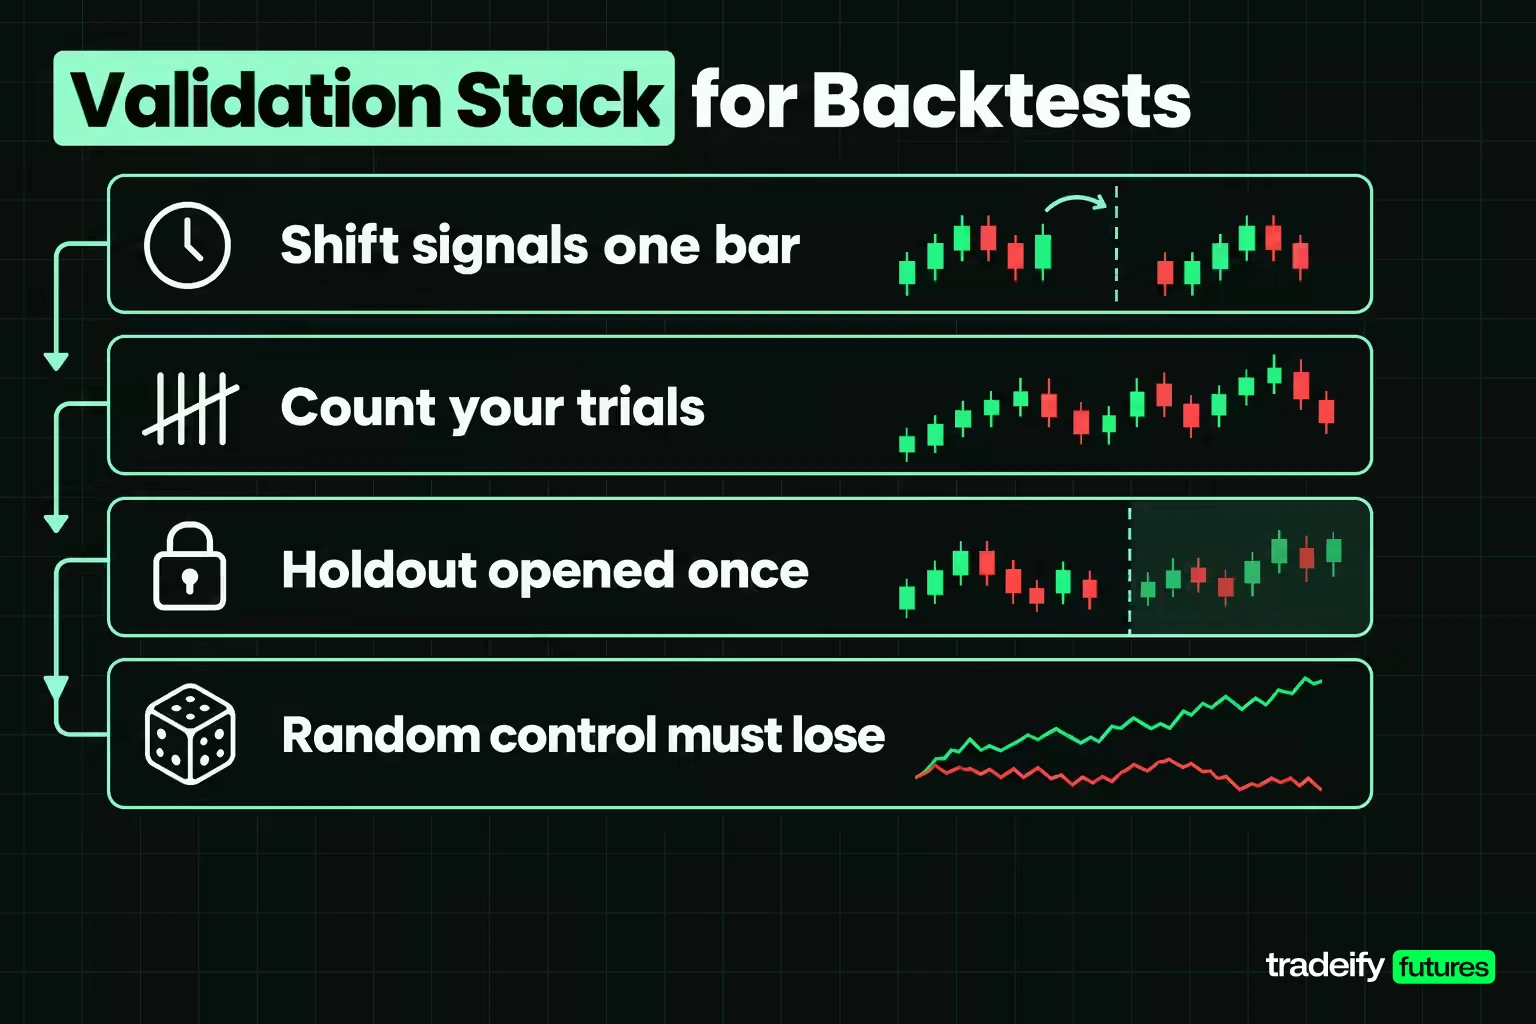
Backtest validation is the set of checks that has to be decided before results are seen. Each method catches something the others miss, so they work as a stack.
A holdout you open once
Split the data before the first run and never tune on the second part. In the ES study, that meant 3,674 sessions for development and 1,575 for the holdout. A holdout catches overfitting because settings chosen on the first part have no mechanical reason to keep working on the second.
Open it more than once and it stops being a holdout. Every look you take and then react to turns it into another selection set. Also check what kind of market the holdout covers. One strong trend can make every long rule pass.
A random-entry control that has to lose
A random-entry control answers the question a holdout cannot: how good does this search look when the signal is removed? Give the control the same stop, hold, cost, filters and position limits, let it search the same grid, and compare winners and medians. If the control's best cell is close to yours, the search produced your winner, not the rule. Fix the seed in writing so anyone can reproduce it.
Walk-forward analysis and its limits
Walk-forward analysis re-fits settings on a rolling window and tests on the next slice, again and again. It gives a more realistic view of a strategy you will re-tune live, and it removes the luck of one static split. It does not remove selection. A setting chosen as the best of 300 on every window is still the best of 300 every time, so the trial count and the control still belong next to it.
Related lesson: Forward testing and walk-forward analysis
Multiple-testing thresholds and reconciliation
Multiple-testing thresholds raise the bar a backtest has to clear as the trial count rises. Harvey, Liu and Zhu's t-ratio of 3.0 is one benchmark for that idea. Reconciliation is the plumbing check that sits beside it: confirm data timestamps against release times, check that every fill price existed at the moment the rule could have acted, and compare backtest fills with forward or simulated fills for the same days.
Common Backtest Pitfalls That Survive an Honest Test
A backtest can be free of look-ahead bias and still mislead you. The honest ES rule (20-session breakout above the 200-session average, 1.5 ATR stop, 10-session hold, next-open entry, 0.58 points of cost) is a clean example. It produced 226 trades from 2006-10-13 to 2026-10-14, about 11.3 a year, at 0.088R per trade with 55.3% winners.
Too few trades to tell edge from noise
A bootstrap with 10,000 resamples of the honest ES breakout rule's 226 trades puts the mean at 0.088R with a 95% interval from -0.045R to 0.223R. The interval includes zero. At this rule's own spread of outcomes, it would take about 527 trades, roughly 47 years at the rule's pace, for the interval to clear zero. A small edge on a few hundred trades is consistent with a real effect and equally consistent with noise.
Fills past the stop
On daily bars, a session that opens beyond your stop fills at the open, not at the stop. A stop order becomes a market order when it triggers. The honest ES base rule had 87 stop exits and 139 time exits, with no gap-through fills. Across all 300 grid cells, though, 287 of 52,107 exits filled at an open beyond the stop, 0.55%. Rare in a summary, painful in a bad week, and invisible if your backtest assumes every stop fills at its price.
Sizing that changes the conclusion
In the honest ES breakout backtest, the stop is a multiple of ATR, so the dollars at risk move with volatility. At one ES contract, risk per trade ran from $861.16 at the 5th percentile to $6,369.11 at the 95th, with a median of $1,751.12. That is a 7.4 times range.
Held at one contract, the trade list finishes at $62,615.45. Sized to a constant $1,000 of risk per trade, the same entries and exits finish at $19,965.62. Same trades, about a third of the result, because the big winners arrived when the stop was wide.
Related lesson: Position sizing
A few trades carry the total
In the honest ES breakout backtest, the single best trade made $17,821.00, which is 28.5% of the one-contract net. Remove the ten best trades and the total becomes -$25,569.55. A result that lives in ten trades out of 226 needs those ten to repeat, and nothing in the backtest says they will.
The passive baseline for a long-only backtest
The honest ES breakout rule was in the market for 1,803 sessions, 35.7% of the tested period. Over that span the index rose 6,237.75 points, about 1.24 points a session, so that much exposure would have collected roughly 2,227.50 points of drift with no decisions at all. Simply holding ES over the same 226 trade windows made 1,454.25 points before costs. The rule made 1,252.31 points after costs, 201.94 points behind. A long-only rule on a rising index has to beat that baseline before it can claim anything.
Psychological traps when reading a backtest
The technical pitfalls have a human twin. Once you like a result, you look harder for reasons it is right than for reasons it is wrong. You stop testing after a good run and keep testing after a bad one. You remember the version that worked and forget the ones that did not. None of that is a character flaw. It is what happens when you want the strategy to be real, which is precisely why the fix has to be a written rule rather than willpower: write the plan before you run it, and log every run.
Overfitting and Look Ahead Bias in Machine Learning Models
Machine learning makes both problems easier to create and harder to see, because the model hides the decisions a rule-based trader would write down. The same two failures show up under different names.
Leakage, the machine learning name for look-ahead bias
- Preprocessing on the full dataset. Scaling, normalizing or filling missing values with statistics computed from all the data lets the training set see the test set's mean and range.
- Labels that overlap features. If the target is the return over the next 10 sessions, a feature built from overlapping windows can contain part of the answer.
- Shuffled cross-validation. Standard k-fold mixes past and future, so the model trains on 2024 to predict 2019. The scikit-learn documentation for TimeSeriesSplit says this directly: ordinary cross-validation on time-ordered data leads to training on future data and evaluating on past data. TimeSeriesSplit trains on earlier folds, tests on the next one, and offers a gap parameter to leave space between them.
- Overlapping samples across the split. Marcos López de Prado's Advances in Financial Machine Learning describes purging training samples whose label windows overlap the test period, and adding an embargo after it, so information cannot leak across the boundary.
Hyperparameter search, the machine learning name for data snooping
Every learning rate, tree depth, feature set and lookback you try is another trial. A grid of a few hundred model settings is the same 300-combo problem as the ES study, with less visibility. Count the trials, keep a final test set the search never touched, and run a control model on shuffled or random labels. If the control scores about as well as the real model, the model learned the search, not the market.
The four types of bias that matter for a trading model
There is no single official list of "four types of bias" in machine learning, and general lists cover topics like sampling and measurement bias. For a trading model, the four that do the most damage are look-ahead bias (leakage), survivorship bias in the training universe, data-snooping bias from repeated searches, and overfitting from too much model freedom for the data.
A Bias Checklist to Run Before Trusting a Backtest
This checklist covers overfitting and look-ahead bias in the order that saves the most time. The first three steps are cheap and can invalidate everything after them.
- Write the rule down in full before opening the data: entry price, exit order of precedence, stop logic and cost. If the rule changes after you see the curve, you are already selecting.
- Timestamp every input against the order time, then shift every signal one bar and re-run.
- Count every trial, including the abandoned ones, and report the number with the result.
- Split the data once, develop on the first part, and open the holdout one time. Note what kind of market the holdout covers.
- Run a random-entry control through the same search with the same stop, hold, cost and filters. If it nearly wins, the search won.
- Report the confidence interval and the trade count the interval would need, not just the average.
- Cost every trade, and count exits that filled past the stop as their own category.
- State the result at one contract and at fixed risk, and check the two agree in sign.
- Compare against holding the market over the same exposure, not against zero.
- Run it forward on simulated data and reconcile fills before risking money.
Related lesson: How to keep a trading journal
One practical note if you trade with us. On our accounts, bots and algorithms are allowed only when you own the strategy exclusively, it is not shared, and it is not a high-frequency bot. Every position must also be closed by 4:45 PM ET, with no overnight or swing holds, so a multi-day daily-bar rule like the ES breakout in this guide could not be traded on our accounts as written. The backtest that matters there is an intraday version that is flat before the close. Our funded accounts are simulated.
Frequently Asked Questions About Backtest Bias
What is a look-ahead bias?
Look-ahead bias is using information in a backtest that was not available when the trade decision had to be made. A typical example is entering at a session's open because of that session's close. It makes trades look better than any trader could have executed.
What is the bias associated with overfitting?
Overfitting sits on the low-bias, high-variance side of the bias-variance tradeoff. The model matches its training data closely but its results swing when the data changes. In backtesting, the related bias is data snooping, where the same data is used to pick and to judge a strategy.
Is bias the same as underfitting?
Not exactly, but they are linked. High bias in the statistical sense means a model is too simple to capture a real pattern, which is what underfitting describes. Look-ahead bias is a different use of the word and has nothing to do with model complexity.
What are the four types of bias in machine learning?
For trading models, the four types of bias that matter most are look-ahead bias (leakage), survivorship bias, data-snooping bias and overfitting. General machine learning lists vary, and there is no single standard set of four. Each needs its own check.
How do you detect look-ahead bias in a backtest?
Timestamp every input against the moment the order would be placed, then delay every signal by one bar and re-run. A result that collapses or changes sharply was likely leaning on timing. Then compare backtest fills with forward or simulated fills for the same days.
How many backtests before overfitting becomes likely?
Overfitting becomes likely after fewer backtests than most traders expect, and the threshold depends on how much data you have. Bailey and co-authors suggest no more than 45 independent configurations on five years of data. In the ES study, a random-entry control searching 300 combinations still found a 0.880R in-sample winner.
Does walk-forward testing fix overfitting?
Not by itself. Walk-forward analysis tests re-fitted settings on unseen slices, which is more realistic than one static split. But a setting picked as the best of many on each window is still the best of many, so keep counting trials and run a control.
This guide is for education only and is not trading, investment or tax advice. Futures are leveraged, and losses can exceed what you expect or deposit. The ES study is a backtest on historical daily data with stated cost and fill assumptions; it is not a live trading record, it carries the benefit of hindsight, and it does not show results that would have been achieved in live trading. Funded and evaluation accounts at prop firms use simulated capital with their own rules. Past and simulated performance do not indicate future results.


