



TL;DR: Confirmation bias in trading means counting the evidence that agrees with your trade and explaining away the rest. On 590 E-mini breakouts, price moved half a risk unit your way first on 71.0% of trades, and on 51.4% of the losers. So an early move in your favour is not proof, and neither is a backtest you picked from your own best results. The fix is a written test that can prove you wrong, filled in before you enter.
You are long, the trade is up a little, and every headline you scroll past seems to agree with you. The pullback that should worry you looks like a gift. You start thinking about a bigger target.
That moment is where confirmation bias does its work.
Confirmation bias is not a character flaw that disciplined traders grow out of. It is a default setting in how people handle evidence, and it shows up in chart reading, in trade management, in what you remember from last month and in how you choose a strategy. The useful question is not whether you have it. It is where it is costing you and how to build a check that catches it before the order goes in.
What Confirmation Bias in Trading Means
Confirmation bias is the habit of seeking or interpreting evidence in ways that favour what you already believe. Psychologist Raymond Nickerson's 1998 review in Review of General Psychology, the standard survey of the research, defines it as "the seeking or interpreting of evidence in ways that are partial to existing beliefs, expectations, or a hypothesis in hand." He stresses that it is usually unwitting. People are not choosing to ignore the other side. They simply do not go looking for it.
The cleanest demonstration is Peter Wason's 1960 number task. Wason showed people the sequence 2, 4, 6 and asked them to work out the rule behind it by proposing their own sequences. The real rule was any three numbers in ascending order. Most people guessed something narrower, such as "add two each time," and then tested it with sequences that fitted their guess, like 8, 10, 12. Every test came back "yes," so nothing could prove them wrong. Of Wason's 29 subjects, only six reached the correct rule without first announcing a wrong one, and nine announced two or more wrong rules.
That is the whole problem in miniature. A test that can only say yes teaches you nothing, and most traders test their ideas exactly that way.
In trading, confirmation bias works in three places:
- What you look at before the entry. You find four reasons the setup works and stop reading at four.
- What you remember after the exit. Trades that went straight to target feel like the normal case, and the ones that chopped around feel like bad luck.
- What you count as evidence that a rule works. You test the strategy on the cases that already look good and call the result proof.
The first two are uncomfortable. The third is expensive, because it decides which rules you trade with real money for months.
Related lesson: Trading psychology basics
The Psychology Behind Confirmation Bias
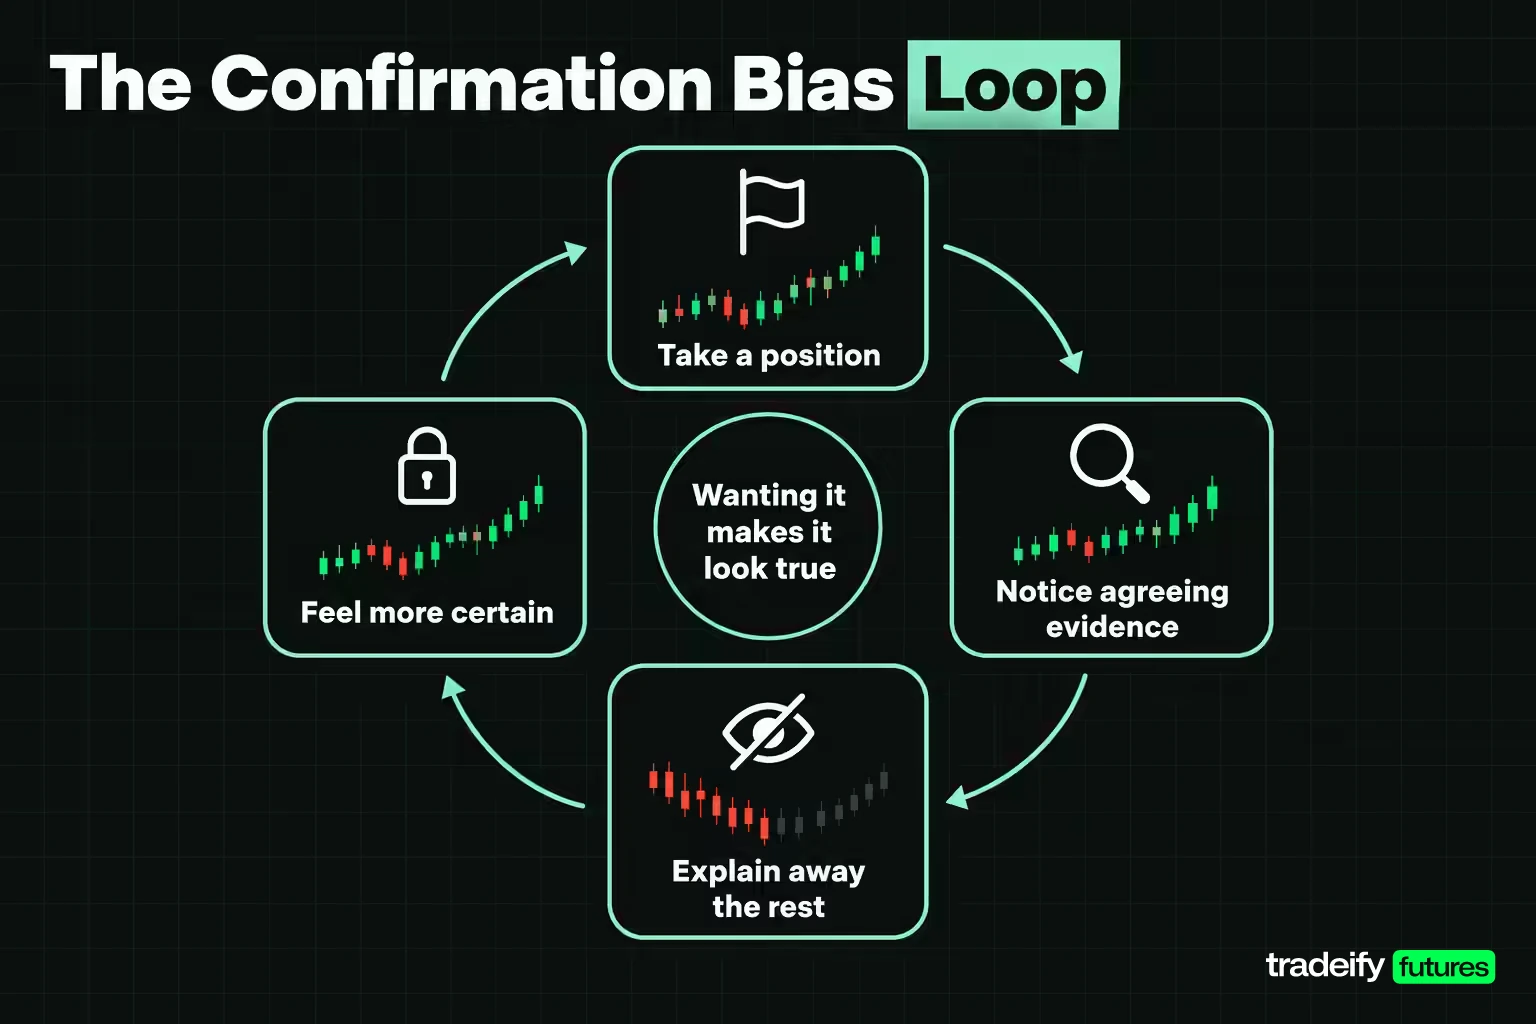
Confirmation bias survives because it is useful most of the time. Nickerson's review groups the explanations into a few families, and each one shows up at a trading desk.
The desire to believe. People find it easier to accept propositions they would like to be true. Once you are long, a rising market is something you want, and wanting it makes supportive evidence feel stronger than it is.
Limited processing. Checking every piece of contrary evidence takes effort. Under time pressure, with a position open, the brain takes the shortcut of checking whether new information fits the current story.
First impressions stick. Nickerson describes a primacy effect: information that arrives early carries more weight than information that arrives later, and the first opinion colours how later evidence is read. Belief persistence follows from it. People question information that conflicts with an existing belief more than information that supports it, and they tend to read ambiguous information as confirming.
The same data, opposite conclusions. Nickerson cites a 1979 study by Lord, Ross and Lepper in which two people with opposite views examined the same evidence and both came away more convinced of what they already thought. Every bull and every bear watching the same candle is running that experiment.
How Fear and Greed Feed Confirmation Bias
Emotion turns the bias up. Once money is at risk, admitting the thesis is wrong means admitting a loss, so the mind looks harder for reasons to stay. Greed works the same way on winners: a trade that is working invites you to believe it will keep working, so you stop checking the level that would end it.
The practical response is not to stop feeling. It is to make the key decisions while you are flat. An invalidation level written before the entry is a decision made by the calm version of you, and the stressed version only has to follow it. A cooling-off rule after a loss works the same way: it moves the next decision away from the moment when you most want to be proved right.
Related lesson: The belief side of the same problem
How Confirmation Bias Distorts Charts and News
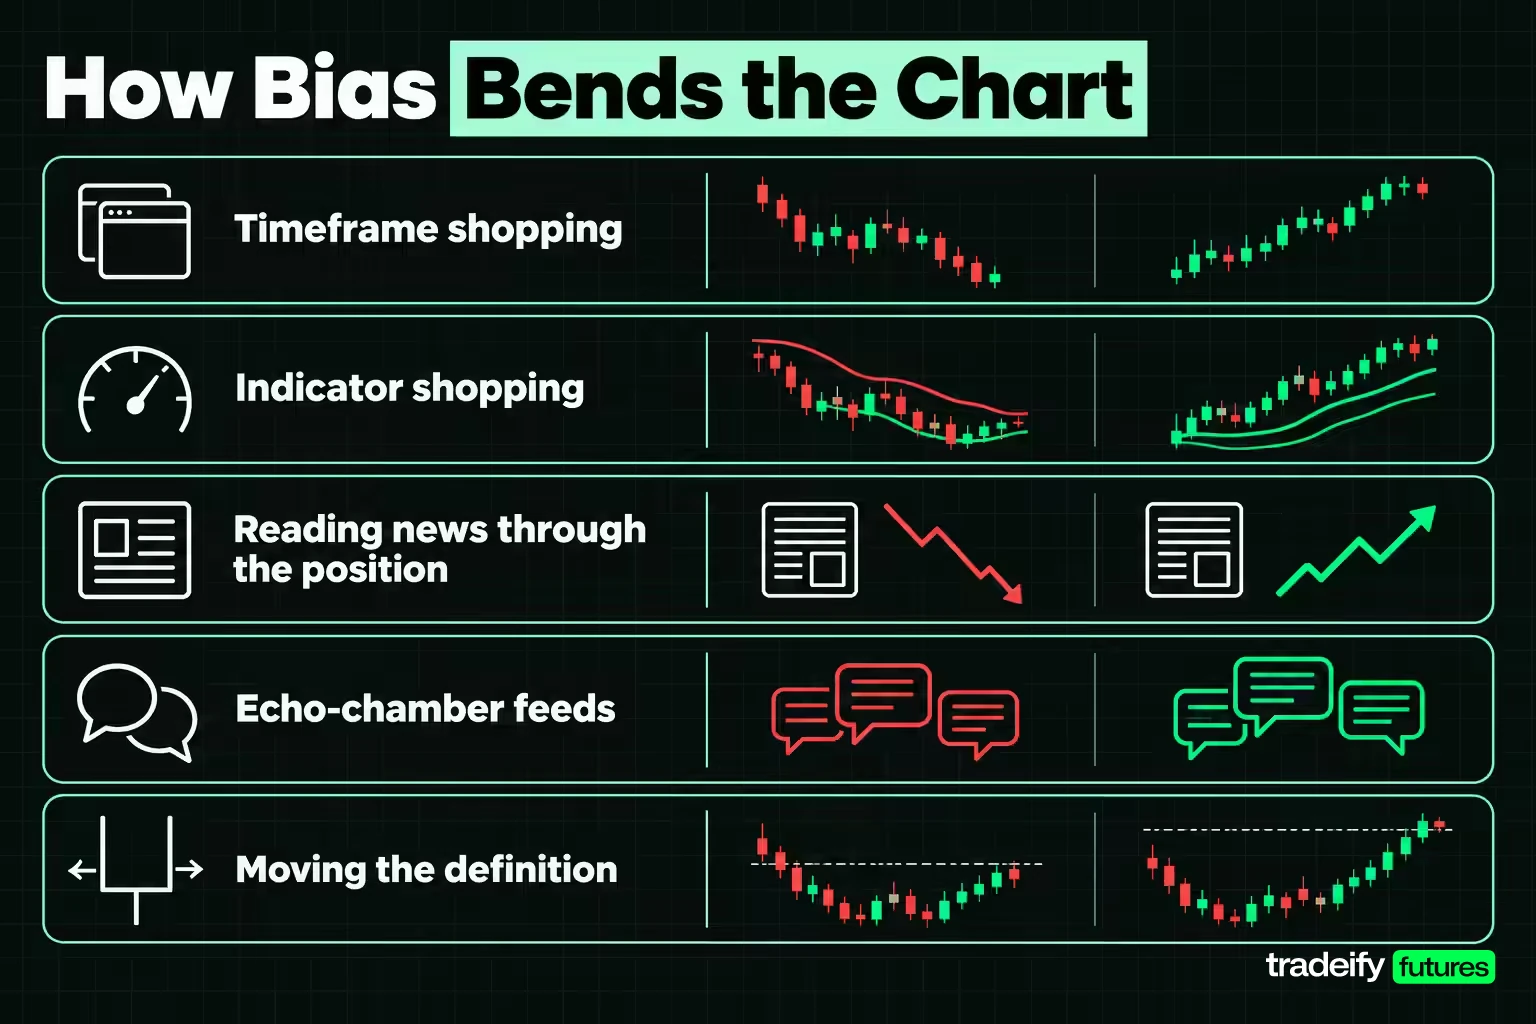
Biased interpretation of market signals is the most visible form of confirmation bias, because it happens on the chart in front of you. A few common patterns:
- Timeframe shopping. The 5-minute chart looks weak, so you check the hourly, which looks fine. You stop there, because the hourly agreed.
- Indicator shopping. RSI says overbought, MACD says momentum is still up. Only one of them makes it into your reasoning.
- Reading news through the position. A strong jobs number is "bullish growth" when you are long and "hawkish rate risk" when you are short. The data did not change. Your position did.
- Echo-chamber feeds. Chat rooms and social feeds you follow tend to share your style and often your bias. Agreement there is not independent evidence.
- Moving the definition. A support level that breaks becomes "a liquidity sweep before the real move," so the thesis never has to be wrong.
Imagine a trader long E-mini S&P 500 futures into an inflation report. The number comes in hotter than forecast and the market drops, then bounces partway. The trader reads the bounce as buyers defending the level and adds. A neutral reader would say price is still under where it was before the report and the bounce has not reclaimed anything. Both are looking at the same bars. Only one of them had a position before the data came out.
The tell is asymmetry. If you need one piece of evidence to stay in and five to get out, your bar for evidence depends on which side you are on.
How Confirmation Bias Changes Entries, Exits and Size
Confirmation bias does its damage through specific decisions, and each one feels reasonable at the time:
- Early entries. You want the setup, so a partial signal counts as a full one. The trade goes in before the trigger actually fires.
- Moved stops. Price nears the stop, you find a "better" level further away, and the original risk quietly grows.
- Widened targets. The trade moves your way, so you push the target out because the thesis "is working." A planned 2R exit becomes a round trip.
- Adding on agreement. Each new confirming signal feels like a reason to add, so size grows when you are most convinced rather than when the evidence is strongest.
- Holding losers, cutting winners. A loser gets more time because the story is still alive. A winner gets cut early because one red bar looks like the start of the end.
The pattern is the same in all five. Evidence that supports the trade changes the plan in your favour, and evidence against it is explained away so the plan does not have to change. A rule written before entry blocks most of this, because it removes the in-trade decision the bias needs to work on.
Measuring the Confirming Move on 590 E-mini Breakouts
One of the most common confirmation traps is treating the first move in your favour as proof the trade is working. That claim can be measured.
This illustrative ES study uses a simple rule with no discretion in it. When an E-mini S&P 500 (ES) session closes above the highest high of the prior 20 sessions, buy the next session's open. The stop sits one 14-session average true range (Wilder's ATR) under the entry, the target sits two ranges above it (2R), and the trade closes after 20 sessions at the latest. The data is 5,032 daily sessions of continuous front-month ES from 18 September 2006 to 16 September 2026, with no commission or slippage. It shows how the bias works. It is not a strategy recommendation.
In this guide's study, run on Yahoo Finance's continuous ES daily data, the rule fired 590 times. It won 40.3% of the time and averaged +0.154R per trade.
Now ask one question of every trade: did price trade half a risk unit (+0.5R) in your favour before it touched the stop?
In the same ES study, on 419 of the 590 trades, 71.0%, it did. Of the 352 losing trades, 181 had that confirming move first. That is 51.4% of the losers. And of the 419 trades that showed the confirming move, 181 still lost, which is 43.2%.
Daily bars cannot always tell you which level traded first when a session touched both. Counting those sessions as stop-first instead, the ES study's figures become 69.5% of all trades and 48.9% of losers. The conclusion does not change.
Why the Confirming Move Proves So Little
In the twenty-year ES breakout study, the confirming-move group did win more often, 56.8% against 40.3% overall. But part of that is built into the definition: the other group is trades that hit the stop first, and they had already lost. The useful fact for a trader in the moment is the other one. A move of half a risk unit in your favour happened on most trades, and more than four in ten of the trades that showed it still ended in a loss.
Move the line and the numbers move with it. Here is how the same 590 ES breakouts from this guide's study look at three confirming lines:
| Confirming line | Share of all trades | Share of losing trades |
|---|---|---|
| +0.25R before the stop | 85.6% | 75.9% |
| +0.5R before the stop | 71.0% | 51.4% |
| +1R before the stop | 53.7% | 22.7% |
In that ES study, a quarter-risk move in your favour showed up on three in four losers. That is ordinary price movement inside a 2R trade, not a sign that the thesis is right. The feeling that the trade is working is real. It is just not evidence, and it should not change the plan. The practical rule follows: do not widen a target, add size or loosen a stop because the first move went your way.
Testing a Trading Rule Against Its Near Misses
Wason's subjects failed because they only tested cases that already fitted their guess. The trading version of his fix is the near-miss test: look at the setups that almost triggered and see whether they behave any differently.
Using the same ES breakout rule, a near miss is a session that closed at or up to a quarter of an ATR short of the 20-session high. Structurally it is the same idea. It just missed the line. A trader looking for confirmation never studies these, because they are not trades.
There were 495 near misses, managed with the identical stop, target and 20-session cap:
| Setup group | Count | Average result | Win rate |
|---|---|---|---|
| Breakouts the rule takes | 590 | +0.154R | 40.3% |
| Near misses the rule skips | 495 | +0.208R | 41.6% |
In this guide's ES study, the breakouts averaged 0.054R less than the near misses, with a resampled 95% interval of -0.225R to +0.117R. In plain terms, the line that separates a signal from a near miss did not produce a measurable difference over twenty years. The skipped setups did, if anything, slightly better.
The Line Test for a Trading Trigger
If a trigger carries information at the exact level where it fires, trades just past the line should beat trades just short of it. This guide's twenty-year ES breakout study says otherwise:
| Distance from the trigger line | Breakouts and average | Near misses and average |
|---|---|---|
| Within 0.1 ATR | 132 at +0.165R | 171 at +0.319R |
| Within 0.3 ATR | 363 at +0.177R | 587 at +0.185R |
In the same ES study, how far a breakout closed past the line made no difference either. The correlation between distance past the line and the trade's result was 0.009, essentially zero. Sorted into thirds by distance, the closest third averaged +0.151R, the middle +0.166R and the furthest +0.145R.
One caveat matters here. A 20-session high is not an arbitrary level, so the level itself may still carry information that this test does not isolate. What the test does show is narrower and still useful: there is no gradient at the line. A trader who believes a strong close past the level is a better signal than a weak one is holding a belief this data does not support.
That is the value of a near-miss test. It gives the rule a real chance to fail. If the near misses do as well as the signals, your trigger is not what is producing the result, and your confidence in it is coming from somewhere else.
Related lesson: How to split and test a sample properly
Confirmation Bias in Backtesting
Backtesting is where confirmation bias does the most damage, because a backtest looks objective. You try settings until one looks good, and that one becomes "the strategy." The search itself can confirm your idea for you.
Here is how much, measured on the same ES breakout family. Widen the rule into a grid of 36 versions: nine lookbacks (5, 10, 15, 20, 25, 30, 40, 50 and 60 sessions) and four targets (1, 1.5, 2 and 3 ATR), each with the same stop and 20-session cap. Over the full twenty years, the average version made +0.106R per trade. The best made +0.229R (5-session lookback, 3 ATR target), and the worst +0.004R (50-session lookback, 1 ATR target).
Then run the search the way a trader would. Split the years at random into a selection half and a test half, pick the version with the best result on the selection half, and score it on the test half it never saw. Repeat 2,000 times:
| Search result | Average per trade |
|---|---|
| Picked version on the half it was chosen from | +0.254R |
| Same version on the unseen half | +0.176R |
| Average of all 36 versions on the unseen half | +0.102R |
The search was not worthless. In this guide's ES grid study, the picked version beat the grid average on unseen data by 0.074R, and it landed in the top quarter of versions on the test half in 75.3% of splits. But the number it showed on the selection half was 0.078R too high, and it was overstated in 66.9% of splits. Roughly half of the edge the backtest appeared to show was real, and roughly half came from picking the best-looking result.
How to Backtest Without Confirming Yourself
A few rules keep a backtest honest:
- Write the rule before you run it. Decide the entry, stop, target and sample period first, then test. Changing the rule after seeing results is a search, even if it is only one change.
- Keep data you never look at. Hold back a period, choose on the rest, and score the final choice once on the untouched part.
- Count every version you tried. Ten tries make the best result look better than one try would, even if nothing changed in the market.
- Run the near-miss test. If the setups that just missed your filter do as well, the filter is decoration.
- Expect the live result to be lower. On this grid the honest estimate was close to the unseen-half figure, not the figure that won the search.
Related lesson: The longer version of this trap
Missed Opportunities and Hidden Risk From Confirmation Bias
Confirmation bias also costs money through the trades you do not take and the risks you do not see.
Skipped setups. A trader who is convinced the market is going up will tend to discount a valid short setup, even when it meets every written rule. The rule did its job. The bias overrode it.
Ignored correlation. A trader long ES who adds a long in Nasdaq 100 futures (NQ) because "it confirms the move" has mostly doubled the same bet. The second chart agreed because the two markets move together, not because it was independent evidence.
Dismissed opposing views. The best argument against your trade is often the one you most want to skip. A bearish analyst you dislike can still be right about the data. Dismissing the source saves you from having to deal with the argument.
Risk that grows quietly. Each confirming signal feels like permission to hold a bit longer or size a bit larger. None of the steps looks big. Together they turn a planned 1R loss into a much larger one.
Confirmation Bias in Market Bubbles
When a whole market shares a belief, confirmation bias becomes collective. Rising prices are read as proof the story is right, which draws in buyers who read the next rise the same way. Warnings are dismissed as coming from people who "don't get it." This feedback between price and belief is one reason speculative manias can run further than fundamentals would suggest, and why they tend to unwind fast once the shared story breaks. For an individual trader, the lesson is simple: a trend everyone agrees on is not extra evidence. It is the same evidence counted many times.
Selective Memory and the Trades You Remember
Selective memory is confirmation bias acting after the fact. You remember trades that fit the story you tell about your trading and forget the ones that do not.
This guide's twenty-year study of 590 E-mini S&P 500 breakouts, run on Yahoo Finance daily data, shows why memory gets this wrong. Only 203 of the 590 trades, 34.4%, reached the 2R target. Just 128, 21.7%, got there without first moving half a risk unit against the entry. Those clean winners are the trades that feel like the strategy "working," and they are the ones you remember. Meanwhile 347 trades hit the stop, and most of them were unremarkable: no drama, just a small loss. A trader working from memory would describe this strategy as cleaner and more reliable than it was.
The same thing happens in a discretionary trader's head. Big wins become stories. Small, ordinary losses blur together. The losses that do get remembered are often filed as bad luck or a manipulated market rather than as normal outcomes of the plan.
What a Trading Journal Should Record
A journal only counters selective memory if it records the things memory distorts:
- The thesis and the invalidation level, written before the entry.
- What happened first after the entry, in your favour or against you.
- Whether the plan changed during the trade, and what evidence you used to change it.
- The result in R, next to the process grade, so a lucky win and a well-executed loss are both visible.
Review the full list, not the highlights. If you only reread the trades you remember, the journal becomes another source of confirmation.
Related lesson: Logging the evidence beside the outcome
A Pre-Entry Test for Confirmation Bias
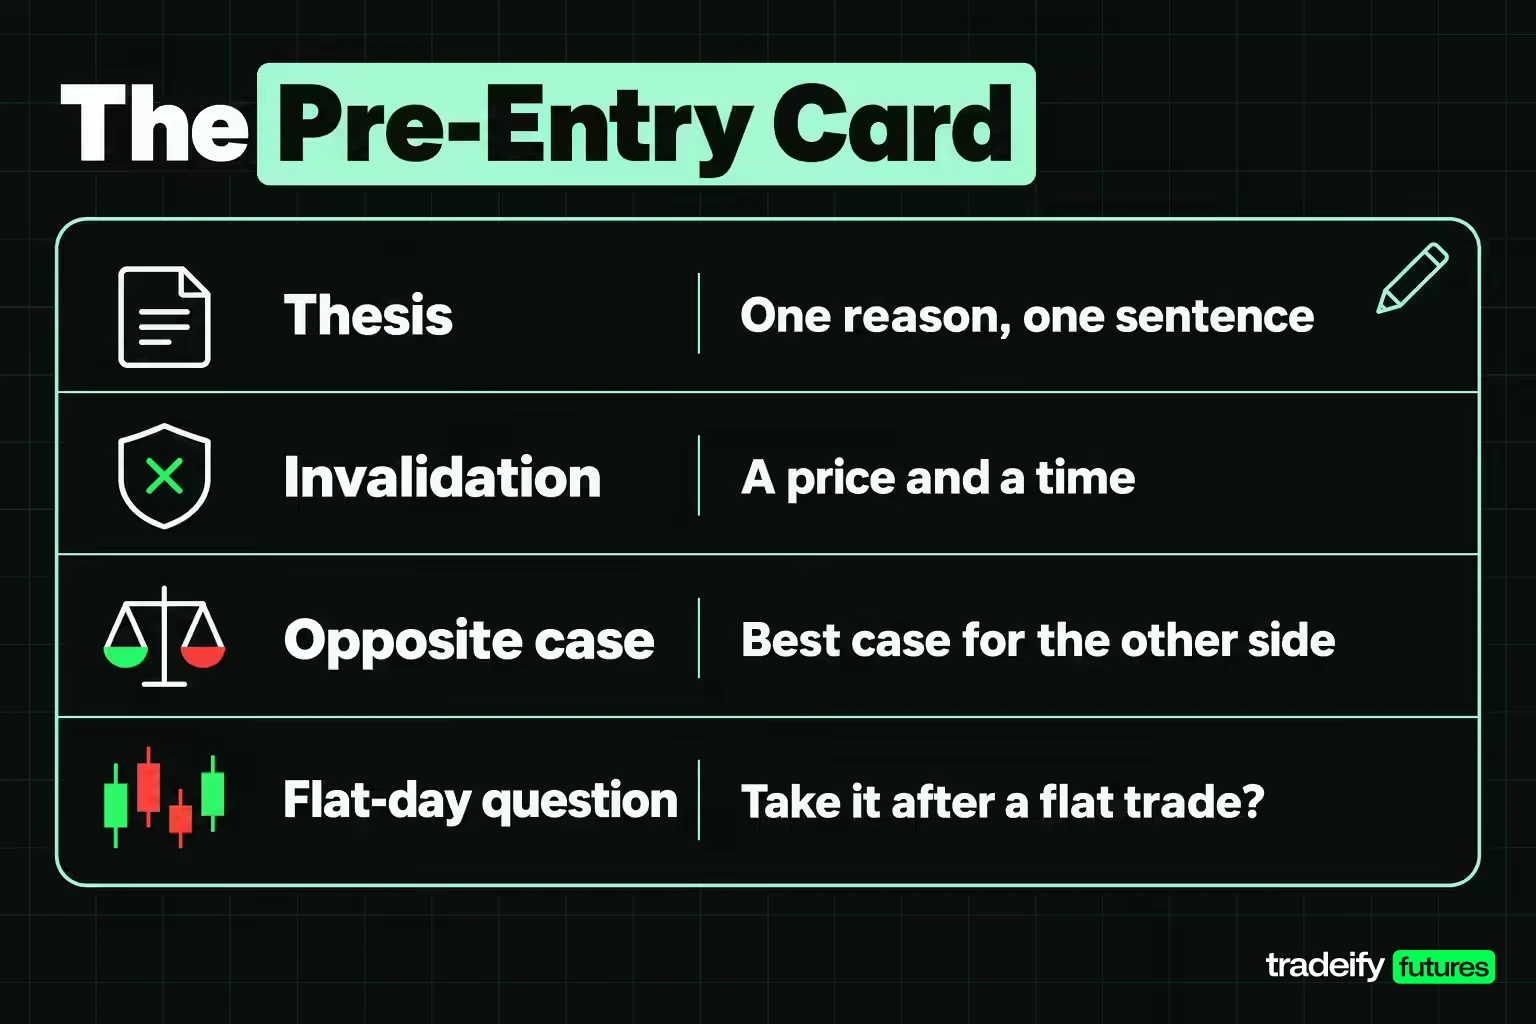
A decision framework works against confirmation bias because it fixes what counts as evidence before you want the trade. The simplest version is a four-slot card filled in before every entry:
| Card slot | What you write | Why it matters |
|---|---|---|
| Thesis | The one reason for the trade in a single sentence | Stops you collecting extra reasons after the fact |
| Invalidation | A price and a time that prove the thesis wrong | Turns "it doesn't feel right" into a checkable fact |
| Opposite case | The best argument for the other side | Forces at least one test that could say no |
| Flat-day question | Would you take this trade if your last trade had closed flat | Separates the setup from your mood and recent results |
Write the invalidation as a price and a time, not a feeling. "If price closes under the prior session low before 11 AM, I am out" can be checked. "If it starts looking weak" cannot, and the bias will rewrite it under pressure.
Scoring the Pre-Entry Card Over 30 Trades
A pre-entry card against confirmation bias (thesis, invalidation, opposite case and flat-day question, written before each trade) needs a sample before you judge it. Use it for 30 trades. Then count:
- How many entries had a written invalidation before the order went in.
- How many times the invalidation fired and you stayed in anyway.
- How many of your losing trades showed an early move in your favour first. In a twenty-year study of 590 E-mini S&P 500 breakouts, 51.4% of losing trades did. If your share looks similar, the early move has been doing work in your decisions that it cannot support.
The goal is not to feel less certain. It is to make your certainty testable.
Related lesson: Separating the rule test from the trade test
Strategies to Overcome Confirmation Bias
No one removes confirmation bias completely. The aim is to build habits that catch it often enough to matter:
- Argue the other side first. Before entering, write the strongest case against the trade. If you cannot write one, you have not looked.
- Get outside review. Share your plan with someone who is free to disagree before the trade, not only the result after it.
- Use mixed and raw sources. Read the data release itself, not only commentary about it.
- Test with numbers. Run the confirming-move count and the near-miss comparison on your own trades. Numbers are harder to explain away than impressions.
- Pre-commit exits. Place the stop and target as orders when you enter, so changing them takes a deliberate action rather than a drift.
- Use cooling-off tools. A daily loss limit or a lockout after a set loss takes the next decision away from the moment you most want to be proved right.
Peer Review and Neutral Research Against Confirmation Bias
Outside review works against confirmation bias because another person does not share your position or your hopes for it. A trading partner, a mentor or a small review group can spot the reason you skipped or the level you moved, as long as they are free to disagree. The format matters more than the person: send the written plan (thesis, invalidation, size) before the trade, then review the result against that plan afterwards. Feedback on results alone turns into a discussion of outcomes, which is where the bias hides. For longer-term investing decisions, a licensed financial adviser can play the same role, with the added check that they must explain their reasoning.
Neutral research does the same job for information. Read primary data where you can: the economic release itself, the exchange's contract specifications, your own platform's trade history. Commentary is useful, but it arrives already interpreted. Follow at least one credible analyst who often disagrees with you, and when several like-minded feeds agree, count that as one opinion repeated, not several independent ones. Charting and journaling tools that show every trade, including the ones you would rather forget, are worth more than tools that make the good trades easy to find.
Avoiding the Overcorrection Trap
Traders who learn about confirmation bias sometimes swap it for its mirror: hunting for reasons every setup is wrong until nothing is tradeable. That is not objectivity. It is the same bias pointed at a new belief, that every trade is bad. Falsification is a filter on evidence, not a rule against entering. When your written thesis, invalidation level and opposite case all check out, take the trade at your planned size and let the invalidation do its job.
Platform Risk Tools That Limit Confirmation Bias
Platform risk tools can enforce an exit plan written before a trade, when confirmation bias is pushing you to stay in. On our accounts, they can back up the plan you wrote while flat. Tradovate's personal Risk Settings let you set daily and weekly loss limits that lock the account when hit, and they work on our evaluation and Sim Funded accounts, though they are your own limits and do not replace our rules. Tradesea offers personal lockouts that block new orders for a cooling-off period. On a Growth evaluation, hitting the Daily Loss Limit puts the account in liquidation-only mode until the next trading day, which also stops a losing day from becoming a fight to be proved right.
Confirmation Bias in Trading FAQ
What is an example of confirmation bias?
A trader long ES sees the first move go half a risk unit their way, reads it as proof the thesis is working, and pushes the target out. In an illustrative study run for this guide on twenty years of Yahoo Finance ES daily data, that move happened before the stop on 71.0% of trades, including 51.4% of the losers. The move felt like evidence, but it showed up on winners and losers alike.
What are some common biases in trading?
Confirmation bias, overconfidence, loss aversion, anchoring, recency bias and hindsight bias are the most cited. They often work together: confirmation bias selects the evidence, and overconfidence decides how much to bet on it. A 2010 field study by Park, Konana, Gu, Kumar and Raghunathan, using 502 investor responses from a South Korean stock message board, found that investors with stronger confirmation bias were more overconfident, traded more often and earned lower returns.
What is the 84% rule in trading?
There is no single standard definition. Different educators use the 84% label for a bell-curve idea about standard deviations, for how often price returns to a value area, or as a slogan that most trading success comes from risk control. No published dataset stands behind the number. Treat it as a claim to test on your own data before using it.
What is the 3-5-7 rule in trading?
It is a rule of thumb for risk, not a regulation. Common versions cap risk at 3% of the account per trade and 5% across all open trades, while the 7 is read different ways, often as a 7% profit target. Check any version against your own account rules and loss limits before adopting it.
Is confirmation bias the same as overconfidence?
No. Overconfidence is a belief about how accurate you are, while confirmation bias is a filter on which evidence you gather and how you read it. The two feed each other, because filtered evidence makes you feel more accurate than you are.
How to Run a Confirmation Bias Check on Your Trades
Pull your last 30 trades. For each one, mark whether price moved in your favour before it moved against you, and whether the trade won. If your losers show the early favourable move about as often as your winners do, stop treating that move as a reason to hold longer, add size or widen the target.
Then take one trigger you trade and compare it with its near misses, the setups that just failed to qualify, using the same stop and target. If the near misses do as well, change your reason for entering before you change anything else. And start the pre-entry card on your next session, before the first order.
This guide is educational and is not financial advice. The ES figures are from a historical study on continuous daily data with no commissions or slippage, and they do not predict future results. Futures trading uses leverage, and losses can exceed what you expect. Funded and evaluation accounts at prop firms run in a simulated setting, and results there are not the same as live trading.


