



TL;DR: A trade review process turns your log into one decision per period: keep, fix a behavior, or test a change. Review single trades for process, weeks for discipline and only large samples for edge. In a 592-trade E-mini study, a 12-trade month showed the wrong sign 43.2% of the time. Change a setting only when the gap clears the bar for your trade count.
What a Trade Review Process Is For
You have a log full of trades and a vague sense that something needs to change. A trade review process is how that log becomes a decision: a scheduled reading of your own trades, with fixed questions, that ends in a call you can act on.
The journal is the record. The review is the reading. Plenty of traders keep the first and skip the second, which is how the same three mistakes survive for years: a stop moved mid-trade, size bumped after a hot streak, a setup dropped after four losses.
A review that earns its time answers three questions, in this order.
- What did the account actually do over the window, in total and per trade?
- Did the process hold, whatever the result was?
- What single change, if any, does the evidence in front of you support?
The third question is where reviews go wrong. Sitting in front of a month of trades, the natural move is to sort them into groups, find the group that looks best and act on it. It feels like analysis. At a normal monthly trade count it is closer to a coin flip with a story attached. A review only helps if it knows how much its own sample can see.
So the output of a trade review process is narrow on purpose. It is one of three things: keep going unchanged, fix a behavior (which needs no market evidence), or log a dated hypothesis to test over enough trades to judge it.
Recording Trade Data for Later Review
Trade review depends on what was written down while the trade was live. A review cannot recover a reason you never recorded, and memory rewrites reasons to fit the outcome within a day or two.
Record these fields on every trade, ideally before the exit for the planning fields and right after the exit for the rest.
| Field | What to write | Why the review needs it |
|---|---|---|
| Date, time, instrument, contract | Session date, entry time, symbol and contract month | Lets you sort by time of day and session |
| Direction and size | Long or short, number of contracts | Checks size against your plan |
| Planned entry, stop and target | Prices written before the order | Defines 1R and the plan you are graded against |
| Actual entry and exit | Fill prices and exit time | Measures slippage, chasing and early exits |
| Result in R and currency | Profit or loss divided by planned risk | Makes trades comparable across size changes |
| Setup tag | One label from a fixed list | Groups trades for pattern work |
| Market context | Trend, range, news day, volatility note | Separates a bad setup from a bad backdrop |
| Rule check | Yes or no on each plan rule | Feeds the process score |
| Screenshot | Chart at entry and at exit | Shows what you saw, not what you remember |
| One-line note | The decision that was hardest to make | Keeps the emotional texture of the trade |
Two habits make this list usable. Write the R value for every trade, because currency results are not comparable once your size changes, and R results are. And keep the setup tag list short and fixed, because a tag invented after the trade is usually a description of the outcome.
Market context notes for a trade review
Market context is the field most traders skip and later wish they had. A short note is enough: was the session trending or rotating, was there a scheduled release, was the range unusually wide or narrow? The point is not to predict anything. It is to let a later review ask whether a setup fails everywhere or only on, say, range days around a data release, which is a very different fix.
What a Trading Journal Needs for Review
A trading journal is the review's raw material, and it needs more than the broker's fill list. Fills tell you what happened. The journal adds what you planned, why you took the trade, and whether you followed your own rules, which are the parts a review actually grades.
Related lesson: How to keep a trading journal that a review can read
What separates a journal that supports review from one that just stores trades:
- Plan versus actual on the same line. Planned entry, stop and target next to the real fills, so a moved stop or a chased entry is visible without memory.
- Reasons written before the outcome. A reason typed after the exit is contaminated by the result. Even one sentence before the order goes in is worth more than a paragraph afterwards.
- Searchable, fixed tags. Setup, session, context and rule breaks, each from a short list, so you can filter later instead of rereading everything.
- Missed and skipped trades. A valid setup you did not take is data too. Leaving it out makes your discipline look better and your edge look different than it is.
Keep the journal small enough to maintain on a bad day. A journal with twelve fields you fill in every time beats one with forty you abandon by week three. If a field has not changed a single review decision in three months, drop it.
Review Tools and Software Compared
Review tools fall into three groups, and the right choice depends on how many trades you take and how much you want to customize.
| Tool type | Trade import | Custom tags and fields | Built-in statistics | Main weakness |
|---|---|---|---|---|
| Spreadsheet | Manual or CSV paste | Unlimited | Only what you build | Easy to stop updating |
| Dedicated journal software | Usually automatic from the broker or platform | Good, within the app's design | Win rate, expectancy, equity curve, filters | Subscription cost and a fixed data model |
| Platform performance report | Automatic | Usually none | P&L, win rate, trade counts | No plan, reasons or rule checks |
A spreadsheet is the most flexible review tool and the one most likely to go stale. It works well if you trade a handful of times a week and want to own every formula. Dedicated journal software saves the typing and adds filters and charts, but you work inside its idea of what a trade is. A platform's performance report is free and accurate on fills, and it is also blind to everything that makes a review useful: the plan, the reason and the rule check.
Many traders end up combining them. The platform report or an import supplies fills and P&L, and a short spreadsheet or journal note supplies the plan, tag and rule check for each trade.
How to Review a Single Trade
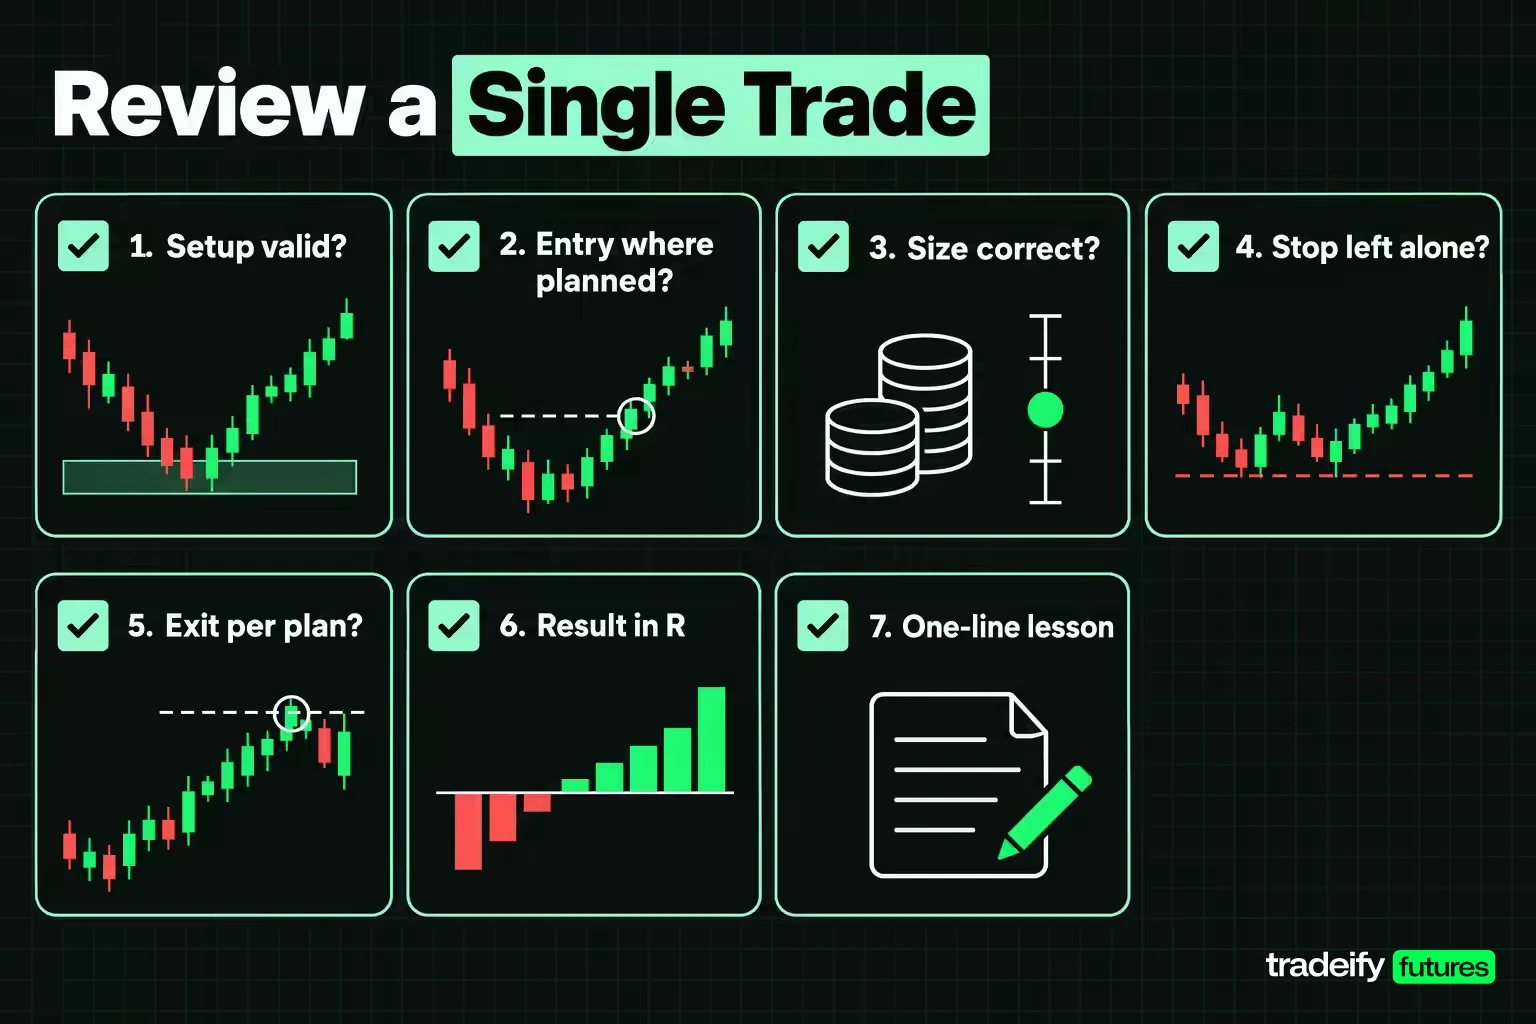
A single-trade review grades the decision, not the result. Run it the same way every time, ideally within an hour of the close while the context is still fresh.
- Was the setup valid? Check it against the written plan, not against how the trade turned out. A loss on a valid setup is a cost of doing business; a win on an invalid one is a warning.
- Was the entry where the plan said? Compare planned and actual entry. Chasing shows up here as a fill well past the planned price.
- Was size correct? Contracts traded versus the size your risk rule allowed for that stop distance.
- Was the stop placed and left alone? Note whether it moved and, if so, in which direction. A stop moved further away is a different trade with a bigger risk than the one you planned.
- Was the exit per plan? Target, stop, time exit, or a discretionary exit. If discretionary, write the reason in one line.
- What was the result in R? Record it, then deliberately set it aside for the grade.
- One-line lesson. The single decision that was hardest, or the one you would make differently with the same information.
Related lesson: The trading plan a single-trade review is graded against
The last step is the one that compounds. One honest line per trade, kept for a few months, becomes the evidence base the monthly and quarterly reviews draw on.
Scoring Process Separately From the Outcome
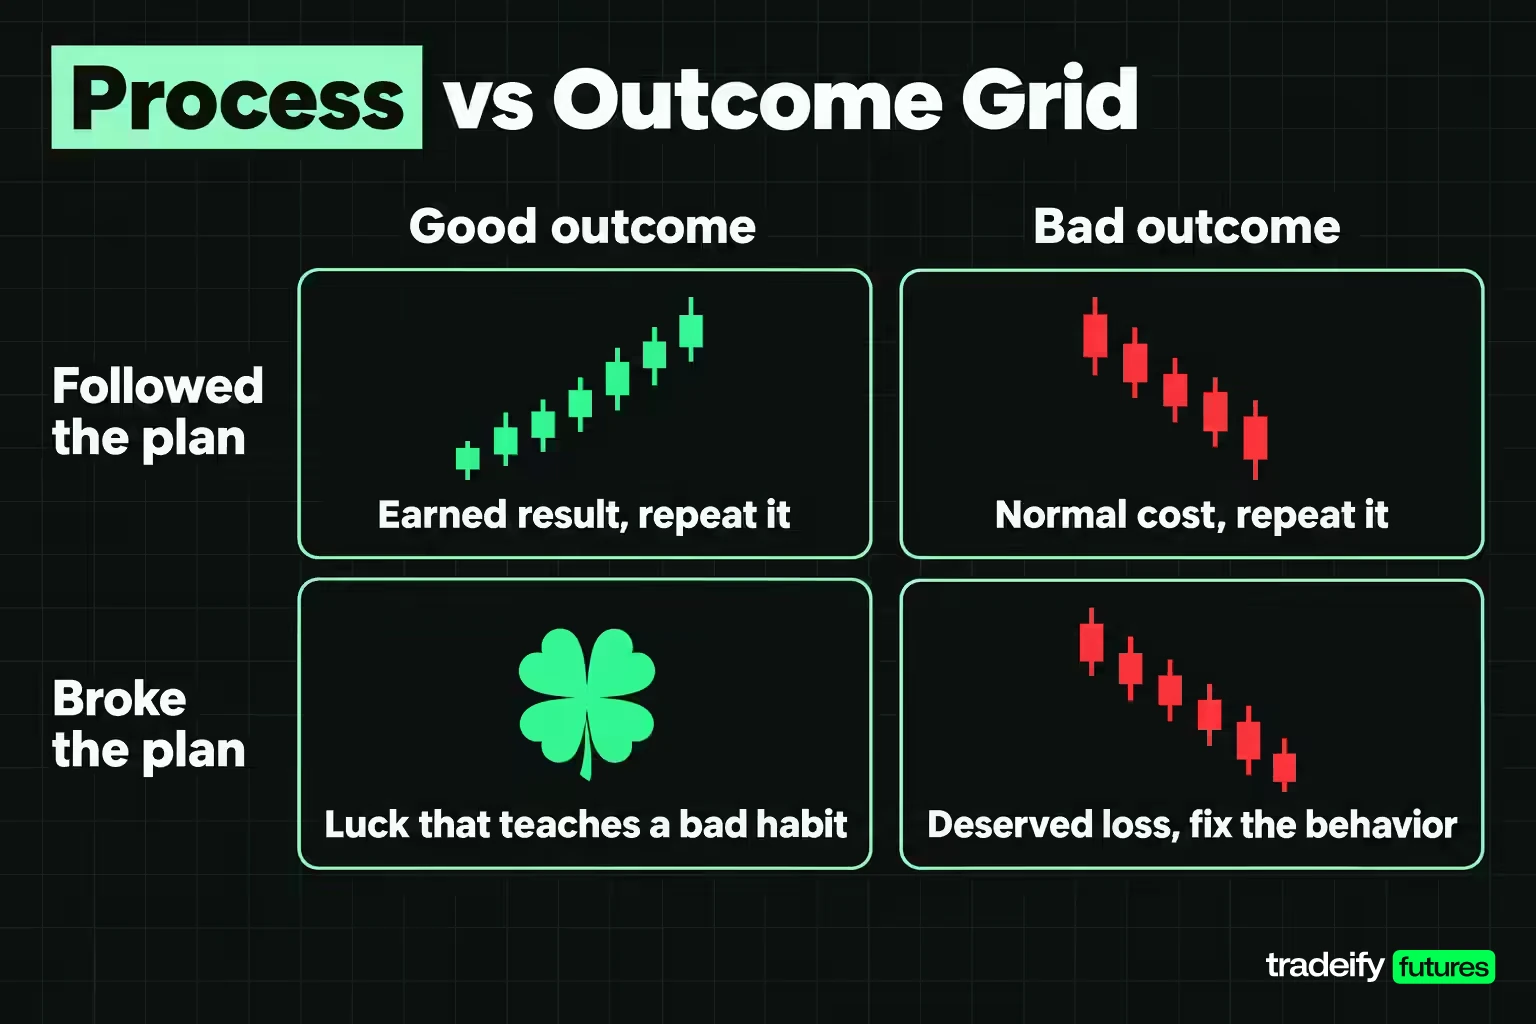
Process scoring rates how well you executed your plan, independent of profit or loss. It exists because outcomes are noisy and execution is not: you can follow every rule and lose, or break three rules and win.
The classic grid makes the point.
| Process | Good outcome | Bad outcome |
|---|---|---|
| Followed the plan | Earned result, repeat it | Normal cost of the edge, repeat it |
| Broke the plan | Luck that teaches a bad habit | Deserved loss, fix the behavior |
The top-right box is the one traders mishandle most. A clean loss feels like a mistake, so it gets "fixed", and the fix is usually a rule break dressed up as an adjustment. The bottom-left box is the dangerous one, because a rule break that pays reinforces itself.
A simple process score keeps the grid honest. Pick six checks from your plan, such as valid setup, planned entry, correct size, stop untouched, exit per plan and no trade after your daily stop. Score each one 0 (broken), 1 (partly) or 2 (followed), for a maximum of 12. A trade scoring 10 of 12 is 83% compliant whatever it made.
Track the average score per week, and count the zeros by check. Counts of your own actions are readable at very small samples, because they measure you rather than the market. A week with four moved stops is a clear finding at four trades. A week with four losing trades is not.
How Often to Review Your Trades
Every review cadence has a job, and only the longer ones can judge whether a strategy works. The numbers in the table come from this guide's own illustrative study: one stated 20-session breakout rule on 20 years of E-mini S&P 500 futures daily bars (592 trades, averaging 0.13R a trade), computed from Yahoo Finance price history. For each window size, rolling windows were compared with the full-sample result.
| Cadence | Trades in window at 3 a week | Window shows the wrong sign | Half-width of the 95% interval | What this review can judge |
|---|---|---|---|---|
| After each trade | 1 | Not meaningful | Not meaningful | Execution against the plan |
| Weekly | 3 | 61.5% | 1.61R | Process scores and rule breaks |
| Monthly | 12 | 43.2% | 0.81R | Totals, behavior trends, tag records |
| Quarterly | 36 | 32.0% | 0.46R | Large setting differences |
| Yearly | 144 | 20.7% | 0.23R | Ordinary setting changes |
Read the third column first. In this guide's E-mini study, a rule that earned a positive average over 20 years showed a zero or negative average in 43.2% of 12-trade windows. Almost half of your months, correctly recorded and correctly summed, can tell you a working rule is broken. That is not a reason to skip the monthly review. It is a reason to stop asking it a question it cannot answer.
The half-width column explains why. In the same study, at 12 trades the 95% interval stretches 0.81R either side of the window's average, six times the 0.13R the rule actually earned. The window is measuring which twelve trades landed in it, not the edge.
When each trade review should happen
The per-trade review is best done the same day, after the session, while the context is fresh. The weekly review works on a non-trading day, away from the platform, with the week closed. Monthly and quarterly reviews need a quiet block of time and the full log, because their job is aggregation, not reliving trades.
Timing also means not reviewing mid-session. Reviewing a losing morning at lunch is how a review turns into a revenge plan for the afternoon. Close the session first, then read it.
Trading Statistics Every Review Should Report
Trading statistics turn a list of trades into numbers a review can compare over time. Six cover almost every need.
- Win rate: winning trades divided by all trades.
- Average win and average loss in R: the payoff side of the equation.
- Expectancy: average result per trade, in R. Win rate times average win, minus loss rate times average loss.
- Profit factor: gross profit divided by gross loss.
- Maximum drawdown: the largest fall from a running equity high, in R.
- Trade count: printed next to every other number, because none of them mean much without it.
Here is a hypothetical example. Twenty trades: 8 winners at +2R and 12 losers at -1R. Win rate is 40%. Total is +16R minus 12R, or +4R. Expectancy is 0.4 x 2 minus 0.6 x 1, which is 0.20R a trade. Profit factor is 16 divided by 12, or 1.33. At $100 risked per trade that is $20 a trade and $400 over the twenty, before costs.
Related lesson: Trading expectancy as the per-trade number a review reports
Notice that a 40% win rate is perfectly healthy here. Win rate alone says almost nothing without the payoff. A review that leads with win rate quietly rewards cutting winners early, because taking profit at +0.5R lifts the win rate while it shrinks expectancy.
Average trades, not months, in a trading review
One arithmetic choice inside a review can flip its answer: averaging months versus averaging trades. In this guide's own 20-year E-mini breakout study (592 trades on Yahoo Finance daily bars), the simple average of 174 monthly averages was -0.17R. The trade-weighted average of the same trades was +0.13R. Same trades, opposite sign.
The cause is that quiet months count as much as busy ones when you average averages. In that E-mini study, the quietest quarter of months (1.28 trades on average) produced -0.84R per trade, while the busiest quarter (6.56 trades) produced +0.56R. A month with one stopped-out trade reads about -1R and counts as much as a month of eight trades.
The fix is one line. Report every window as total R divided by total trades, with the count printed beside it. Keep a monthly figure if you like, but label it a month average, not expectancy.
How Many Trades a Review Needs
A trade review can only judge an edge once the sample is large enough to separate it from noise. The figures here come from an illustrative study built so it can be rebuilt.
The data is front-month continuous E-mini S&P 500 futures daily bars, 5,067 sessions from 18 September 2006 to 4 November 2026. A signal is a close above the highest high of the prior 20 sessions. Entry is the next session's open, long. The stop is 1.0 times the 14-session average true range, the target 2.0 times it, and the trade exits at the 20th session's close if neither is hit. Costs are modeled at 0.5 index points per round turn. Overlapping trades are allowed and each counts once.
The rule produced 592 trades and 77.02R in total, 0.13R a trade at a 40.2% win rate, with a 95% interval of 0.01R to 0.24R. Exits were 345 stops, 203 targets, 40 time exits and 4 opens past the stop. This is a historical study of one rule, not a recommendation or a forecast.
The bar a setting change must clear
The useful output of this E-mini study is the bar a difference between two settings must clear before a review can read it. For two settings measured on the same kind of trades, that bar is roughly twice the half-width at the window's trade count.
| Trades in the review | Half-width per setting | Gap two settings must show |
|---|---|---|
| 12 | 0.81R | 1.61R |
| 36 | 0.46R | 0.93R |
| 144 | 0.23R | 0.46R |
| 592 | 0.11R | 0.23R |
At a 12-trade month, two settings must differ by 1.61R a trade before the gap is readable. That is larger than almost any real improvement a trader will find. At 144 trades the bar falls to 0.46R, the first count where an ordinary change becomes visible.
The study is honest about its own limit. At 592 trades the smallest edge this E-mini study can detect with 80% power is 0.16R, slightly more than the rule's own 0.13R. If twenty years of one rule barely resolves its own edge, your last thirty trades cannot resolve a small one.
Long-Run Review of the Equity Curve
A long-run review reads the equity curve over a quarter or a year and asks one thing: does the shape match what this strategy should produce? Its main job is defensive. It stops normal behavior from being diagnosed as a fault.
Three readings from this guide's own 20-year E-mini study (a 20-session breakout rule, 592 trades on Yahoo Finance daily bars) set expectations.
- Time below the high is normal. In the study, 91.2% of the 592 trades were taken while cumulative R sat below an earlier peak. The median stretch below a high lasted 10 trades, the 90th percentile 101 trades and the longest 256 trades, about 8.7 years at this rule's pace of roughly 29 trades a year.
- Most months lose, even with an edge. In the study, only 36.2% of months with at least one trade had a positive average. A rule with a 40.2% win rate and few trades per month produces mostly red months.
- One month does not forecast the next. In the study, across 135 back-to-back month pairs, the correlation between one month's average and the next was 0.01. After a positive month the next was positive 36.8% of the time; after a flat or losing month, 33.3%.
Related lesson: Maximum drawdown and how to read it in a review
So a long-run review should not ask "am I at a new high?" It should ask whether the current stretch below the high, measured in trades rather than weeks, sits inside what the strategy's own history or backtest says is normal. If it does, the review's answer is "keep going". If it is well past anything seen before, that is a real finding worth a hypothesis.
Finding Patterns Across Many Reviewed Trades
Pattern identification looks across many trades for recurring strengths and weaknesses. Done well, it finds behavior problems fast and market patterns slowly. Done badly, it finds a pattern every month.
Good grouping questions for a review:
- By setup tag: which setups carry the results, and which only feel good?
- By time of day or session: do results or rule breaks cluster at the open, after lunch, or late?
- By sequence: what happens on the trade after a loss, after two losses, after a big win?
- By context: trend days versus range days, release days versus quiet ones.
- By rule break: which check from the process score fails most often, and when?
Behavior patterns show up quickly because they are counts of your own actions. If five of your seven moved stops happened on the trade after a loss, that is a finding at seven events.
The tag trap in pattern reviews
Market patterns behave differently. Group trades into tags, compare the averages, and the best tag will look good even when no tag has any effect. By simple probability, with three tags of pure noise the best one reads positive about 87.5% of the time; with six tags, 98.4%. Adding trades does not fix that, because some tag always comes first.
What extra trades do shrink is how good the winner looks. Resampling the trades from this guide's own E-mini breakout study (592 trades) with the edge removed, the median best of three tags still read 0.35R at 12 trades per tag and 0.17R at 50 per tag, both larger than the real 0.13R edge. Treat a tag table as a list of hypotheses to test, not as evidence to act on.
A Worked Monthly Trade Review by Setup Tag
A monthly review is easiest to understand on a hypothetical month. Twelve trades, three setup tags of four trades each, winners at +2R and losers at -1R, with one time exit.
| Tag | Trades | Results in R | Total | Per trade |
|---|---|---|---|---|
| Tag A | 4 | +2, -1, +2, -1 | +2.0R | 0.50R |
| Tag B | 4 | +2, -1, -1, +1 | +1.0R | 0.25R |
| Tag C | 4 | +2, -1, -1, -1 | -1.0R | -0.25R |
| Whole month | 12 | 4 targets, 7 stops, 1 time exit | +2.0R | 0.17R |
The tag reading says trade more of A and drop C. Now apply the numbers. With three tags, the best looks positive about 87.5% of the time even when tags mean nothing. At four trades per tag the half-width is about 1.39R, so Tag A's 0.50R has an interval of roughly -0.89R to 1.89R. Tag A has not been separated from zero, let alone from Tag C.
The whole-month reading is the one to keep: +2.0R over 12 trades, 0.17R a trade, with a 12-trade half-width of 0.81R. The interval runs from about -0.64R to 0.97R. That month is consistent with a losing rule, a flat rule and a good one.
Two actions survive this monthly review, and both are about process.
- Keep tagging every trade, so the tag table can be rebuilt once each tag has enough trades to mean something.
- Read the process scores and rule-break counts for the month, which can support a behavior fix right now.
Reviewing Risk and Position Size
A risk review checks whether the losses were the size you planned and whether limits held. Keep it short and factual.
- Size versus plan: count trades where contracts exceeded what your risk rule allowed.
- Realized loss versus planned stop: any loss larger than 1R needs a reason (slippage, a gap, or a moved stop).
- Loss-limit hits: sessions that reached your daily limit, and what you did after.
- Drawdown: the current decline from the equity high, in R and in trades.
Related lesson: Position sizing rules a risk review checks
Add one expectation so a normal losing run is not mistaken for a broken strategy. In this guide's own E-mini breakout study, the rule lost 59.8% of its trades. Simulating that loss rate, a 12-trade window has an expected longest losing streak of about 3.84 trades and a 15.4% chance of six or more in a row. Over 36 trades, the chance of a run of six or more rises to 48.4%. Write those down before the streak arrives, and it reads as information, not a crisis.
Turning Review Lessons Into Trading Rules
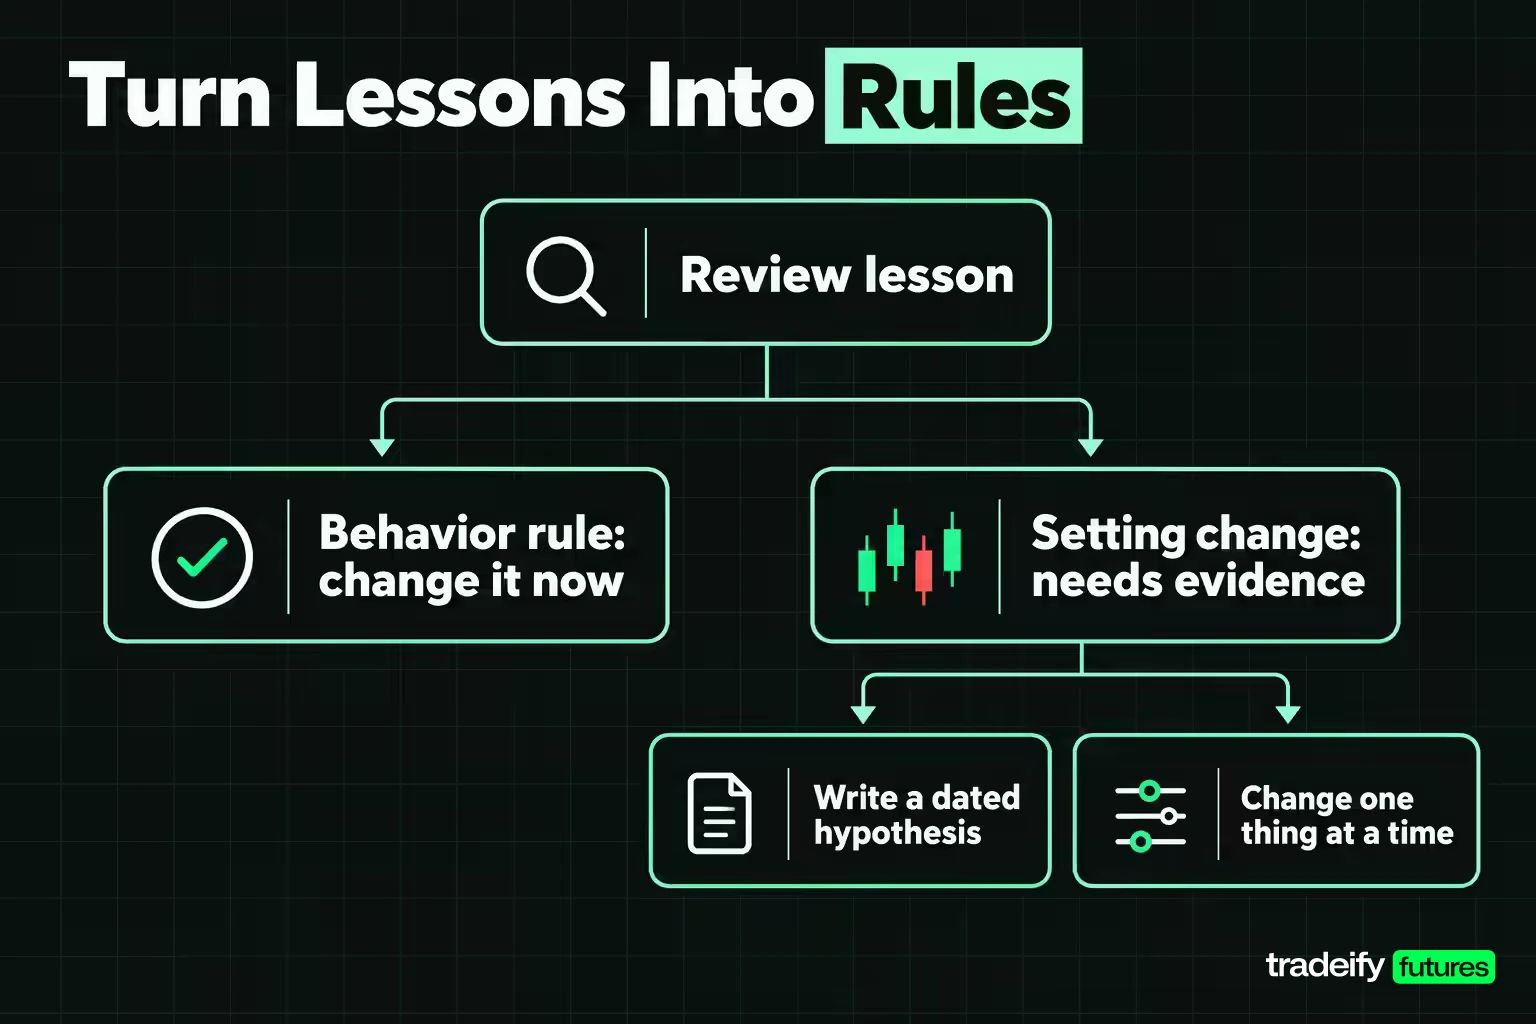
Turning review lessons into rules is where a trade review process pays off, and where it most often does damage. The rule of thumb is simple: behavior rules can change now, setting changes need evidence.
Behavior rules fix your actions, and they need no market data. "Stops are never moved further away." "After two consecutive losses, stop for the session." "No new trade within five minutes of a stopped-out trade." If the review shows the behavior, write the rule and enforce it from the next session.
Setting changes are claims about the market: a different stop multiple, a time filter, dropping a setup. These need a gap larger than the bar for your trade count. In this guide's own illustrative E-mini breakout study, that bar was about 1.61R a trade at 12 trades and about 0.46R at 144 trades.
A clean way to handle a change that has not cleared the bar:
- Write it as a dated hypothesis, with the exact rule and the trade count at which you will judge it.
- Change one thing at a time, so the next review can tell what caused what.
- Keep logging both versions where you can, for example by tagging trades the new rule would have skipped.
- Judge it only at the count you wrote down, not after a good or bad week.
Related lesson: Backtesting a rule change before trading it live
The failure mode to watch for is the after-the-fact rule. "I should not have traded that" is often true and rarely a rule. A rule has to be checkable before the trade, using only information you had at the time. If you can only apply it with hindsight, it belongs in the hypothesis log, not the plan.
Setting Goals From a Trade Review Process
Goals set from a trade review process work best when they target process, because process is in your control and readable at small counts. Outcome goals ("make 10R this month") push traders to force trades in a slow market.
Turn each review finding into a goal you can count:
- Moved stops last month? Goal: 20 sessions with zero moved stops.
- Process score sagging late in the session? Goal: average score of 10 of 12 or higher, with no trades after a set time.
- Missing trades out of hesitation? Goal: every valid setup taken or logged as skipped with a reason.
Set one or two goals per period, not five. The next review checks them first, before any P&L, and either keeps them, tightens them, or replaces them once they become habit.
Related lesson: Trading goals and process metrics
On our accounts, the data side of a review is already there. Tradovate's Performance report (under Reports) shows P&L, win rate and trade statistics for any date range, and WealthCharts' WealthTracker records every trade automatically with an equity curve, hold-time analysis and results by symbol, plus Chart Replay to revisit a session. Personal Risk Settings in Tradovate can enforce a daily loss goal, though they are your own limits and do not replace our account rules. Our funded accounts are simulated, so treat the review exactly as you would with real money.
Trade Review Questions Answered
What does trade review period mean?
In fantasy sports leagues, the trade review period is the window after a trade is accepted when other managers can look it over. The league manager sets how long it lasts, and a trade can be vetoed by the league or the commissioner during it. It is unrelated to reviewing your own market trades.
How do trades work in ESPN fantasy football?
One manager proposes a trade and the other accepts or declines it. Once accepted, the league is notified and the trade sits in its review period under the league's settings. A league manager can push it through early, and a veto can cancel it.
How do you approve a trade in Yahoo Fantasy?
It depends on the league's "Trades reviewed by" setting. In a Yahoo private league set to Commissioner review, the commissioner opens the trade notification and clicks Allow Trade or Veto Trade, and allowing it processes the trade at once. In leagues using league votes, a trade is vetoed if one-third of managers vote against it.
What is a trade report?
For a trader, a trade report is a broker or platform summary of executed trades over a period, showing fills, P&L and basic statistics. It is the raw input to a review, not the review itself. In market regulation, the term also means reporting a completed transaction to a regulator or the public tape.
What is required on a trade confirmation?
For stock trades, SEC Rule 10b-10 requires a broker-dealer to send written notice at or before completion showing the date and time, the security, the price and quantity, whether it acted as agent or principal, and its remuneration. For futures, CFTC Regulation 1.33 requires the futures commission merchant to send a written confirmation of each trade no later than the next business day.
What is the 7% rule in trading?
The 7% rule is a stock-investing guideline popularized by Investor's Business Daily: sell a stock if it falls 7% to 8% below your purchase price. It is a loss-cutting rule for share positions, not a regulation. Futures traders usually size the stop in R or ticks instead.
What is the 3 rule in trading?
It usually refers to the 3-5-7 rule, an informal guideline: risk at most 3% of the account on one trade, keep total open risk at 5% or less, and aim for winners at least 7% larger than losers. Versions differ on what the 7 means, and it is not an exchange or regulatory rule.
How often should you review your trades?
Review each trade briefly after the session, review process weekly and aggregate results monthly. Judge settings only quarterly or yearly, when the trade count is large enough to read a difference. In this guide's own 20-year E-mini breakout study, a 12-trade month showed the wrong sign 43.2% of the time.
How many trades do you need before changing a rule?
Behavior rules can change immediately. Setting changes need a gap between the old and new setting larger than the bar for your trade count. In this guide's own 20-year E-mini breakout study, that bar was about 1.61R a trade at 12 trades and 0.46R at 144. Until a change clears it, log it as a dated hypothesis.
Trading futures involves substantial risk, and leverage means losses can exceed what you expected or deposited. The study figures in this guide are historical and illustrative, not a forecast or a recommendation, and funded or evaluation accounts at prop firms are simulated. This article is educational and is not financial advice.


