



TL;DR: Overconfidence bias in trading is the gap between how good you think your decisions are and how good your record shows they are. Its most expensive form is sizing up after a winning streak. On 20 years of ES daily data, a 13-win run was one market move counted 13 times. Count each move once and the hot-hand edge flips negative, so fix risk per trade and change size only at a scheduled review.
Overconfidence bias in trading rarely feels like arrogance. It feels like evidence. You've taken nine winners in two weeks, the setups looked clean, and adding a contract seems like the obvious response to a process that is working.
That is exactly the moment the bias costs the most, because the decision looks rational and the evidence looks solid.
This guide treats that moment as the real subject. It defines the bias, walks through the research behind it, and then measures the most common version of it on 20 years of E-mini S&P 500 daily bars: what a winning streak is actually made of, and what sizing up inside one does to an account.
What Overconfidence Bias in Trading Means
Overconfidence bias in trading is the gap between how good you believe your decisions are and how good they measurably are. It is not a mood. It shows up as behaviour you can find in a trade log: size that grows after wins, stops that move because a setup "can't fail", and a short record read as proof of skill.
Psychologists Don Moore and Paul Healy, in a 2008 Psychological Review paper, separated three forms the research had been mixing together.
- Overestimation is thinking your performance is better than it is. In trading, it looks like assuming your win rate or average winner is higher than your journal says.
- Overplacement is thinking you are better than other people. It looks like skipping a rule "most traders need" because you believe you are the exception.
- Overprecision is being too sure your forecast is right. It looks like a target with no invalidation level, or a stop placed too tight because you are certain where price is going.
Moore and Healy found overprecision the most persistent of the three, and it is the one traders recognise least, because it feels like conviction rather than ego.
Overconfidence vs healthy trading confidence
Confidence is not the problem. You need it to take a valid setup after three losers. The difference is calibration.
A calibrated trader's belief matches the evidence and survives being checked. If the journal shows a win rate under half, they expect losing streaks and size for them before the streak arrives. An overconfident trader's belief needs the record to keep agreeing with it, so a good week raises size and a bad week gets explained away as bad luck.
A useful test: could you state what result would prove your current view wrong? If you can, it is confidence. If every outcome confirms it, it is the bias.
Related lesson: How emotions and biases shape decisions under pressure
Why Traders Become Overconfident
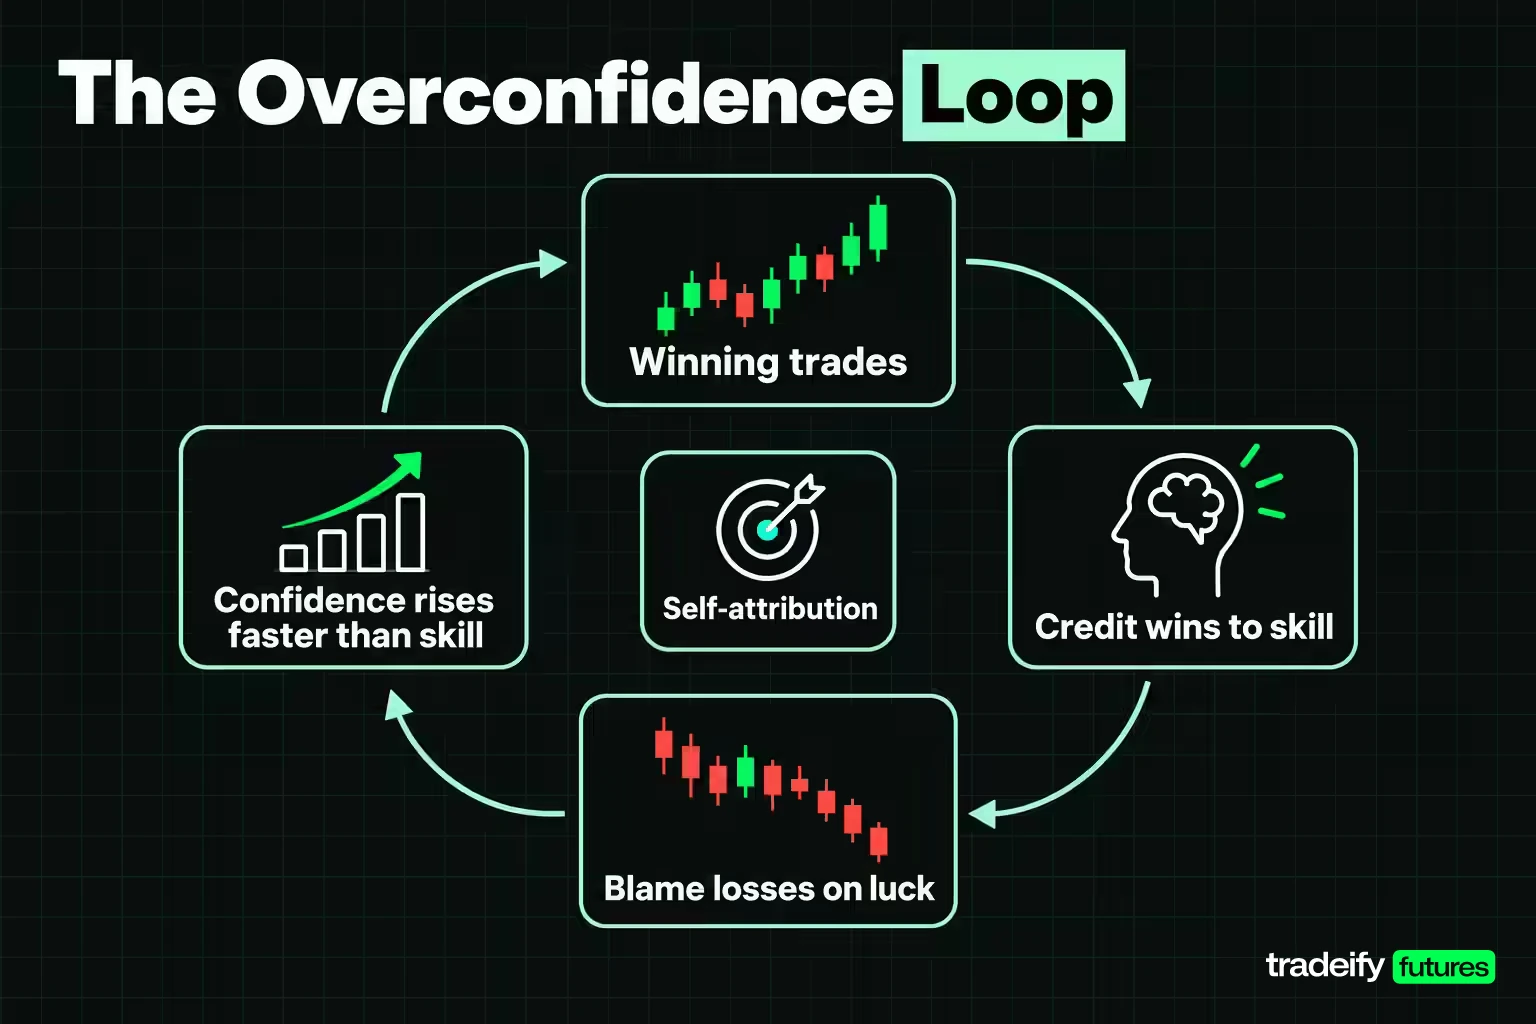
Overconfidence in trading is usually learned, not brought to the screen. The most cited model of how it forms comes from Simon Gervais and Terrance Odean's 2001 paper "Learning to Be Overconfident". In their model a trader does not know their own ability and infers it from wins and losses. The bias is small but systematic: the trader gives themselves too much credit for successes. Expected overconfidence rises over the first part of a career and only falls as experience piles up.
Several features of trading feed that process.
- Fast, noisy feedback. A trade closes in minutes and feels like a verdict on the decision. It is one draw from a wide distribution, and a single result says very little about the process behind it.
- Self-attribution. Winners get filed under skill and losers under bad luck, news or a stop hunt. Over a few months, the record in your head drifts away from the record in the platform.
- Illusion of control. Choosing the entry, watching the DOM and managing the exit all feel like influence over the outcome. They are influence over your risk, not over where price goes.
- Early wins. A strong first month, or a strong run after a break, sets the anchor that every later month is judged against.
- Overlapping trades. On a trending day or week, several entries ride the same move. Each one prints as a separate win, so one market event looks like several confirmations. This is the least discussed cause and the easiest to measure, which the winning streak study in this guide does.
None of these require ego. They are what happens when you learn from a noisy record with no method for correcting it, which describes most traders' first few years.
What Research Says About Overconfident Traders
The behavioural finance evidence on overconfidence comes mostly from stock investors, because brokerage account data is what researchers could get. It is still the clearest evidence of what the bias costs.
Brad Barber and Terrance Odean studied 66,465 households at a large discount broker from 1991 to 1996 ("Trading Is Hazardous to Your Wealth", Journal of Finance, 2000). The average household turned over 75% of its portfolio a year. The households that traded most earned 11.4% a year after costs, while the market returned 17.9% and the average household earned 16.4%. Gross performance was similar across groups; trading costs and the trades themselves made the difference. The authors' explanation was overconfidence.
In a follow-up, "Boys Will Be Boys" (Quarterly Journal of Economics, 2001), they used psychology research showing men tend to be more overconfident than women in finance and checked whether behaviour matched. Across more than 35,000 households from February 1991 to January 1997, men traded 45% more than women, and trading cut men's net returns by 2.65 percentage points a year against 1.72 for women.
What this research does and does not mean for futures traders
These studies measured stock portfolios, not intraday futures. The mechanism carries over, though: overconfidence shows up as more activity and more size, and both are paid for. A futures day trader pays the spread and commission on every round trip, and on a leveraged contract the size decision matters more than any single entry.
What the research does not show is that trading less is always better. It shows that confidence beyond the evidence raises activity without raising skill. The fix is to make your evidence honest, which is a measurement problem.
Signs of Overconfidence in Your Own Trading
Overconfidence is easier to spot in a trade log than in your head. These are the signs worth checking for, each with what it looks like in the data.
- Size creep after wins. Average contracts per trade rises in the days after a green week and falls after a red one. Plot position size against the previous week's P&L; a slope that should be flat isn't.
- More trades per session. The count climbs on days that follow big wins, often with setups that would not pass your checklist on a normal day.
- Stops that move. The exit order gets widened or cancelled because the trade "just needs room". Compare planned stop against actual exit on losing trades.
- Skipped preparation. Pre-market notes get shorter or disappear during a good stretch.
- Asymmetric explanations. Journal notes on winners describe the read; notes on losers describe the market, the news or bad luck.
- Trading outside your setups. New instruments, new times of day or counter-trend entries appear after a run, framed as "the market is giving".
- Ignoring the base rate. You expect the next trade to win because the last five did, not because of your long-run win rate.
One sign on its own is normal variation. Two or three together, clustered after a winning period, is the pattern. The uncomfortable part is that the clustering happens when you feel best about your trading, which is why the check has to be scheduled rather than triggered by a feeling.
How the Winning Streak Study Was Measured
The winning streak study in this guide is an illustrative measurement computed for this guide on Yahoo Finance's E-mini S&P 500 futures history, not a strategy recommendation. The rule is simple on purpose, so the streak effect is easy to see and anyone can rebuild it.
- Data. Front-month continuous E-mini S&P 500 (ES) daily bars, 5,032 completed sessions from 18 September 2006 to 16 September 2026. Nine dated rows with no price were dropped.
- Signal. A session closes above the highest high of the prior 20 sessions.
- Entry. Long at the next session's open.
- Stop and target. Stop 1.0 times the 14-session Average True Range (Wilder) measured on the signal bar; target 2.0 times that same range.
- Time cap. Exit at the close of the 20th session if neither level is hit.
- Fill assumptions. If stop and target fall inside the same bar, the stop counts first. A session that opens beyond a level fills at the open.
- Results are in R, so a full stop-out is -1R and a target hit is +2R.
The rule produced 590 signals with a 40.34% win rate and an average of 0.15R. Results exclude commissions, slippage and roll costs.
Related lesson: How to build and test a rule like this one
Why a Winning Streak Overstates Your Edge
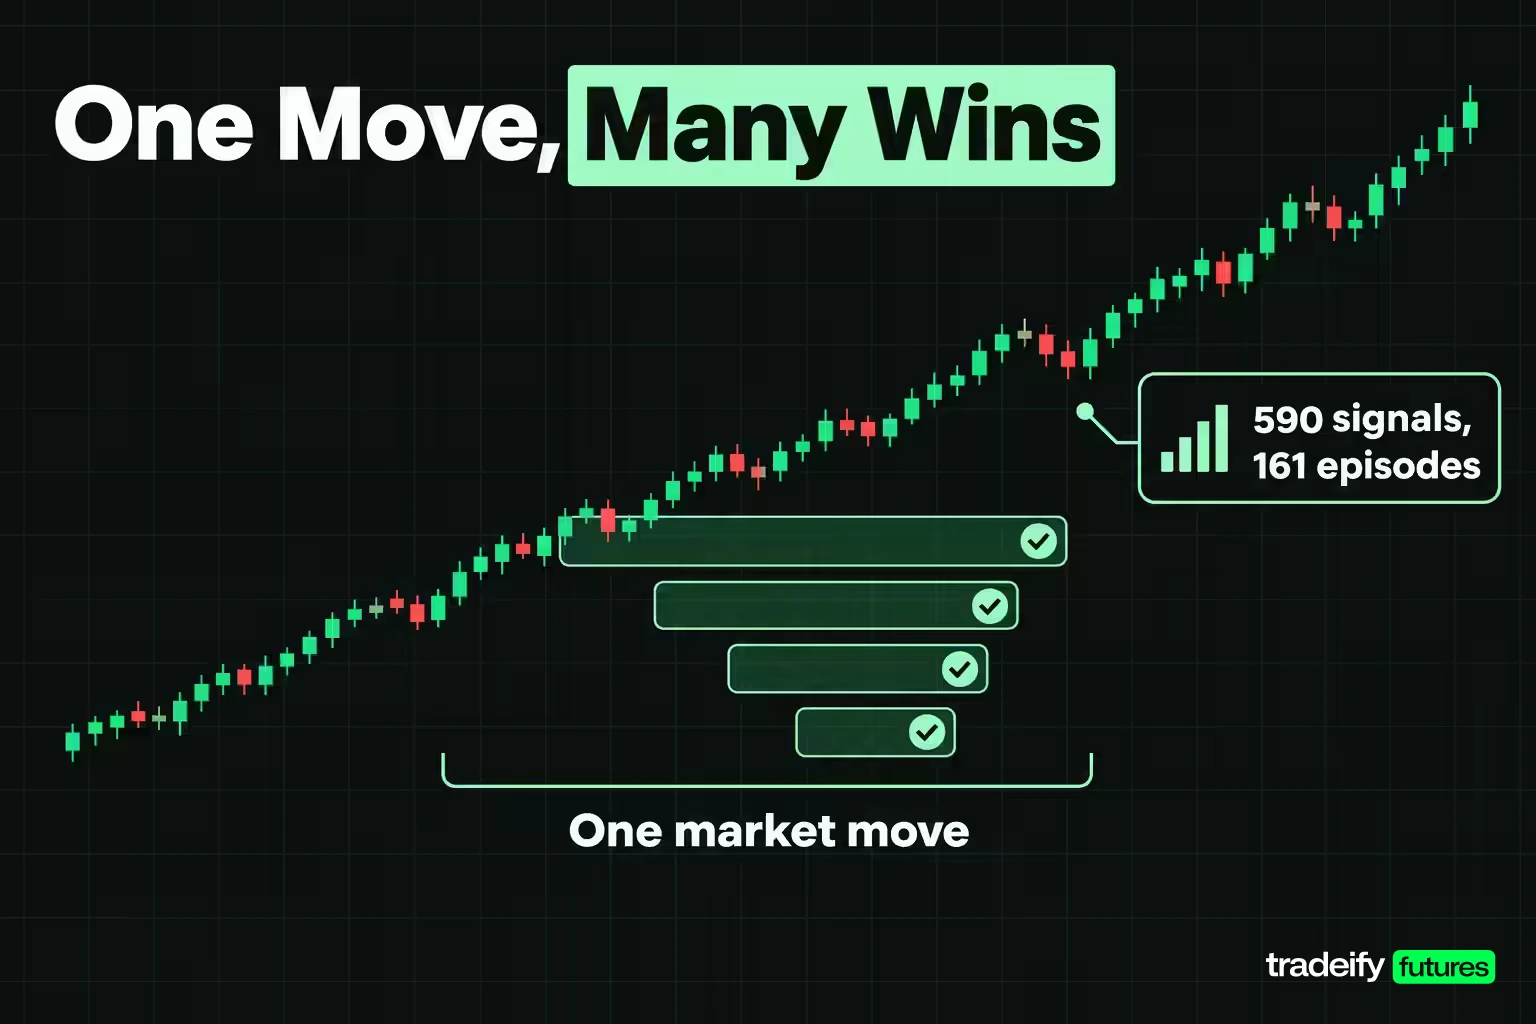
A winning streak feels like a series of independent confirmations. Nine wins should mean nine separate pieces of evidence. On most trend and breakout setups that isn't true, because the trades overlap in time.
This guide's own ES breakout study on Yahoo Finance daily data (590 signals from a 20-session high breakout with a 1 ATR stop and 2 ATR target, 2006 to 2026) shows how much. Merge every trade that entered while an earlier trade was still open into one market episode, and the 590 signals collapse into 161 episodes. That is 3.66 signals for every distinct market move. Of 589 consecutive signal pairs, 391 (66.38%) entered while the earlier trade was still running, and the median gap between signals was 3 sessions.
The hot hand that flips once each move counts once
Group the trades the way an overconfident trader reads a statement: by how many wins came right before.
| Grouping | Trades after 3+ wins | Average after 3+ wins | Other trades | Average otherwise |
|---|---|---|---|---|
| Every signal counted | 110 | 0.95R | 480 | -0.03R |
| One trade per market episode | 8 | -0.26R | 153 | 0.19R |
Counted naively, trades after three or more wins averaged 0.95R and everything else averaged -0.03R. That 0.98R gap is exactly what a hot hand looks like.
Keep only the first trade of each market episode, which is closer to what one account can actually trade without stacking the same move, and the result reverses. Eight trades followed three or more wins and averaged -0.26R, against 0.19R for the other 153. The gap is -0.46R.
The mechanism is not mysterious. When ES clears a 20-session high, it often keeps trending, so the next few sessions keep clearing it. Each of those signals is a fresh trade in the ledger and the same move in the market. A run of them is one good stretch, not nine verdicts on your process.
The 13-win run and the 15-loss run
The longest winning run in this guide's ES breakout study is 13 trades, entered between 10 April 2026 and 12 May 2026. Their signals spanned 22 sessions, all 13 sat inside a single market episode, and 4 of the other 12 entered while the first trade was still open. From first entry to last exit took 52 calendar days. It was one strong stretch, sliced 13 times.
That run is genuinely unusual. Shuffle the 590 win and loss outcomes 10,000 times at the same win rate, and the median longest winning run is 6, the 95th percentile is 9, and only 0.22% of shuffles reach 13.
The same shuffle on losses tells the other half. The longest losing run was 15 trades, against a shuffled median of 11 and a 95th percentile of 16, so 8.71% of random orderings did at least as badly. The process that built the 13 built the 15. The overconfident reading treats the first as skill and the second as bad luck, and only one of those readings changes size.
Sizing Up After Wins, the Costliest Overconfidence Habit
The behaviour overconfidence produces is a size change, so size is what needs measuring. The same 590 ES breakout signals (20-session high breakout, 1 ATR stop, 2 ATR target, 2006 to 2026) were run under three sizing policies. Signals, stops and exits stayed fixed; only risk per trade changed.
- Flat. $250 risk on every trade.
- Escalate after wins. Risk rises 1.5 times after each win, capped at 3 times, and resets to $250 after any loss. This is the overconfidence policy.
- Double after losses. Risk doubles after each loss, capped at 4 times, and resets after a win. This is the "win it back" policy.
| Sizing policy | Total result | Max drawdown | Average risk per trade |
|---|---|---|---|
| Flat $250 | $22,711 | $5,056 | $250 |
| Escalate after wins | $100,487 | $4,681 | $387 |
| Double after losses | -$63,678 | $64,928 | $631 |
On the full ledger, escalation finished 342% above flat with a smaller drawdown, a return-to-drawdown ratio of 21.5 against 4.5. Doubling after losses lost $63,678 with a drawdown 12.8 times deeper than flat.
Why escalating size after wins only looked better
The escalation looks brilliant until you ask where the wins came from. Reassign the same multipliers to random positions in the trade list over 2,000 shuffles and the median total is $35,071, with a 95th percentile of $46,985. The real order beat all 2,000, so the multipliers are landing on something real. That something is the overlap: escalation compounds size inside one trending stretch that the ledger counts several times.
Take one trade per market episode and escalation makes $6,267 against $6,915 flat, 0.91 times flat. Take one position at a time, skipping signals while a trade is open, and over 229 trades escalation makes $5,502 against $7,170 flat, 0.77 times flat, with a deeper drawdown ($4,625 against $4,250). Once the stacked trades are gone, sizing up after wins earned less and risked more.
The worst single escalated trade, entered 18 March 2010, lost 1.07R at the full 3 times multiplier, or $802. Nothing about that trade was different except how much was behind it.
Why leverage makes this worse in futures
In leveraged futures the size decision is coarse and fast. One E-mini S&P 500 contract moves $50 per index point. An illustrative 30-point stop costs 30 x $50 = $1,500 on one contract and $4,500 on three. Going from one contract to three after a good week triples the cost of the same stop, and on a prop account with a fixed drawdown, one oversized loss can end the account before the edge has a chance to show.
Related lesson: Setting size from risk, not from how the week felt
How Much a Winning Streak Can Prove
Before you change your process because of a run, size the evidence. The ES breakout study's trades have a standard deviation of about 1.38R per trade. With that spread, a basic two-group test at 80% power and 5% significance needs about 144 trades in each group to reliably detect a 0.46R difference.
The smallest gap you can reliably detect shrinks slowly as the record grows.
| Trades in each group | Smallest detectable gap |
|---|---|
| 25 | 1.09R |
| 50 | 0.77R |
| 100 | 0.55R |
| 200 | 0.39R |
So a trader with 40 trades after wins and 40 after losses who sees a 0.4R difference is looking at noise. And trades are not even the right unit when they overlap: the study's 590 signals held 161 distinct market episodes in 20 years, about 8 a year.
Measuring your own trading record honestly
Three numbers make a personal record harder to misread.
- Episode count. Merge overlapping trades and count the distinct market moves behind your results.
- Expectancy in R over at least 100 trades. Win rate alone hides payoff; R per trade combines both.
- Process adherence rate. The share of trades that matched your written setup. A rising P&L with falling adherence is luck you are about to pay back.
Related lesson: A review routine that keeps these numbers honest
How to Overcome Overconfidence Bias in Trading
Overcoming overconfidence bias in trading does not mean doubting every good week. It means making the record prove what it seems to prove before you act on it.
Run a Streak Audit before any size increase
- List your last 50 trades with entry time, exit time and result in R.
- Merge every trade that entered while an earlier one was still open into one episode, and count the episodes.
- Divide trades by episodes. A ratio near 1 means your trades are independent; a ratio near 3 or 4 means your streak is a few market moves counted several times.
- Recalculate average R using only the first trade of each episode.
- Compare your longest winning run with your longest losing run. If you are proud of one and blame luck for the other, note it.
If the episode-based numbers still support the change, make it at your next scheduled review. If they don't, leave size alone.
Fix size by rule, not by mood
Write one rule that does not depend on how the week felt: risk per trade is set in the plan and changes only at a scheduled review, such as every 50 trades or the end of a month. Never inside a streak, in either direction.
Use a pre-trade checklist
A short checklist (setup, location, stop, target, size) is a defence against overprecision. If a trade cannot pass it, conviction is not a substitute.
Journal before the outcome
Write the reason for the trade and the invalidation level before it closes. A note written after the result is shaped by the result.
Use platform risk tools to enforce your limits
Platform risk settings, daily loss lockouts and performance reports turn rules into hard limits. A daily loss limit you set on a calm morning is more reliable than a decision made after the third winner. Trade analytics that show win rate, average R and size by day of week make size creep visible before it gets expensive.
Related lesson: How to keep a journal that records the decision, not the story
Do's and Don'ts for Managing Overconfidence
These rules for managing overconfidence each exist to stop one specific failure.
| Do | Don't | Why it matters |
|---|---|---|
| Fix risk per trade in your plan | Add size inside a winning streak | Streaks often hold one market move counted several times |
| Change size only at a scheduled review | Change size the day after a big win or loss | Short samples are mostly noise |
| Count distinct market episodes | Count every overlapping trade as evidence | Overlap inflates your sample |
| Write invalidation before entry | Widen a stop because the setup feels strong | Overprecision hides in "it just needs room" |
| Journal winners and losers the same way | Credit wins to skill and losses to luck | Self-attribution is how the bias is learned |
| Set a daily loss lockout | Use the daily loss limit as your stop | A hard cap protects the account on the worst day |
| Review the losing streak as closely as the winning one | Treat the best run as your baseline | Both tails come from the same win rate |
The common thread is that every "don't" is a decision made with recent results in view, and every "do" is decided ahead of time.
Overconfidence and Related Trading Biases
Overconfidence rarely travels alone. Several related biases feed it or hide it, and naming which one is active points to a different fix.
| Bias | What it is | How it shows up in a trade |
|---|---|---|
| Illusion of control | Believing your actions influence an outcome you cannot control | Managing a trade tick by tick as if attention moves price |
| Self-attribution | Crediting wins to skill and losses to outside factors | Journal blames news for losers and praises the read on winners |
| Hot-hand thinking | Expecting a run to continue because it has been running | Adding size after three wins |
| Confirmation bias | Seeking evidence that supports your view | Reading every candle as proof your bias is right |
| Recency bias | Overweighting the latest results | Last week sets the expectation for this week |
| Anchoring | Fixing on a reference point | Holding for a target set before the market changed |
| Optimism bias | Expecting good outcomes more than the odds support | Assuming the next drawdown will be shallow |
Overconfidence is the umbrella: it is the conclusion these biases produce about your own ability. Fixing one of them, such as journaling losers as carefully as winners, weakens the whole chain.
Related lesson: The belief side of the same trap
Myths About Overconfidence in Trading
Several common beliefs about overconfidence make it harder to catch.
- "Experience cures it." Experience helps only when the record is honest. In the Gervais and Odean model, expected overconfidence rises during the early stretch of a career before experience pulls it back down. A trader with two good years can be at the peak, not past it.
- "Only beginners have it." Overprecision, being too sure of a forecast, is the most persistent form in the research, and it does not disappear with skill.
- "Confidence is the problem." Calibrated confidence is necessary to take valid trades after losses. The target is calibration, not doubt.
- "A profitable month proves the method." A month may hold only two or three distinct market moves. Profit tells you the moves were good, not that the process is.
- "The fix is to trade scared." Hesitating on valid setups is miscalibration in the other direction. It costs you the trades your edge depends on.
- "Sizing up after wins is just compounding." Compounding grows size with account equity on a schedule. Escalating after each win grows size with the streak, and streaks are where overlap inflates the evidence.
Risk Management Rules That Contain Overconfidence
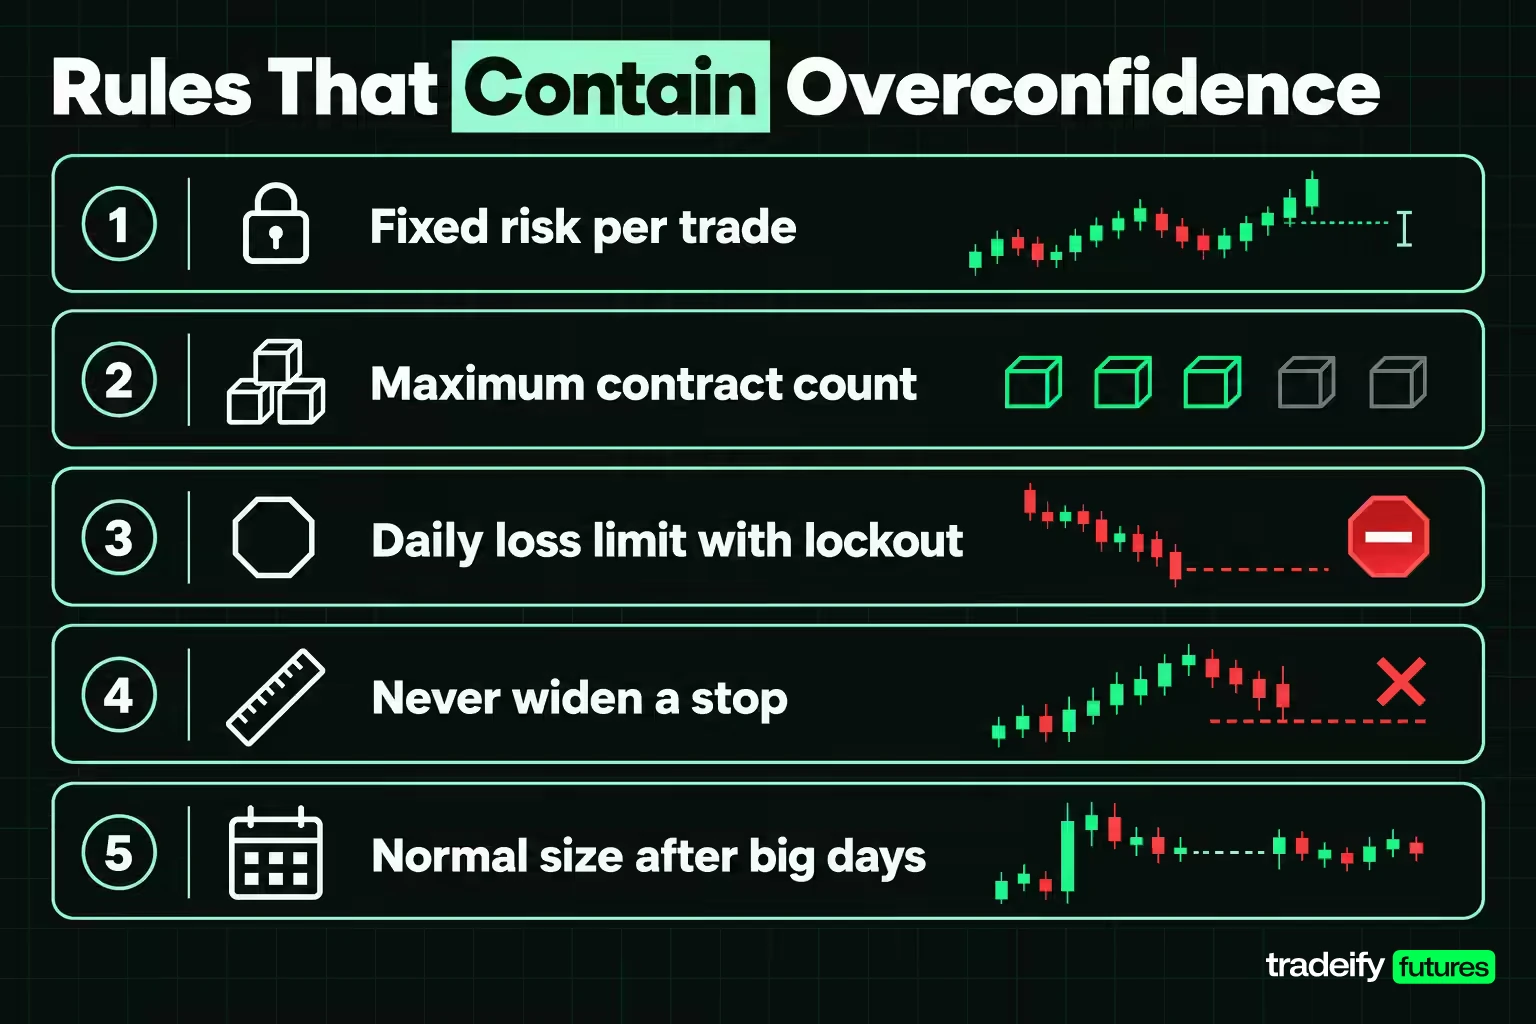
Overconfidence does most of its damage through size and through stops that stop being stops. Basic risk management rules cap that damage on the day the bias wins the argument.
- Fixed risk per trade. Pick a small, fixed fraction of the account, write it down and apply it to every trade, including the one after your best day.
- A maximum contract count. Set the most contracts you will ever trade on the instrument, and treat it as a ceiling, not a target.
- A daily loss limit with a lockout. Decide the dollar loss that ends your day, and stop there.
- A stop that is never widened. You may tighten a stop or exit early. You never give a losing trade more room than the plan allowed.
- A rule for after big days. After an unusually large win, the next session runs at normal size and normal trade count.
Overconfidence when moving from demo to live
The switch from a demo or simulated account to real money is a known overconfidence trap. A strong demo record feels like proof, but a few weeks of demo trading may hold only a handful of distinct market moves, and it was traded without the pressure that changes execution. Keep size at its minimum for the first stretch on a new account and let the record rebuild under the new conditions before scaling.
On our accounts, size is already capped by contract limits (a 50K account allows 4 minis or 40 micros), and our evaluation and funded accounts are simulated. If you trade through Tradovate, its personal Risk Settings let you set your own daily or weekly loss limit that closes positions and cancels orders until the next session, and Tradesea offers a personal lockout timer. These are your own limits and sit alongside our account rules rather than replacing them.
Related lesson: What an oversized loss does to the odds of blowing up
Overconfidence Bias in Trading FAQ
What is an example of overconfidence bias in trading?
The classic example is adding size after a winning streak because the streak feels like proof of skill. In this guide's illustrative 20-year ES breakout study on Yahoo Finance daily data, 590 signals held only 161 distinct market moves. Trades after three straight wins looked strong when every signal counted, but averaged -0.26R once each move counted once.
What are the three main types of overconfidence?
Research by Moore and Healy separates overestimation, overplacement and overprecision. Overestimation is thinking your performance is better than it is, and overplacement is thinking you are better than others. Overprecision is being too sure your forecast is right, and it is the most persistent of the three.
How do I know whether my winning streak is real?
Count distinct market episodes, not trades. Merge trades that overlapped in time and recalculate your average using one trade per episode. If the edge survives that and you have at least 100 independent trades, it is worth taking seriously.
Is overconfidence different from confidence?
Yes. Confidence is a belief that matches your record and survives being checked. Overconfidence needs the record to keep agreeing with it, so it raises size after wins and explains losses away.
Can overconfidence ever help a trader?
It can look helpful in a strong trend, because extra size lands on winning trades. In this guide's illustrative ES breakout study, escalating size after wins beat flat sizing only when overlapping trades were counted; taking one position at a time, it made 0.77 times as much as flat sizing.
What to Do About Overconfidence This Week
Pull your last 50 trades and mark the entry and exit time of each. Merge the overlapping ones and write the episode count at the top of the page. If the episode count is close to the trade count, your sample is real and a size change is a fair conversation for your next scheduled review. If it is a third or a quarter of the trade count, the streak you are reading is a few market moves, and the next step is the unexciting one: leave size alone, keep journaling, and run the audit again after the next 20 trades.
Futures trading uses leverage and can produce losses larger than expected, including losses beyond a planned stop when price gaps. The study in this guide uses historical daily bars and simulated rules, excludes commissions, slippage and roll costs, and does not predict future results. Evaluation and funded prop accounts are simulated. This guide is educational and is not financial advice.


