



TL;DR: Concentration risk is the share of your total risk sitting in one position or one group of positions that move together. Counting positions hides it, because two highly correlated trades behave like one bigger trade. In 20 years of futures data, ES and NQ at 1R each carried 1.96R of risk, while ES and gold carried 1.44R. Measure risk share, cap each correlated cluster, and size from the book total rather than the sum of your stops.
You are long ES, NQ is printing the same setup, and taking it feels like confirmation. Concentration risk is the question underneath that decision. Are you spreading risk across two trades, or putting the same bet on twice? The answer depends less on how many tickets you hold than on how much of your total risk ends up in one place.
This guide covers the standard definitions used by regulators and investors, then measures the trader's version on 20 years of daily data from five liquid futures markets. Every number comes with its method, so you can rebuild it on your own markets.
What Concentration Risk Means
Concentration risk is the risk of a large loss because too much of your exposure depends on one thing. FINRA's investor guidance describes it as "the risk of amplified losses that may occur from having a large portion of your holdings in a particular investment, asset class or market segment relative to your overall portfolio."
Banking rulebooks use a wider definition that transfers well to trading. The Qatar Financial Centre's banking rulebook defines a risk concentration as "a single exposure, or a group of exposures with a common element" capable of producing a loss large enough to threaten the firm or materially change its risk profile. The phrase that matters is "a group of exposures with a common element." Concentration does not need one giant position. Several positions driven by the same thing count too.
Concentration risk for a trader
A trader's version of concentration risk is narrower and more immediate. You have a fixed amount you are willing to lose on a bad day, and every open position is a claim on it. Concentration risk is the share of that claim one position, or one cluster of positions that move together, already holds.
Two numbers describe that share:
- Weight. How much of your planned risk you assigned to one position.
- Risk share. How much of the book's actual risk that position carries once correlation is counted.
Weight is visible on a position list. Risk share is not, and that gap is where traders get surprised.
Systematic and unsystematic risk
Investors often split risk into two types. Systematic risk hits nearly everything at once, such as a broad market selloff. Unsystematic risk belongs to one company, sector or market. Concentration risk is mostly unsystematic risk that you have chosen not to spread out. Diversification can reduce it, but no amount of diversification removes systematic risk.
Types of Concentration Risk
Concentration risk shows up in several forms, and the label tells you what common element is doing the damage. Banks, investors and traders use different names, but the logic is the same: one driver sits behind too much of the exposure.
| Type of concentration | What is concentrated | Example |
|---|---|---|
| Single name | One company, borrower or counterparty | Most of a portfolio in one stock |
| Sector or industry | One part of the economy | Several technology stocks plus a technology fund |
| Geographic | One country, state or region | Municipal bonds all from one state |
| Collateral | One type of pledged asset | Loans all secured by commercial property |
| Funding or deposits | One source of money | A bank funded mostly by uninsured deposits from one industry |
| Product | One product line or instrument type | A firm whose revenue depends on a single product |
| Market cluster | Markets that move together | Long ES and long NQ at the same time |
| Direction | Every position on the same side | Long every market ahead of the same data release |
| Event | Every position exposed to one scheduled release | Several positions open into a central bank announcement |
| Strategy | One method behind every trade | Five breakout trades that all fail in a choppy session |
The last four rows are the ones a short-term trader meets most often. A trader can hold five different symbols and still run a single market cluster, a single direction and a single event bet at once.
Funding concentration deserves a mention because it is easy to miss. Silicon Valley Bank's funding came largely from one client group, and the Federal Reserve's review found that about 94% of its deposits were uninsured at year-end 2022, against 41% for large banking organizations. Concentration on the funding side failed the bank faster than its asset losses did.
Related lesson: Correlation risk
Concentration in a Business
Concentration in a business means the company depends heavily on a small number of customers, suppliers, products or funding sources. If one large customer leaves, one supplier fails or one product falls out of favor, revenue or operations take a hit that a more spread-out business would absorb.
The common forms of business concentration risk are:
- Customer concentration. A few customers produce most of the revenue, which gives them pricing power and makes their departure dangerous.
- Supplier concentration. One supplier provides a critical input, so a disruption stops production.
- Revenue or product concentration. One product line carries the income statement.
- Funding concentration. One lender, investor group or depositor base supplies most of the money.
Silicon Valley Bank shows how a business concentration and a funding concentration can be the same thing. The Federal Reserve's review noted that venture capital-backed companies accounted for more than half of the bank's deposits at year-end 2022. When that client group came under pressure, its withdrawals were highly correlated.
A trader has a business-concentration problem too, even without customers. If one setup, one market or one session produces almost all of your profits, your trading business depends on that edge continuing. That is not automatically wrong. Specialization is how many traders get good. The risk is not knowing the dependence exists, so that a regime change in your one market arrives as a surprise rather than as a scenario you planned for.
Why Concentration Risk Is Dangerous
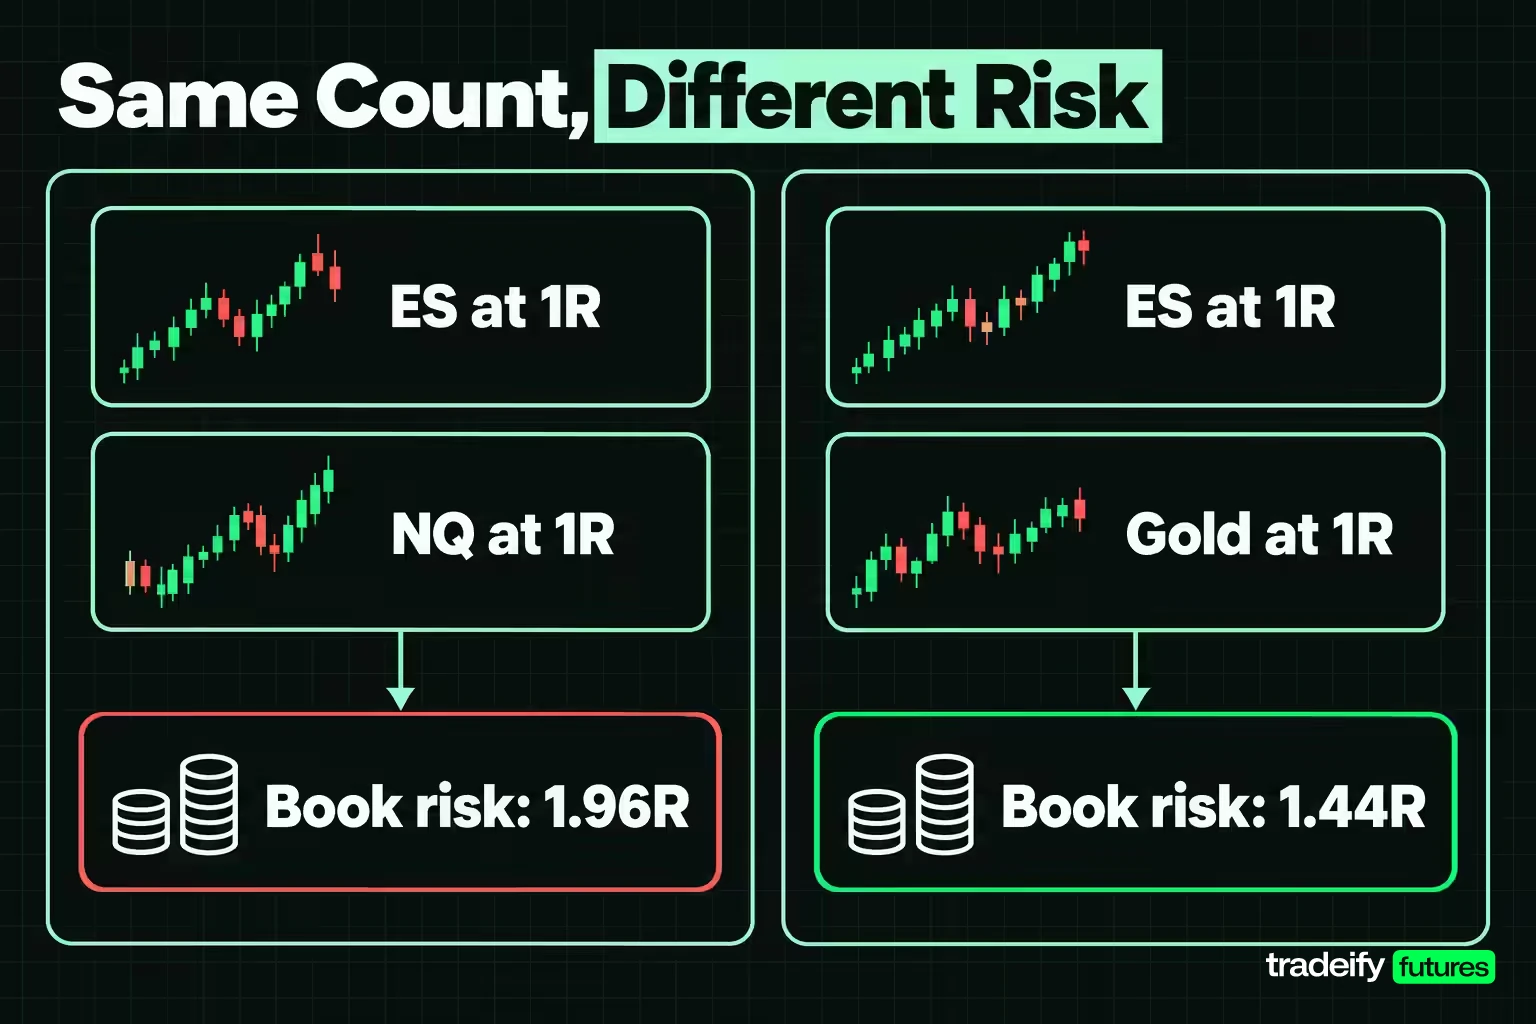
Concentration risk is dangerous because correlated positions lose together. A position list makes four trades look like four separate bets, but if they share a driver, they behave like one larger bet. The loss arrives all at once, usually on the day you can least afford it.
Correlated positions and hidden concentration
The arithmetic is short. Suppose every position is sized so a typical one-day move (one standard deviation) costs 1R. Then the typical one-day swing of the whole book is:
Book risk = square root of (number of positions + 2 × the sum of every pairwise correlation)
At zero correlation, two positions carry 1.41R, not 2R, because the swings partly cancel. At perfect correlation they carry the full 2R. Real markets sit in between, and the study in this guide measured where.
The study used daily closes for the E-mini S&P 500 (ES), E-mini Nasdaq-100 (NQ), gold, silver and copper futures (Yahoo Finance continuous front-month series) over the 5,027 sessions where all five traded, from November 6, 2006 to November 4, 2026. That gives 5,025 daily returns. Correlations are Pearson correlations of simple daily returns.
| Market pair | Correlation | Book risk at 1R each |
|---|---|---|
| ES and NQ | 0.92 | 1.96R |
| Gold and silver | 0.79 | 1.89R |
| Silver and copper | 0.44 | 1.70R |
| Gold and copper | 0.33 | 1.63R |
| ES and copper | 0.30 | 1.61R |
| NQ and copper | 0.26 | 1.59R |
| ES and silver | 0.16 | 1.52R |
| NQ and silver | 0.15 | 1.52R |
| ES and gold | 0.03 | 1.44R |
| NQ and gold | 0.03 | 1.44R |
ES and NQ at 1R each carry 1.96R. That is two tickets and almost exactly one doubled bet. ES and gold carry 1.44R, close to the 1.41R of a truly independent pair. Same number of positions, same risk per trade, very different book.
Here is where traders usually get caught. The second index trade does not feel like more risk, because it arrived as a separate signal with its own stop. The stop is separate. The driver is not.
How concentration risk grows with position count
The gap widens as you add positions. This table applies the same formula to books of 2 to 10 equal positions at three correlation levels: none, the 0.34 average across all ten pairs in the study, and the 0.92 ES and NQ reading.
| Positions at 1R each | Independent | At 0.34 average | At 0.92 like ES and NQ |
|---|---|---|---|
| 2 | 1.41R | 1.64R | 1.96R |
| 3 | 1.73R | 2.24R | 2.92R |
| 5 | 2.24R | 3.44R | 4.84R |
| 10 | 3.16R | 6.37R | 9.63R |
Ten positions at 1R each are 10R on paper. Spread across independent markets they swing like 3.16R. Stacked in markets that move like ES and NQ they swing like 9.63R, which is 3.05 times as much. The position count is identical in both books.
Concentration risk in the tail
Correlation also changes when markets fall hard, and not in a helpful way. In this guide's study of Yahoo Finance daily futures closes from 2006 to 2026, on the 251 worst ES sessions (its worst 5%), the average correlation across all ten pairs dropped to 0.28, which looks like better diversification. The pair readings tell the real story. ES and NQ held at 0.85, gold and silver rose to 0.82, and ES against gold moved to -0.07. The average fell only because the unrelated pairs drifted further apart, while the clusters that were already tight stayed tight.
So a trader who sees "average correlation fell in the selloff" and relaxes is reading the wrong number. Concentration risk lives in the clusters, not in the average.
Related lesson: Maximum drawdown
How to Measure Concentration
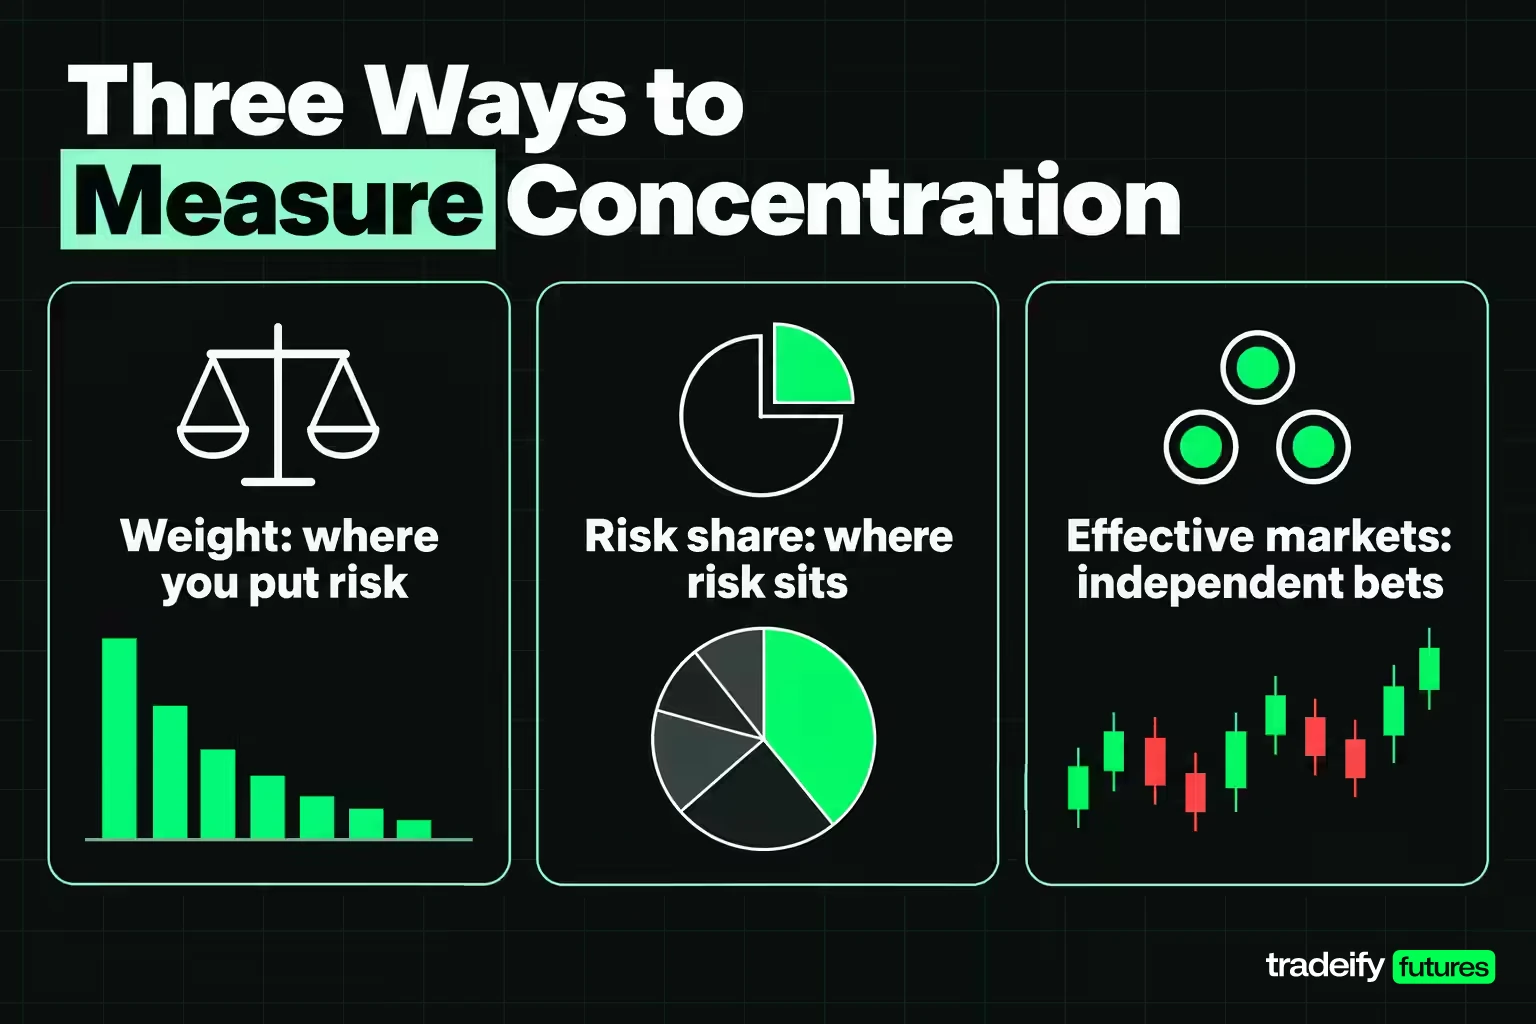
Concentration can be measured three ways, and each answers a different question. Weight tells you where you put the risk. Risk share tells you where the risk actually sits. The effective number of markets tells you how many independent bets the book really holds.
The Herfindahl-Hirschman Index
The Herfindahl-Hirschman Index (HHI) is the standard concentration score. The US Department of Justice defines it as the sum of the squared market shares of every firm in a market. Four firms with 30, 30, 20 and 20 percent shares give an HHI of 2,600. One firm with everything gives the maximum of 10,000. Antitrust agencies treat 1,000 to 1,800 as moderately concentrated and anything above 1,800 as highly concentrated.
You can run the same calculation on a trading book. Square each position's share of planned risk, add them up and multiply by 10,000. Five equal positions score 2,000. By the merger yardstick that already reads as highly concentrated, which shows the thresholds were built for markets with many firms, not for a five-position book. Use HHI to compare your own books over time, not against antitrust cut-offs.
Weight versus risk share
The more useful version runs HHI on risk shares instead of weights. A position's risk share is its contribution to the book's total swing once correlations are counted. This table holds the five study markets in one book, puts a growing weight on ES and splits the rest equally across NQ, gold, silver and copper.
| ES share of planned risk | ES share of actual risk | ES and NQ together | HHI on weights | HHI on risk | Effective markets |
|---|---|---|---|---|---|
| 20% | 20.4% | 40.4% | 2,000 | 2,000 | 4.99 |
| 40% | 48.0% | 65.2% | 2,500 | 3,010 | 3.32 |
| 60% | 73.0% | 84.4% | 4,000 | 5,540 | 1.80 |
| 75% | 86.6% | 93.3% | 5,780 | 7,560 | 1.32 |
At equal weights, each position carries about its weight. Push ES to 40% of the planned risk and it carries 48.0% of the actual risk, because NQ, its near twin, adds to it. At 75% of the weight, ES and NQ together carry 93.3% of the book's risk. Nothing on the position list changed except the sizes.
That is the core idea in the title. The question is not how many positions you hold. It is how much of the risk one cluster owns.
Effective number of independent markets
A second concentration measure counts how many independent bets a book behaves like. One common version divides the number of markets squared by the sum of every squared correlation in the matrix. Using this guide's 20-year correlations from Yahoo Finance daily closes, a book of ES, NQ, gold, silver and copper behaves like 2.79 independent markets, not five.
Concentration Risk Case Studies
Concentration risk case studies tend to follow the same pattern: a position that looked reasonable on its own became dangerous because nothing else in the book could absorb its loss. These four examples cover employees, a hedge fund, a bank and a single futures session.
Enron and company stock concentration
Enron's 401(k) plan is the textbook employer-stock case. A Congressional Research Service report found that as of December 31, 2000, 62% of the plan's assets were Enron stock, and the company estimated employees had bought 89% of that stock themselves. Shares that traded above $80 in January 2001 were worth under 70 cents a year later. Employees lost their jobs and much of their retirement savings to the same event, which is concentration across income and assets at once.
Amaranth and single-market concentration
Amaranth Advisors shows the trading version. A 2007 Senate Permanent Subcommittee on Investigations staff report found that the fund's natural gas positions lost over $2 billion from the last week of August to mid-September 2006, which led to the liquidation of the entire $8 billion fund. One market cluster was large enough to end a multi-strategy fund.
Silicon Valley Bank and funding concentration
Silicon Valley Bank failed on the funding side. The Federal Reserve's review found that about 94% of its deposits were uninsured at year-end 2022 and that its client base was concentrated in venture capital-backed and technology firms. On March 9, 2023, the bank lost over $40 billion in deposits and expected over $100 billion more the next day. It was closed on March 10. Correlated customers became correlated withdrawals.
Metals concentration on January 30, 2026
A futures example comes from this guide's own measurement of Yahoo Finance daily closes for ES, NQ, gold, silver and copper from 2006 to 2026. On January 30, 2026, silver fell 31.35%, gold 10.78% and copper 4.51%, while NQ fell 1.27% and ES only 0.39%. Silver's move was 14.3 of its own daily standard deviations. An equal-capital book of all five markets lost 9.66% that session, its worst day in 20 years. A trader watching the index futures saw a quiet tape while three metals positions did the damage.
The thread running through all four cases is a common element nobody priced in. Employees did not see income and savings as one bet. A metals trader holding gold, silver and copper may not see three positions as one cluster until a session like that one.
Concentration Stress Tests and Exposure Limits
Stress testing asks a blunt question: what would this book have lost on the worst days you can name? It is the companion to correlation, because correlation describes average days and stress tests describe the days that end accounts.
The simplest stress test replays historical sessions against your current book. This table does it for four books, each with every position long and sized at 1R per one-day standard deviation, using three of the hardest sessions in the sample.
| Session | Five-market book | ES and NQ | Gold and silver | ES and gold |
|---|---|---|---|---|
| October 15, 2008 | -23.3R | -15.1R | -3.7R | -8.0R |
| March 16, 2020 | -24.8R | -16.1R | -7.0R | -10.1R |
| January 30, 2026 | -27.5R | -1.2R | -23.7R | -9.6R |
Three things stand out. First, the index pair and the metals pair each blew up on a different day, so a stress test built only on equity crashes would have missed the 2026 metals session entirely. Second, the five-market book never escaped, because it held both clusters. Third, these are close-to-close moves with no stop, so they show exposure, not the loss a trader using stops would actually book. Gaps and fast markets can still push a fill past a stop.
How often concentration breaks a loss plan
A softer stress test counts ordinary bad days. In this guide's study of 5,025 daily returns from Yahoo Finance futures closes (2006 to 2026), with each position sized at 1R per one-day standard deviation, the ES and NQ pair lost more than its planned 2R on 513 sessions (10.21%). The gold and silver pair did so on 504 (10.03%). The ES and gold pair lost more than 2R on 298 sessions (5.93%), as did the five-market book against its 5R plan. The worst 1% of sessions cost the ES and NQ pair 5.63R and the ES and gold pair 4.10R.
The correlated pairs breached their plan almost twice as often as the diversified pair, with the same risk per position and the same number of positions. If your bad days feel worse than your plan says they should, check the clusters before you blame the stops.
Turning stress tests into concentration limits
Exposure limits convert the stress test into rules you set before the session:
- Cluster cap. Treat each correlated cluster (equity indices, precious metals) as one position for sizing, and cap the cluster's combined risk.
- Largest-position cap. Cap any single position's share of book risk, not just its share of capital, for example a maximum risk share you choose in advance.
- Scenario cap. Require that the book's loss on your chosen historical scenarios stays inside your daily loss limit.
- Event cap. Cut the cluster cap ahead of scheduled releases that hit every position at once.
Correlations also move. The rolling one-year average across the ten pairs ranged from 0.16 (year ending February 20, 2020) to 0.59 (year ending October 26, 2012), and read 0.52 for the year ending October 30, 2026. Re-run the numbers on a schedule rather than trusting a figure from a calm year.
Related lesson: Value at risk
Regulatory Limits on Concentration
Regulatory concentration rules apply to banks and their supervisors, not to individual traders, but they show how professionals set hard limits. Each one ties concentration to capital, which is the same move a trader makes by tying it to an account's loss limit.
| Rule or guidance | Applies to | Threshold or requirement |
|---|---|---|
| OCC Comptroller's Handbook, Concentrations of Credit | US national banks and federal savings associations | A concentration is obligations exceeding 25 percent of tier 1 capital plus the allowance for credit losses |
| Basel Framework large exposures (LEX20) | Internationally active banks | Exposure to one counterparty or connected group capped at 25% of Tier 1 capital |
| Basel large exposures for G-SIBs | Global systemically important banks | 15% cap on exposure to another G-SIB |
| Basel large exposure reporting | Internationally active banks | Report every exposure at or above 10% of Tier 1 capital |
| FINRA investor guidance | Individual investors | No numeric limit; diversify, rebalance and check fund overlap |
How the OCC defines a concentration
The OCC's Comptroller's Handbook booklet "Concentrations of Credit" (Version 3.0, September 2026) defines a concentration as the sum of direct, indirect or contingent obligations exceeding 25 percent of a bank's tier 1 capital plus the allowance for credit losses. The definition counts indirect and contingent obligations, so a bank cannot hide a concentration by spreading it across legal forms.
What traders can borrow from bank rules
The useful idea is the denominator. Banks measure each exposure against the capital that would absorb the loss. A trader's equivalent is the daily loss limit or drawdown room, not the account balance. A position worth a small slice of the balance can still be a large slice of today's allowed loss. The Basel reporting threshold also maps cleanly: write down every position or cluster above a set share of your loss limit before the session starts.
Managing Concentration Risk in a Trading Book
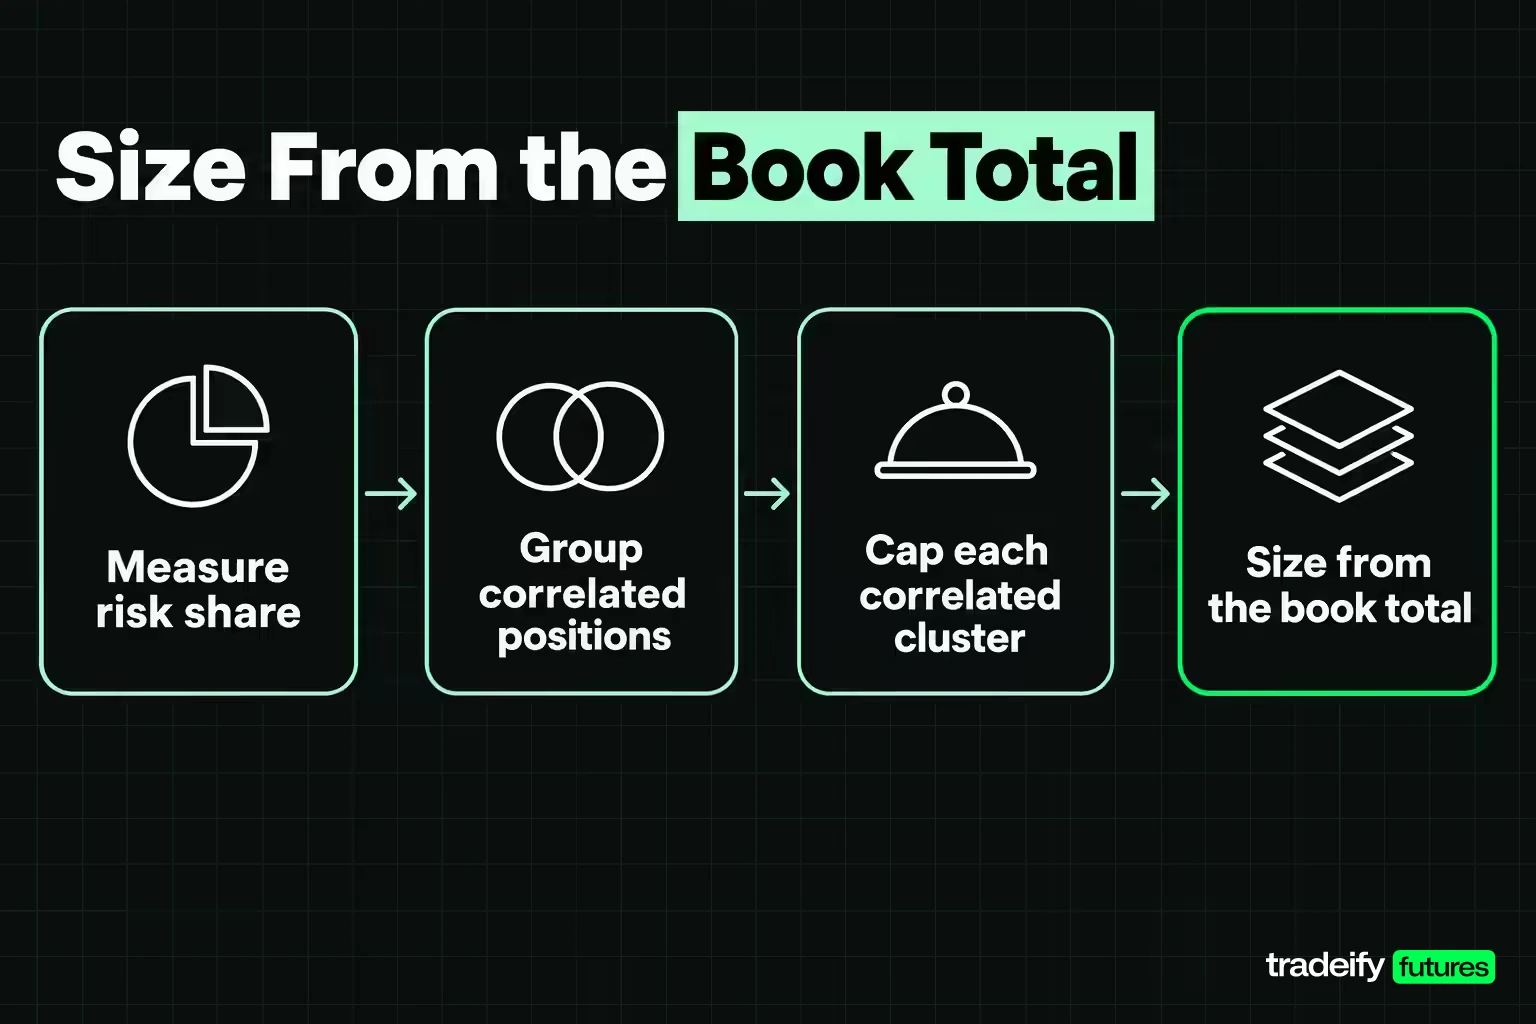
Managing concentration risk comes down to sizing from the book's total, not from the sum of each position's stop. This worked example and method show how.
A $50,000 concentration risk example
Take an illustrative $50,000 account that risks 0.5% per position, or $250 for each position's 1R. The table applies the study's correlations to four candidate books.
| Book | Planned risk (sum) | Book risk after correlation | Book risk as % of account | Above an independent book |
|---|---|---|---|---|
| ES and NQ | $500 | $490 | 0.98% | 38.6% |
| Gold and silver | $500 | $473 | 0.95% | 33.8% |
| ES and gold | $500 | $359 | 0.72% | 1.5% |
| All five markets | $1,250 | $860 | 1.72% | 53.8% |
The ES and NQ book carries $490 of typical daily swing on a $500 plan, almost the full sum. The same plan put into ES and gold carries $359. On paper the two books are identical. In practice the index pair carries $131 more risk at the same moment.
The five-market book looks safer than its $1,250 sum, at $860. But an independent five-market book would carry $559, so this one still carries 53.8% more than its position count suggests. If you want that five-market book to swing like $500, each position has to drop to about $145, or 0.29% of the account.
Steps to set a concentration limit
- List the markets you will actually hold together, not every market on your watchlist.
- Group them by measured correlation, not by asset class. In the study, metals split into a tight gold and silver pair and a looser copper link.
- Compute book risk with the square-root formula for the set you hold.
- Divide your total risk target by that figure to get the per-position size. If the answer feels too small to trade, the book is too large.
- Cap the largest cluster's share of book risk and check it against your daily loss limit.
- Recompute after a regime shift. In the February 20 to April 30, 2020 window, the average correlation rose to 0.42, ES and NQ reached 0.97, and the five-market book's swing grew to 3.66R on unchanged sizes.
What to do when a concentrated position goes bad
When a concentrated position goes against you, the first decision is whether the reason you entered still holds, not how to get back to breakeven. Adding to a losing position deepens the concentration. The usual sequence is to cut the correlated legs first, keep the stop where your plan put it, and resize the rest from the book total. For a long-term investor the answer is similar: decide on a target weight, then reduce toward it on a schedule instead of waiting for a rebound.
Related lesson: Position sizing
Diversification That Actually Reduces Risk
Diversification reduces concentration only when the new position has a different driver. Adding a near twin increases activity, commissions and screen time while adding almost no independent risk.
The effective number of independent markets shows this clearly. This table starts from ES alone and adds one market at a time, using this guide's 20-year correlations measured on Yahoo Finance daily futures closes.
| Book | Effective independent markets | Gain from the last market added |
|---|---|---|
| ES | 1.00 | Not applicable |
| ES and NQ | 1.08 | 0.08 |
| ES, NQ and gold | 1.92 | 0.83 |
| ES, NQ, gold and copper | 2.57 | 0.65 |
| All five markets | 2.79 | 0.22 |
In that measurement the second index added 0.08 of a market. Gold added 0.83. Silver, added last, contributed 0.22 because gold already covered most of what it brings. A five-market book delivered fewer than three independent bets.
Diversification strategies that work
- Diversify by driver. Equity indices respond to growth and rates, metals to the dollar, real yields and industrial demand, so pairing them spreads risk better than adding another index.
- Diversify by time. Not every position needs to be open through the same release.
- Diversify by strategy. A trend trade and a mean-reversion trade in one market can fail on different days.
- Check the relationship every quarter. ES against gold ranged from -0.33 to 0.43 on a rolling one-year basis, so last year's diversifier can become this year's twin.
Reducing concentration gradually
Gradual diversification means reducing a concentration in stages instead of all at once. Investors do this with a large stock position by selling a fixed slice on a schedule. Traders do it by shrinking the dominant cluster over several sessions while adding unrelated exposure. The benefit is avoiding a single badly timed exit. The cost is staying concentrated longer.
Related lesson: Diversification
Managing Stock Concentration and Company Stock
Concentrated stock positions are the most common form of concentration risk for individual investors. They usually come from employer stock, equity compensation, an inheritance or a single holding that grew much faster than the rest of the portfolio.
FINRA lists the usual causes: intentional bets, concentration that builds because one holding performed well, company stock in retirement plans, correlated assets and illiquid investments. The second cause catches people most often. A position can become concentrated without a single purchase, simply by going up.
Managing company stock and equity compensation
Employer stock adds a second layer, because your salary already depends on the same company. Enron's employees learned this when their jobs and their 401(k) plan, which held 62% of its assets in Enron stock, failed together.
Common ways to manage a concentrated stock position:
- Set a target weight and reduce toward it on a calendar, so the decision is made once.
- Sell new grants or vested shares first rather than letting them accumulate.
- Use scheduled selling plans where insider rules apply, so sales happen on a pre-set schedule.
- Rebalance after big moves instead of waiting for a target price.
- Look through funds for overlap, since an index fund may hold the same stock again.
Tax implications of selling a concentrated position
Taxes are often why investors hold a concentration longer than they should. In the US, the IRS treats assets held more than one year as long-term, and long-term gains are taxed at 0%, 15% or 20% depending on income, while short-term gains are taxed as ordinary income. Net capital losses can offset only $3,000 of other income a year, with the rest carried forward.
Employer stock inside a retirement plan has its own rule. According to the IRS, net unrealized appreciation (NUA) in employer securities taken as part of a lump-sum distribution is generally not taxed until those securities are sold. That can change the order in which a concentrated plan position is unwound.
Futures traders face a different situation. Regulated futures contracts fall under section 1256 of the tax code, which marks open contracts to market at year end and treats gains and losses as 60% long-term and 40% short-term. With no unrealized gain deferred into the next year, futures traders rarely have a tax reason to stay concentrated. Tax rules change and depend on your situation, so treat this as background and talk to a tax professional before acting.
Advanced Concentration Reduction Strategies
Advanced concentration reduction strategies are used when selling outright is expensive, restricted or undesirable. Most belong to wealth management or bank balance sheets rather than day trading, but knowing them explains how professionals think about the problem.
| Strategy | How it works | Main tradeoff |
|---|---|---|
| Protective put | Buy a put option on the concentrated stock | Pays a premium to set a floor |
| Collar | Buy a put and sell a call on the same stock | Gives up upside above the call strike |
| Exchange fund | Contribute shares to a pooled partnership for a share of a diversified pool | Long lockup and limited control |
| Prepaid variable forward | Receive cash now against a future delivery of shares | Complex contract and cost |
| Charitable transfer | Donate appreciated shares | Gives the value away |
| Credit risk transfer | A lender sells or insures part of a large loan exposure | Pays away part of the income |
| Loan syndication | Several lenders share one large loan | Smaller share of the deal |
Credit risk transfer and syndication are how banks stay under limits like the Basel 25% cap. Rather than turning away a large borrower, a bank shares the exposure with other lenders or buys protection on it.
The trading equivalent is simpler: reduce size. Offsetting a correlated position with another futures position, such as shorting NQ against a long ES, is a hedge with its own basis risk, because the two markets do not move one for one. Closing or shrinking a leg is the cleanest way to cut a cluster.
Related lesson: Hedging risk
Concentration Under a Daily Loss Limit
A daily loss limit does not care how many positions you hold. It sees one number: what the account lost today. That makes concentration risk concrete on any account with a hard loss rule, because correlated positions hit the limit together.
This guide's own study of Yahoo Finance daily closes for ES, NQ, gold, silver and copper (5,025 daily returns, November 2006 to November 2026) shows how often that happens. On 46 of those sessions (0.92%), all five markets fell at least one standard deviation together, and an equal-capital book of all five lost 3.42% on average those days. A per-position plan that assumes losses arrive one at a time will understate what the account sees on exactly those sessions.
Trailing drawdown rules make the problem sharper. A correlated loss uses up room that a winning session later has to rebuild, and a single cluster can consume most of the room in one move.
Contract limits and hedging rules
On our accounts, contract limits apply to the whole book rather than per market: a 50K account allows 4 minis or 40 micros in total, and a full-size or E-mini contract in any product counts as one mini. Our hedging rule prohibits opposing positions in the same Product Group, so a long ES cannot be offset with a short NQ, since both sit in the Equity Index group. The 50K Growth evaluation also has a $1,250 daily loss limit, and positions are closed by 4:45 PM ET each day. Funded accounts are simulated. In practice, the way to cut a correlated cluster on our accounts is to close or shrink a leg.
Related lesson: Daily and weekly loss limits
Concentration Risk FAQ
What is concentration risk in simple terms?
Concentration risk is having too much of your risk tied to one thing, whether that is one stock, one sector or a group of markets that move together. In trading it usually means correlated positions. ES and NQ, for example, correlated at 0.92 over 20 years of daily data, so holding both is close to one doubled position.
What are the two types of risk in investing?
The two types are systematic risk, which affects the whole market, and unsystematic risk, which is specific to one company, sector or market. Diversification can reduce unsystematic risk but cannot remove systematic risk. Concentration risk is mostly unsystematic risk that has not been spread out.
What does concentration mean in business?
In business, concentration means depending on a small number of customers, suppliers, products or funding sources. Losing one of them can hit revenue or operations hard. Silicon Valley Bank's reliance on venture capital-backed depositors is a well-documented example.
How does the OCC define a concentration?
The OCC's Comptroller's Handbook defines a concentration as the sum of direct, indirect or contingent obligations exceeding 25 percent of a bank's tier 1 capital plus the allowance for credit losses. It applies to banks the OCC supervises.
What should you do when an investment goes bad?
Start by checking whether the original reason for the investment still holds. If it does not, reduce or exit according to your plan rather than averaging down. If the position has become too large a share of your total risk, cut it back to a target size first.
Is concentration risk the same as leverage?
No. Leverage is the size of your exposure relative to your capital, while concentration risk is how much of that exposure sits in one correlated cluster. A modestly leveraged book can still be highly concentrated if every position shares the same driver.
Can a portfolio be too diversified?
A portfolio can hold positions that add cost and attention without adding independent risk. In this guide's 20-year measurement of Yahoo Finance futures closes, silver added only 0.22 of an independent bet to a book already holding ES, NQ, gold and copper. Diversification by driver beats diversification by count.
This article is for education only and is not investment, tax or legal advice. Futures trade with leverage, and losses can exceed what you expect, especially when correlated positions move together. The figures here are historical measurements on continuous front-month daily data and do not predict future results. Funded and evaluation accounts are simulated, and their rules differ from live brokerage accounts.


