



TL;DR: Doji candlestick patterns mark a bar where open and close nearly match, which records indecision, not direction. Dragonfly dojis reject lower prices, gravestones reject higher prices, and long-legged dojis stall. A strict screen is a body of 5% of range or less on a bar at least 0.75 times the 14-bar ATR. On ES daily bars, 9 of 14 strict dojis closed back inside their range the next day. Waiting for a confirmation close on an illustrative MES short cut the payoff from 2.17R to 1.64R.
A doji is the candle people point to when they want to say the market could not decide. That is accurate, and it is also where most doji mistakes begin. A bar that records indecision has not said what happens next.
Doji candlestick patterns are useful for a narrower job than most guides suggest. A doji tells you where price was rejected inside one period. Next to a level you already marked, and followed by a bar that resolves it, that can time an entry. On its own in the middle of a range, it is noise.
What a Doji Candlestick Is and How It Forms
A doji candlestick is a bar whose open and close are equal or very close to equal, so the body shrinks to a thin line and the shadows do the talking. The word comes from Japanese (どうじ, 同事), usually translated as "same matter", which fits a bar that ended where it started.
Candlestick patterns in trading are shapes built from each bar's open, high, low and close, read alone or in short sequences. The method was first used in Japanese rice markets in the 1600s and reached Western traders through English-language books in the early 1990s.
A doji forms in three steps inside a single period:
- Price opens at a level.
- Buyers, sellers or both push it away from that open, which draws the shadows.
- By the close, price has come back to roughly where it opened.
The doji's information is the distance price travelled and gave back. A 1-minute doji records a few seconds of back and forth. A daily doji records a full session in which one side pushed hard and still could not hold the ground.
That is why a doji is a relationship between body and range, not a description of a small bar. A tiny bar with a tiny body is not the same signal, and a body to range test with a minimum bar size separates the two.
Doji Candlestick Patterns by Type
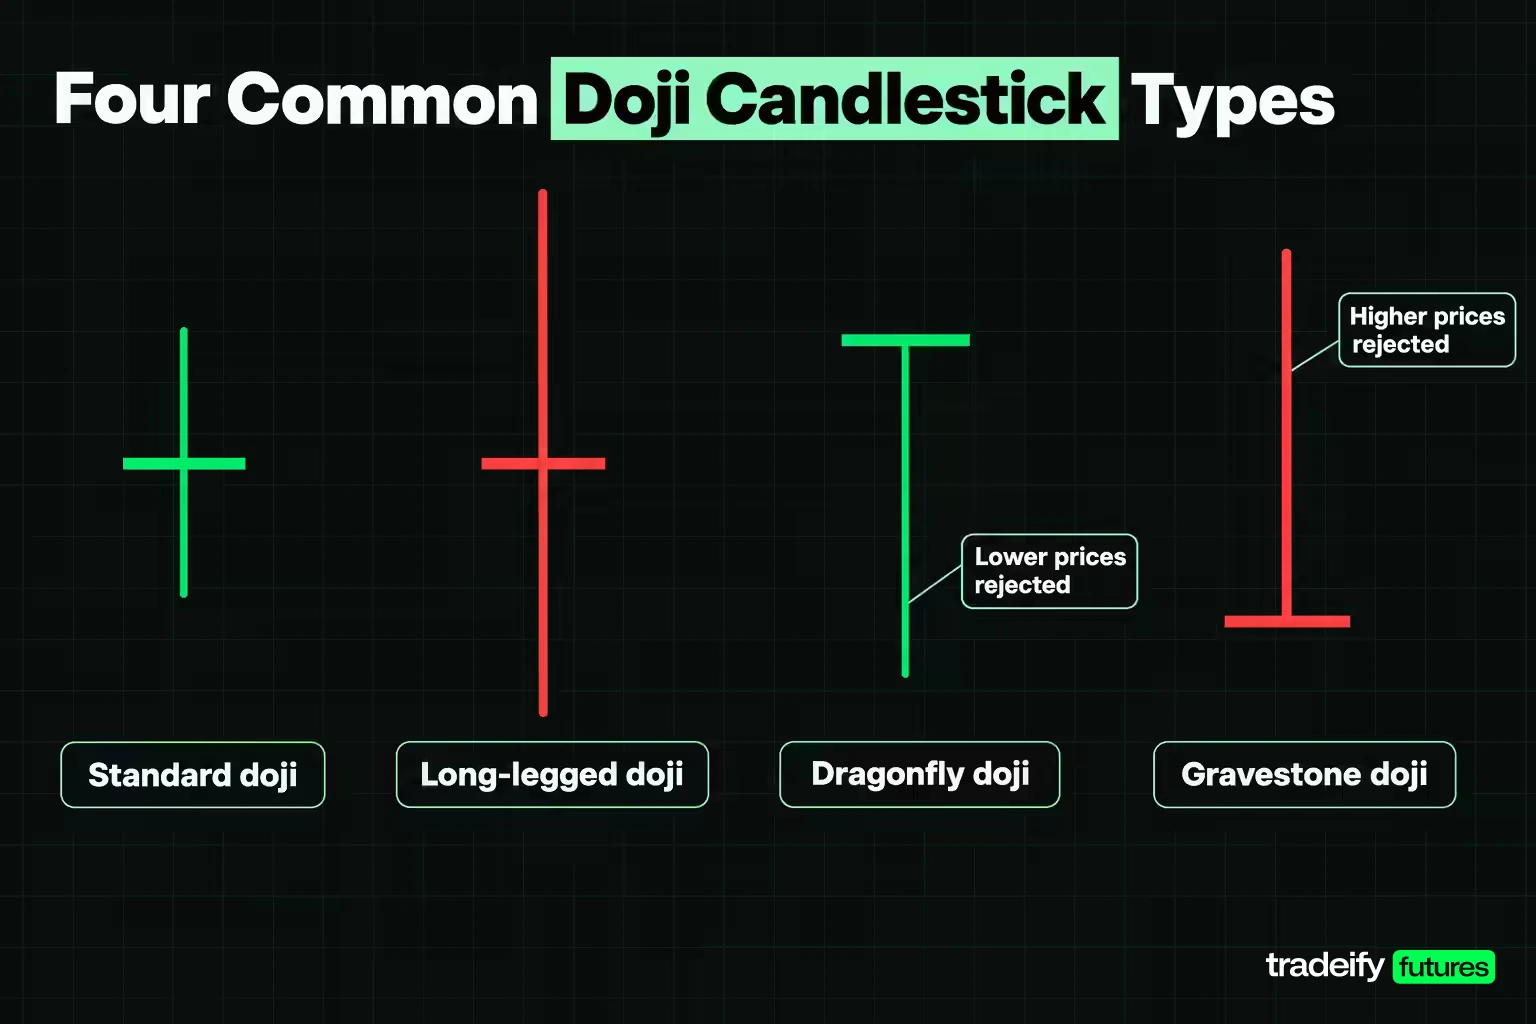
Doji candlestick patterns differ by where the open and close sit inside the bar's range, because that position shows which side was rejected.
- Standard doji. Open and close near the middle, shadows of similar length. Both sides moved price and neither kept it. It is the least specific type and depends most on location.
- Long-legged doji. Open and close near the middle with unusually long shadows on both sides. A wide range produced no progress, which reads as a stall after real effort.
- Dragonfly doji. Open and close at or near the high, with a long lower shadow and little or no upper shadow. Sellers drove price down and buyers took all of it back. Academic pattern sets class it as a bullish single-bar pattern.
- Gravestone doji. Open and close at or near the low, with a long upper shadow. Buyers pushed price up and gave it all back. It is classed as the bearish single-bar counterpart.
- Four-price doji. Open, high, low and close are the same price, so the bar prints as a flat dash. It usually means almost nothing traded, as on a thin or halted market, and it is not a signal.
The doji star and a doji type comparison
The doji star is a sequence rather than a single bar. In a morning doji star, a long bearish candle is followed by a doji that gaps lower, and a third bullish candle closes well into the first candle's body. The evening doji star is the mirror image at the top of an advance. The doji in the middle is the pause, and the third candle is the confirmation.
Related lesson: Morning star and evening star patterns
| Doji type | Where open and close sit | Shadows | What was rejected | Where it carries weight |
|---|---|---|---|---|
| Standard doji | Middle of the range | Similar length | Neither side kept control | At a tested level only |
| Long-legged doji | Middle of the range | Long on both sides | Both directions, with a wide range | After an extended move |
| Dragonfly doji | At or near the high | Long lower shadow | Lower prices | At support after a decline |
| Gravestone doji | At or near the low | Long upper shadow | Higher prices | At resistance after an advance |
| Four-price doji | One price for all four | None | Nothing, little traded | Nowhere, ignore it |
How to Identify a Doji With a Body to Range Test
The most common doji error is calling every small-bodied bar a doji. Eyeballing fails because a body that looks thin on a zoomed-out chart can be a real share of the range. Two screens fix it.
- Body to range ratio. Divide the absolute distance between open and close by the high to low range. A strict screen is 5% or less, a looser one 10% or less. These are working conventions, not published standards, so test them on your own instrument.
- Minimum range. Multiply the 14-bar average true range (ATR) by 0.75 and treat that as a floor. A bar below the floor is not traded on its shape, whatever its ratio says.
The second screen is the one people skip. A quiet bar can print a body and range that pass any ratio test simply because almost nobody traded. The ratio checks the arithmetic, and the range checks whether anyone showed up.
Three Micro E-mini S&P 500 bars run through the doji screens
The Micro E-mini S&P 500 (MES) pays $5 per index point, with a minimum tick of 0.25 points worth $1.25. In this illustrative example, the 14-bar ATR is 14.00 points, so the range floor is 10.50 points. All prices are illustrative, not a market record.
| Bar | Open | High | Low | Close | Range | Body | Body share of range | Clears 10.50-point floor | Verdict |
|---|---|---|---|---|---|---|---|---|---|
| Long-legged doji | 7,008.25 | 7,016.75 | 7,000.00 | 7,008.50 | 16.75 points | 0.25 points | 1.49% | Yes | A real doji |
| Small-bodied bar | 7,008.25 | 7,016.75 | 7,000.00 | 7,012.00 | 16.75 points | 3.75 points | 22.39% | Yes | Not a doji at either threshold |
| Tiny inside bar | 7,008.25 | 7,009.00 | 7,007.50 | 7,008.00 | 1.50 points | 0.25 points | 16.67% | No | Too small to read |
The first two bars share a high, a low and an open. The only difference is the close, and the second bar's body is 15 times larger, which puts one side clearly ahead at the bell. The third bar has the same 0.25-point body as the doji and still fails, because a 1.50-point range says almost nothing happened.
Related lesson: Average true range ATR
What a Doji Says About Market Sentiment
A doji's sentiment reading is balance. For one period, buyers and sellers moved price and neither side kept the gain on the number that gets recorded at the close.
What makes that worth noticing is contrast. A doji after five strong up bars says the side that had been winning stopped winning for a period. A doji inside a sideways range says the market is doing exactly what it has been doing.
Three readings are worth keeping apart:
- Indecision. Neither side is in control right now. This is what the doji actually measures.
- Exhaustion. The winning side ran out of new participants. This is an interpretation, and it needs a prior move to exist.
- Reversal. The other side takes over. This is a forecast, and the doji alone cannot make it.
The temptation is to jump straight from the first reading to the third, because a long-legged doji at the high of a big move looks dramatic. It feels like a top, and sometimes it is. More often it is a breather before the trend carries on, which is why a doji's sentiment reading only becomes a trade signal after the next bar closes beyond its high or low.
When a Doji Is Bullish and When It Is Bearish
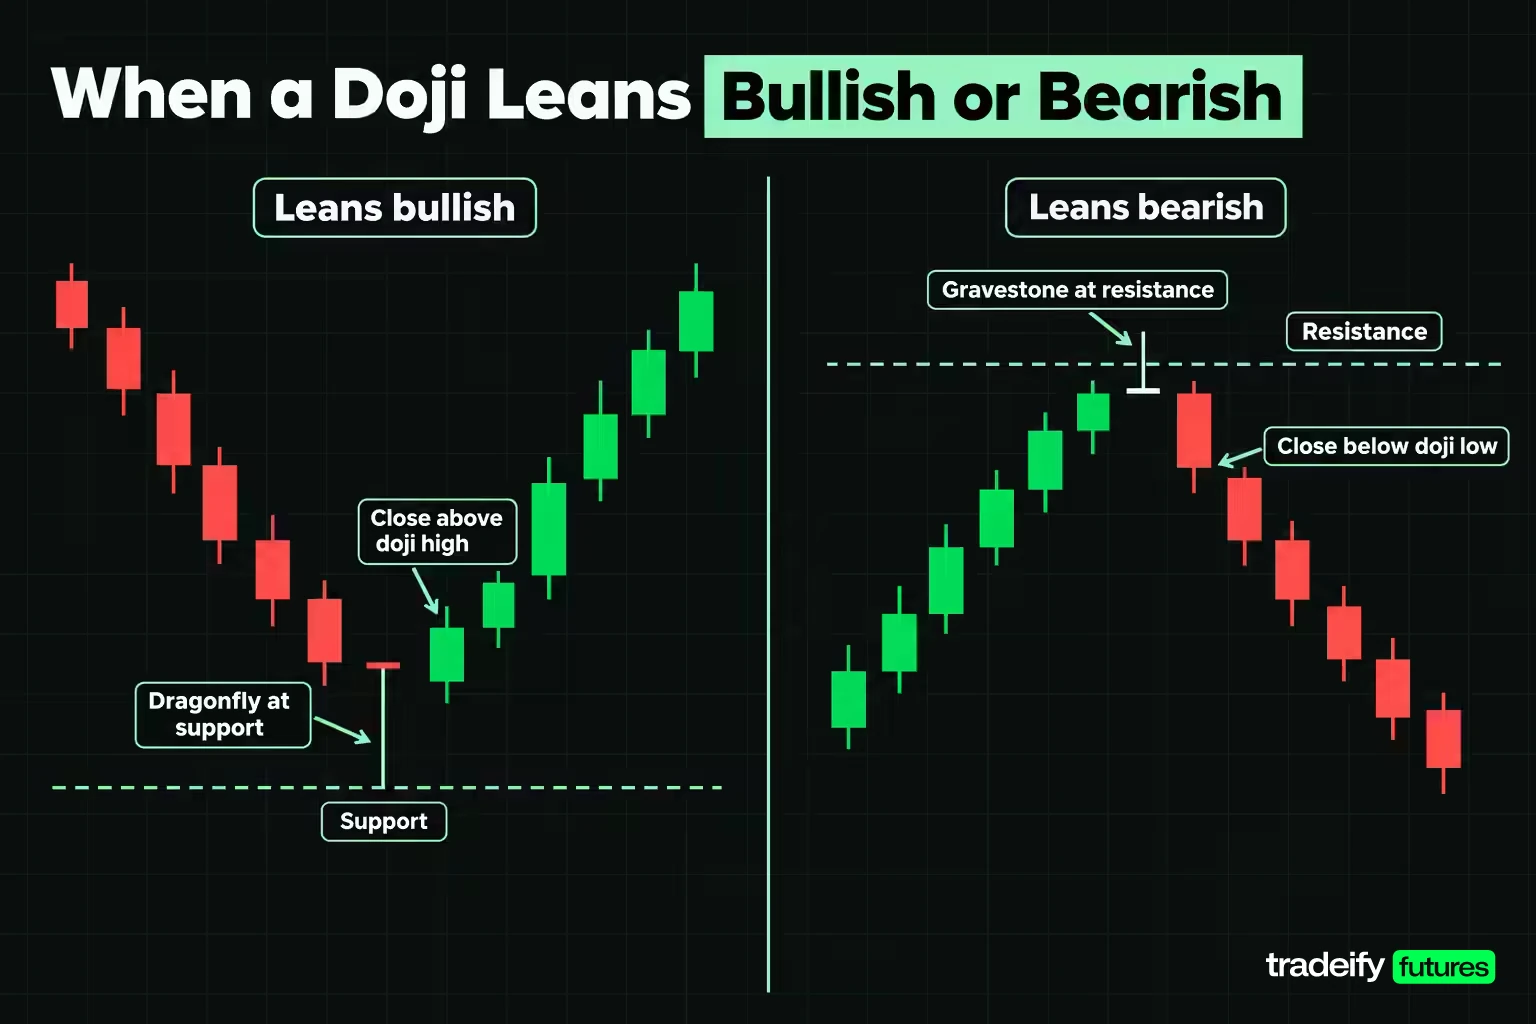
A doji is neither bullish nor bearish by itself. It leans one way when its shape and its location agree.
A doji leans bullish when:
- It is a dragonfly, so lower prices were rejected and price closed at the top of the bar.
- It forms after a decline, at a support level you marked before the bar printed.
- The next bar closes above the doji high.
A doji leans bearish when:
- It is a gravestone, so higher prices were rejected and price closed at the bottom of the bar.
- It forms after an advance, at a resistance level you marked earlier.
- The next bar closes below the doji low.
When shape and location disagree, the reading weakens. A gravestone at support after a decline is a failed push higher inside a downtrend, not a sell signal at the low. A dragonfly in the middle of a range is a long shadow with nothing to defend.
Related lesson: Support and resistance
Which Doji Signals to Filter Out
Most dojis are not worth acting on, and the filter matters more than the pattern. Before any doji reaches your watch list, it should clear these:
- Size. It clears the range floor (0.75 times the 14-bar ATR, or whatever floor you tested).
- Location. It sits at a level marked before the bar, not at a line drawn afterward to fit it.
- Context. It follows a directional move, so there is something for indecision to interrupt.
- Timing. It is not the last bar of a thin session, a holiday half-day or the quiet minutes around a session open, where position squaring can mimic indecision.
- Bar completion. It has closed. A doji mid-bar is a guess, because the close is still unknown.
How often doji candles appear on ES daily bars
How rare is a doji worth reading? This illustrative study counted dojis on E-mini S&P 500 futures (continuous front-month ES) daily bars from November 22, 2024 to November 2, 2026, using Yahoo Finance chart data read on November 4, 2026. That covers 488 daily bars. The rule was the body to range screen at 5% and 10%, with and without a range floor of 0.75 times a simple 14-day ATR.
| ES daily screen | Bars that qualified | Share of 488 bars |
|---|---|---|
| Body 5% of range or less | 31 | 6.4% |
| Body 10% of range or less | 56 | 11.5% |
| 5% screen plus range floor | 14 | 2.9% |
| 10% screen plus range floor | 24 | 4.9% |
The range floor cut the strict count by more than half. A doji screen without a size check mostly catches small, quiet sessions. If your chart shows dojis every few bars, the screen is too loose or the instrument is too thin. Treat this as an illustrative study: one market, one timeframe and two years, which is a short sample.
Why a Doji Needs Confirmation
A doji needs confirmation because it records a pause, and a pause can end in either direction. The confirmation is the next bar closing beyond the doji's high or low in the direction your level suggests.
In an illustrative count on E-mini S&P 500 futures daily bars (Yahoo Finance chart data, November 2024 to November 2026, 488 bars), the 14 dojis with a body of 5% of range or less and a range of at least 0.75 times the 14-day ATR were followed by:
- 4 next-day closes above the doji high.
- 1 next-day close below the doji low.
- 9 next-day closes back inside the doji range.
So 9 of 14 strict dojis were not resolved the next day at all. That is a small sample from one market, and it says nothing about direction. It does show why acting on the doji's close is premature: most of the time the next bar kept the indecision going.
Rules worth writing down before the session:
- Mark the level first. No doji counts without a level you identified earlier.
- Run both screens. The ratio sits inside your threshold, and the range clears the floor.
- Name the invalidation before the entry. Above the doji high plus a buffer for a short, below the doji low minus the same buffer for a long.
- Choose the entry trigger in advance, either a stop order through the far side of the doji or a close beyond it.
- Give the setup one bar. If the next bar closes back inside the doji range, the reading is void, not deferred.
The fifth rule is the one that saves money. After a failed confirmation bar, the urge is to wait for the next one, and then the one after that. At that point you are no longer trading a doji, you are holding a hope.
Doji Candles Inside a Trend
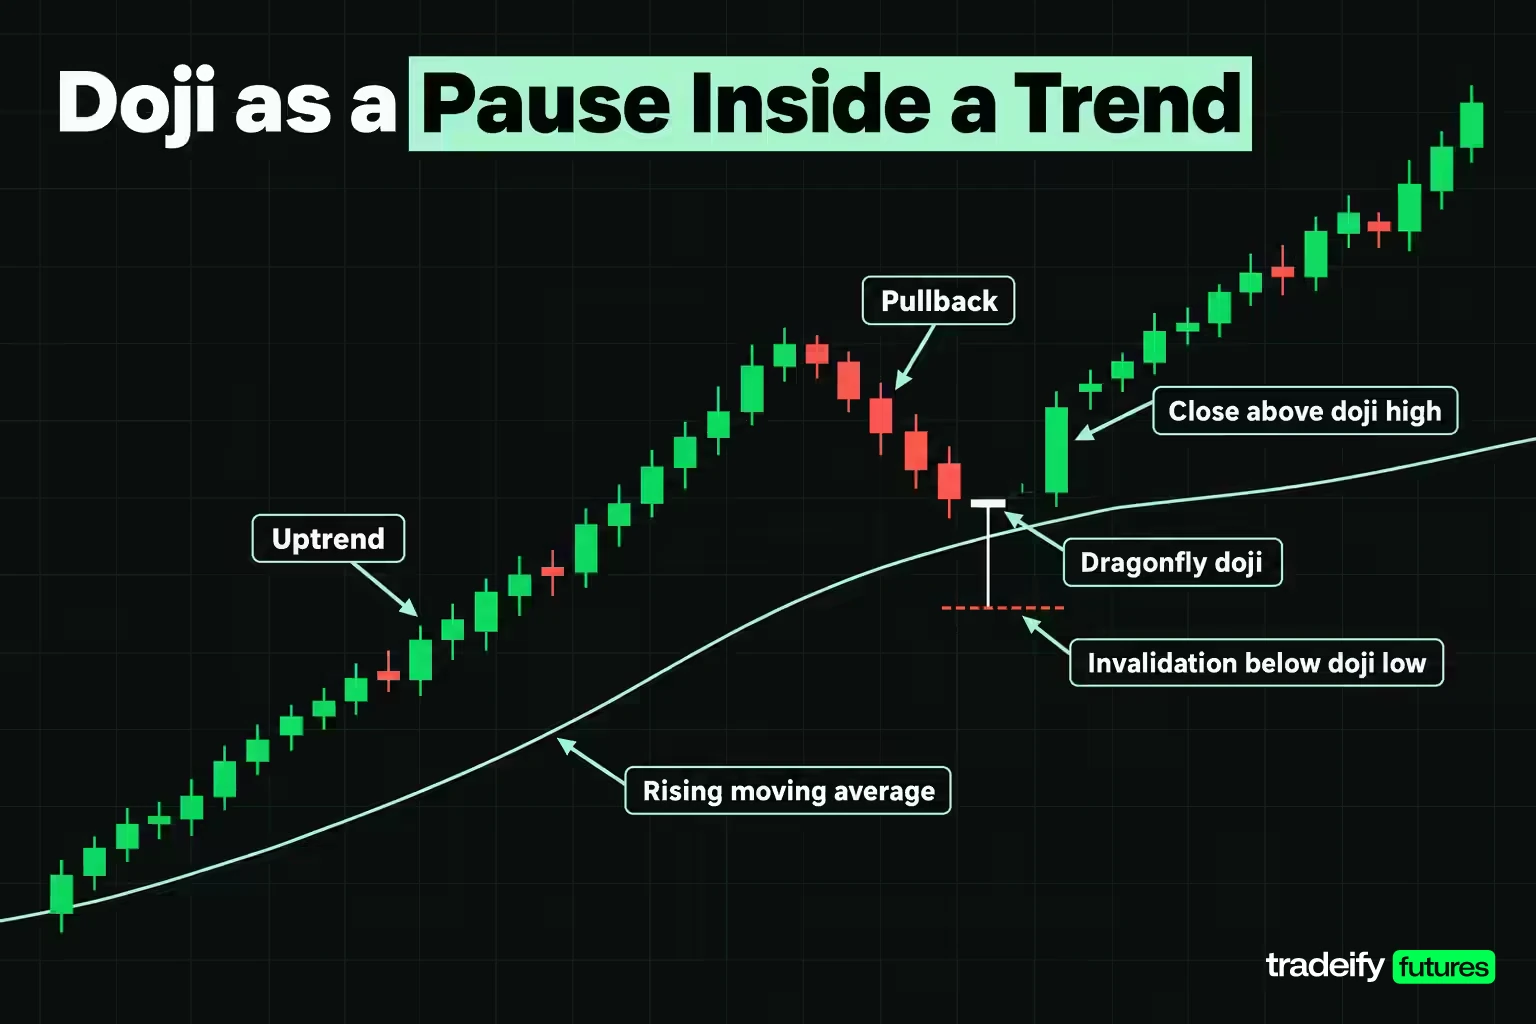
In a trending market, a doji is more often a pause than a turn, and trend traders can use that.
During an uptrend, a pullback to a rising moving average or a prior breakout level can end with a dragonfly doji. That bar shows sellers pushed into the pullback and buyers took it back by the close. If the next bar closes above the doji high, the doji marks a possible continuation entry with a clear invalidation below its low. The downtrend version is a gravestone on a rally into resistance.
A doji at the extreme of a trend, after a stretch of large bars, is the reversal case. It deserves a higher bar for confirmation because it is trading against the prevailing direction. Many trend traders treat it as a reason to tighten or take partial profit on an existing position rather than a reason to flip.
Double and triple doji clusters
Two or three dojis in a row describe compression. The market has paused for several periods, and the range of the cluster often becomes the level that matters. A close outside the cluster's combined high or low is the cleaner signal, and it says more than any single doji inside it. The trap is reading each doji in the cluster as a fresh reversal warning. Three indecisive bars are one decision deferred, not three signals.
Related lesson: Market structure highs lows and trends
Using a Doji With RSI and Moving Averages
Indicators can add context to a doji, but they rarely add an edge on their own. Common pairings:
- Moving averages. A doji touching a rising 20- or 50-period average in an uptrend frames a pullback, and the average gives a second reason for the level.
- RSI. A gravestone with RSI above 70, or a dragonfly with RSI below 30, aligns the doji with a stretched reading. RSI divergence into the doji adds context too.
- Volume. A doji on heavier volume than recent bars means more participants were involved in the rejection.
The research is not kind to stacking filters. Tharavanij, Siraprapasiri and Rajchamaha (Sage Open, 2017) studied Thai SET50 stocks and tested candlestick reversal patterns with and without Stochastics %D, RSI and Money Flow Index filters, and found the filters generally did not increase profitability or prediction accuracy. Use an indicator to choose which levels to watch, not as proof that a doji will work.
Related lesson: Relative strength index RSI
A Worked Doji Trading Strategy on Micro E-mini S&P 500 Futures
This worked doji trading strategy shows how each choice changes the trade's cost. Everything is illustrative: the account, the prices and the bars are made-up round numbers chosen to show the arithmetic.
Imagine an account of $25,000 with a plan that risks 0.5% per trade, or $125. MES has been advancing into a resistance level marked the day before. A bar prints the long-legged doji from the identification table: open 7,008.25, high 7,016.75, low 7,000.00, close 7,008.50. Its body is 1.49% of a 16.75-point range, and it clears the 10.50-point floor.
The setup is a short, with the stop two ticks (0.50 points) above the doji high at 7,017.25. The next bar opens at 7,008.00, trades up to 7,008.75 and down to 6,995.50, and closes at 6,996.50, below the doji low. The structural target is a prior support level at 6,962.50.
Three ways to enter the doji short
| Entry choice | Entry | Stop | Stop distance | Risk per MES contract | Target | Reward | Reward multiple | Break-even win rate |
|---|---|---|---|---|---|---|---|---|
| Sell stop through the doji low | 7,000.00 | 7,017.25 | 17.25 points | $86.25 | 6,962.50 | 37.50 points, $187.50 | 2.17R | 31.5% |
| Wait for a close below the doji low | 6,996.50 | 7,017.25 | 20.75 points | $103.75 | 6,962.50 | 34.00 points, $170.00 | 1.64R | 37.9% |
| Sell stop, target projected from the doji range | 7,000.00 | 7,017.25 | 17.25 points | $86.25 | 6,983.25 | 16.75 points, $83.75 | 0.97R | 50.7% |
The two realistic entries are 3.50 points apart. Waiting for the close raised risk per contract by 20.3%, from $86.25 to $103.75, and cut the reward multiple from 2.17R to 1.64R. That lifts the break-even win rate (1 divided by 1 plus R) from 31.5% to 37.9%.
Neither choice is right in general. The sell stop gets a better price and catches failed breaks that snap back. The close-based entry costs about 0.5R but filters out the bars that poke through the low and reverse. What matters is choosing one before the bar prints. Pick after the fact and you will chase the close after a fast break and hide behind the stop order after a slow one.
The third row is the trap. Projecting the target from the doji's own 16.75-point range drops the reward to 0.97R and needs a 50.7% win rate to break even. A doji's range has no relationship to how far price can travel. The next support level does.
Why a stop inside the doji range fails
A stop inside the doji range looks attractive on this illustrative MES short, where the doji runs from 7,000.00 to 7,016.75 and the next bar's high is 7,008.75. Placed two ticks above that high at 7,009.25, the stop is 9.25 points from a 7,000.00 entry, or $46.25 per contract at $5 per point. That fits 2 contracts inside a $125 risk budget for $92.50 of risk, or 0.370% of the account, against $86.25 and 0.345% for one contract with the wide stop.
| Stop placement | Stop price | Distance from 7,000.00 | Risk per contract | Contracts in $125 | Total risk | Where it sits |
|---|---|---|---|---|---|---|
| Two ticks above the doji high | 7,017.25 | 17.25 points | $86.25 | 1 | $86.25 | Beyond the whole rejection bar |
| Two ticks above the confirmation high | 7,009.25 | 9.25 points | $46.25 | 2 | $92.50 | 55.2% of the way up the doji |
The tight stop sits 55.2% of the way up the doji, and the doji's range is 1.81 times the stop distance. Ordinary movement across the bar that created the setup can stop you out before the idea is tested. The tight stop did not reduce risk. It doubled the size and handed the market an easier exit.
Doji Pattern Strengths, Limits and the Research
Doji candlestick patterns have real strengths:
- They are easy to spot once a ratio screen replaces the eye.
- They put a precise price on rejection, the far end of a shadow, which gives a natural invalidation point.
- They appear on every timeframe and every liquid market.
- They slow you down. A doji at your level is a cue to check context instead of chasing.
The limits are just as real:
- A doji has no direction until the next bar arrives.
- Thresholds vary between platforms and traders, so two people can disagree on which bar is a doji.
- They appear often on quiet bars and thin markets, where they mean little.
- Waiting for confirmation costs price. On an illustrative MES doji short, waiting for a close below the doji low cut the reward multiple from 2.17R to 1.64R.
Academic studies of candlestick and doji patterns
The academic record on candlestick patterns is mostly negative, and dojis are part of the pattern sets tested.
- Marshall, Young and Rose (Journal of Banking and Finance, 2006) found candlestick strategies had no value on Dow Jones Industrial Average stocks over 1992-2002, using a bootstrap test against random price series.
- Marshall, Young and Cahan (Review of Quantitative Finance and Accounting, 2008) found no evidence candlestick analysis was profitable on the largest 100 Tokyo Stock Exchange stocks over 1975-2004, even before transaction costs. Their pattern set included the dragonfly and gravestone doji.
- Tharavanij, Siraprapasiri and Rajchamaha (Sage Open, 2017) found the mean returns of most candlestick reversal patterns on Thai SET50 stocks from 2006 to 2016 were not statistically different from zero.
- Lu and Shiu (Emerging Markets Finance and Trade, 2012) studied Taiwan 50 Index stocks from 2002 to 2009, found existing two-day patterns not profitable, and reported two bullish two-day patterns that consistently outperformed others.
None of these studies tested futures intraday with a level and a stop, which is how most traders use a doji. They tested patterns as standalone signals with fixed holding periods. The fair reading is that a doji is not an edge by itself. A doji is a way to time an entry at a level you already had a reason to trade, with the stop and size fixed first.
Trading Doji Setups Under Prop Firm Account Rules
On a futures prop account, the doji question shifts from "is this a signal" to "does this setup fit the rules". Three constraints usually matter more than the candle.
- Session limits. If positions must be flat by a set time each day, a daily doji is context for the next session, not a swing trade. The entries come from intraday bars.
- Contract limits. Size is capped by the account's contract allowance, so a tight stop that doubles size can run into the cap as well as the risk budget.
- Costs. On micros, round-trip commissions take a bigger share of a small doji-range target than of a structural target.
On our accounts, every position must be closed by 4:45 PM ET, so a doji trade is a single-session trade. A 25K account allows 1 mini or 10 micros, and our Help Center notes that 10 MES cost $18.20 round trip against $5.76 for 1 ES, so size in minis once you reach ten micros. Our funded accounts are simulated, and WealthCharts Chart Replay is a practical way to rehearse doji entries on historical bars before risking an account.
Related lesson: Hammer and inverted hammer patterns
Doji Candlestick Patterns FAQ
What does a doji candle mean?
A doji candle means the open and close of a period were equal or nearly equal, so neither buyers nor sellers kept control by the close. It records indecision, not direction. The next bar and the location decide whether it matters.
Is a doji candlestick bullish or bearish?
Neither on its own. A dragonfly doji at support after a decline leans bullish, and a gravestone doji at resistance after an advance leans bearish. Both readings need a next-bar close beyond the doji to count.
What is a doji star candlestick pattern?
A doji star is a three-candle reversal pattern with a doji as the middle bar. The morning doji star follows a long bearish candle with a doji that gaps lower, then a bullish candle that closes into the first candle's body. The evening doji star is the bearish mirror image.
What happens after a doji candle?
The next bar resolves it. A close beyond the doji high or low in the expected direction is confirmation, and a close back inside the range keeps the indecision going. In an illustrative count on ES daily bars from Yahoo Finance chart data (November 2024 to November 2026), 9 of 14 strict dojis were followed by a close back inside the range.
What is the difference between a doji and a spinning top?
The body. A spinning top has a small but visible body, so one side gained some ground by the close, while a doji's body is negligible against its range. A body to range ratio screen usually puts spinning tops above the threshold and dojis below it.
What are the strongest candlestick patterns?
No candlestick pattern has a strong standalone record in academic tests on broad stock samples. Multi-bar patterns that include their own confirmation, such as engulfing patterns or morning and evening stars, give more information than a single doji. Strength comes from location and confirmation more than from the pattern's name.
What are candlestick patterns in trading?
Candlestick patterns are shapes formed by one to three bars' open, high, low and close that traders read for signs of continuation or reversal. The doji, hammer, engulfing and star patterns are common examples. They are descriptions of past price action, not forecasts.
This article is general education about reading a candlestick pattern, not investment advice or a recommendation to trade any product. Futures are leveraged, and losses can build quickly and exceed what you expect when price moves through a level without warning. Evaluation and funded accounts at prop firms are simulated, and simulated results do not represent live trading. Every price, account size and trade in the worked examples is illustrative, and the ES study is a small historical sample that does not predict future results.


