



TL;DR: Hammer and inverted hammer patterns are small-bodied candles with a shadow at least 2x the body, read as bullish only after a decline. The same shapes after a rise are the hanging man and shooting star. Trade one only with a stop below the low and a written confirmation rule. In an illustrative ES example, confirming a hammer lifted the break-even win rate from 38.05% to 46.90%. Mechanical studies on stocks find weak, market-dependent results, so test the pattern on your own log.
A hammer prints at the bottom of a selloff and the temptation is immediate. The long tail looks like proof that buyers showed up, and the next candle feels like the last cheap price you will see.
That feeling is the problem. Reading the bottom correctly and having a valid entry are two different decisions, and the candle only helps with the first one.
Hammer and inverted hammer patterns are worth knowing because they mark a specific price where a decline was refused. They are not worth trading on shape alone. This guide covers what each candle looks like, the psychology inside it, how it differs from its bearish twins, how to confirm it, and what a worked trade on E-mini S&P 500 futures costs at each entry choice. It closes with what published studies found when they tested these shapes mechanically, which is less flattering than most pattern guides admit.
What a Hammer Candlestick Looks Like
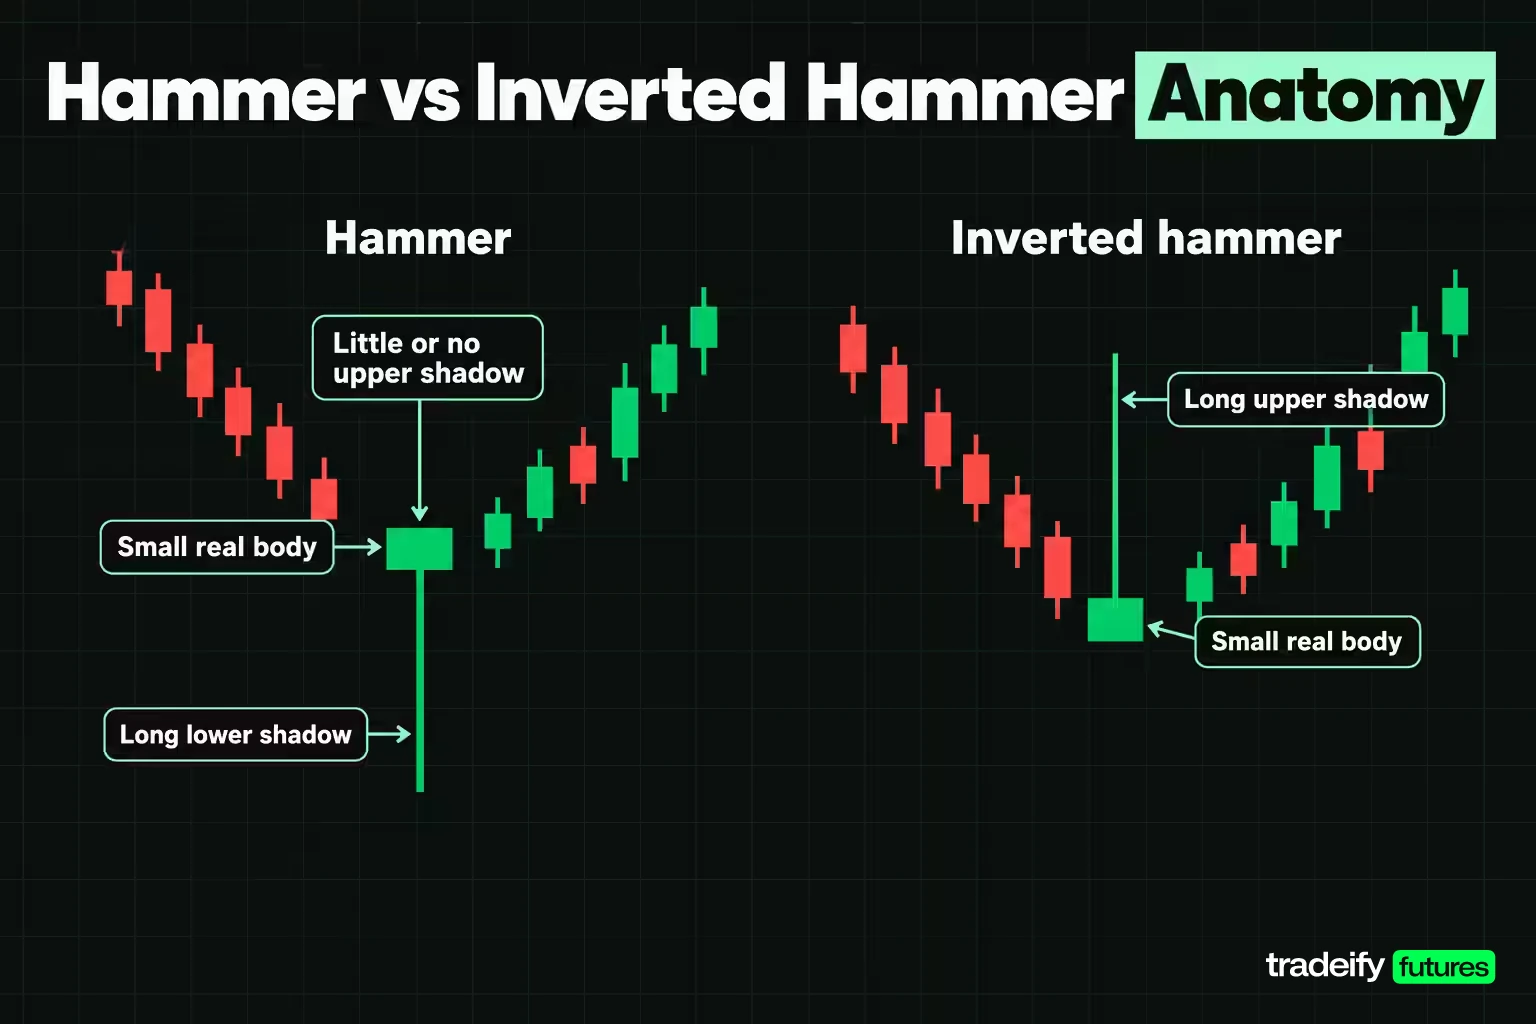
A hammer candlestick is a single candle with a small real body in the upper part of its range, a long lower shadow, and little or no upper shadow. It only counts as a hammer when it forms after a decline. The same shape after a rise has a different name and a different reading.
The parts of a hammer each carry information:
- Real body. The box between the open and the close. On a hammer it is small, so the session ended close to where it started.
- Lower shadow. The line from the bottom of the body to the session low. On a hammer it is long, usually at least two times the height of the body, and it records how far sellers pushed price before it came back.
- Upper shadow. The line from the top of the body to the session high. On a hammer it is absent or very short, so the close sits near the top of the range.
Those descriptions are conventions, not measured laws. Charting references commonly use a lower shadow of at least 2 times the body and a body of roughly one third of the range or less. Some note that the strongest examples run three to five times the body. Pick one version, write it down and keep it fixed, because a definition that changes from chart to chart cannot be tested.
Five tests that qualify a hammer candle
Turning the description into numbers removes most of the guesswork. Here is an illustrative 5-minute E-mini S&P 500 (ES) bar run through five tests. The prices are round illustrative levels, not a record of a real session: open 6,005.00, high 6,007.00, low 5,996.00, close 6,006.50, after a slide from 6,040.00.
| Hammer test | What it measures | Threshold used | Illustrative ES bar | Result |
|---|---|---|---|---|
| Location | Whether a decline came before the bar | Lowest low of the recent swing after a clear decline | A 44.00 point slide from 6,040.00 into the 5,996.00 low | Pass |
| Body size | Body as a share of the full range | About one third of the range or less | 1.50 points of an 11.00 point range, which is 13.64% | Pass |
| Lower shadow | Lower shadow against the body | At least 2 times the body | 9.00 points, which is 6.00 times the body | Pass |
| Upper shadow | How quiet the opposite side is | Small against the range | 0.50 points, which is 4.55% of the range | Pass |
| Close position | Where the close sits inside the range | Upper third of the range | 6,006.50, which is 95.45% of the way up | Pass |
On ES, one index point is worth $50 and the minimum tick is 0.25 points, or $12.50. So the 11.00 point range is 44 ticks. That number matters later, because the stop for this bar sits below a low that is already 44 ticks away from the high.
What an Inverted Hammer Candlestick Looks Like
An inverted hammer candlestick is the hammer turned upside down. The small body sits in the lower part of the range, a long upper shadow extends above it, and the lower shadow is small or missing. Like the hammer, it is read as a possible bullish reversal only when it forms after a decline.
The inverted hammer parts read like this:
- Real body. Small, near the session low.
- Upper shadow. Long, again at least two times the body by the usual convention. It records how far buyers lifted price before sellers pushed it back.
- Lower shadow. Short or absent, because the session never traded much below the body.
An illustrative inverted hammer on the same ES 5-minute chart: open 6,001.00, high 6,010.00, low 6,000.50, close 6,002.50. The range is 9.50 points and the body is 1.50 points, or 15.79% of the range. The upper shadow is 7.50 points, which is 5.00 times the body, and the lower shadow is 0.50 points, or 5.26% of the range. The close sits 21.05% of the way up the bar, in the lower third, which is where an inverted hammer's close should be.
The inverted hammer's shape is the same as a shooting star. What separates them is the trend before the candle: after a decline the shape is an inverted hammer, and after a rise it is a shooting star.
The Psychology Behind Hammer and Inverted Hammer Candles
The psychology behind a hammer candle is a session-long argument between sellers and buyers, and the shape is the transcript.
A hammer session usually runs like this:
- Price opens inside an existing decline, and sellers do what they have been doing. They push it lower, often through a level that looks like support.
- Lower prices attract buyers, or force short sellers to take profit. Price stops falling.
- Buying carries price back up through most of the session's losses, and the bar closes near its high.
The long lower shadow is the record of that failed selloff. After a run of lower closes, it suggests sellers no longer had enough force to hold price down at the lows. That is a meaningful change in behavior, and it is still only one session.
The inverted hammer tells a weaker story. Buyers lifted price well above the open, which is new after a decline, but sellers pushed it back and the bar closed near its low. The bulls showed up and failed to hold their ground. The argument for a reversal is that buyers are now willing to test higher prices at all. The argument against is that they lost the session. That is why most traders treat an inverted hammer as an early warning that needs more proof than a hammer does.
Neither candle says the trend has turned. Each one says a single push failed, at a price you can now name. That is less exciting than a reversal call, and far more useful.
Why Hammer and Inverted Hammer Patterns Signal a Possible Reversal
Hammer and inverted hammer patterns signal a possible bullish reversal because they show a decline meeting resistance from buyers at a specific price. A market bottom needs exactly that: a point where lower prices stop producing more selling and start producing buying. A hammer is one candle where that may have started.
The key word is possible. TradingView's own pattern guide calls the hammer, on its own, "a moderate signal" and notes that the downtrend can continue after the candle forms, especially in a strong bear market. That matches how the pattern behaves. A hammer in the middle of a heavy selloff is often just a pause before the next leg lower.
The reversal reading gets more credible when three things line up:
- A real decline came first. A hammer needs something to reverse. A few red bars inside a sideways range are not a downtrend.
- The low sits at a level that matters. A prior swing low, a round number or a trendline gives the rejection meaning beyond one bar.
- The next price action agrees. A higher close, a break of the candle's high or a higher low turns a possible reversal into a confirmed one.
What would prove the reading wrong is just as clear. If price trades back below the hammer's low, the failed selloff has stopped failing. The buyers who defended that low are now underwater, and the bullish case is gone. That invalidation price is the most useful thing a hammer gives you, because it tells you where the stop belongs before you think about an entry.
Hammer vs Hanging Man and Inverted Hammer vs Shooting Star
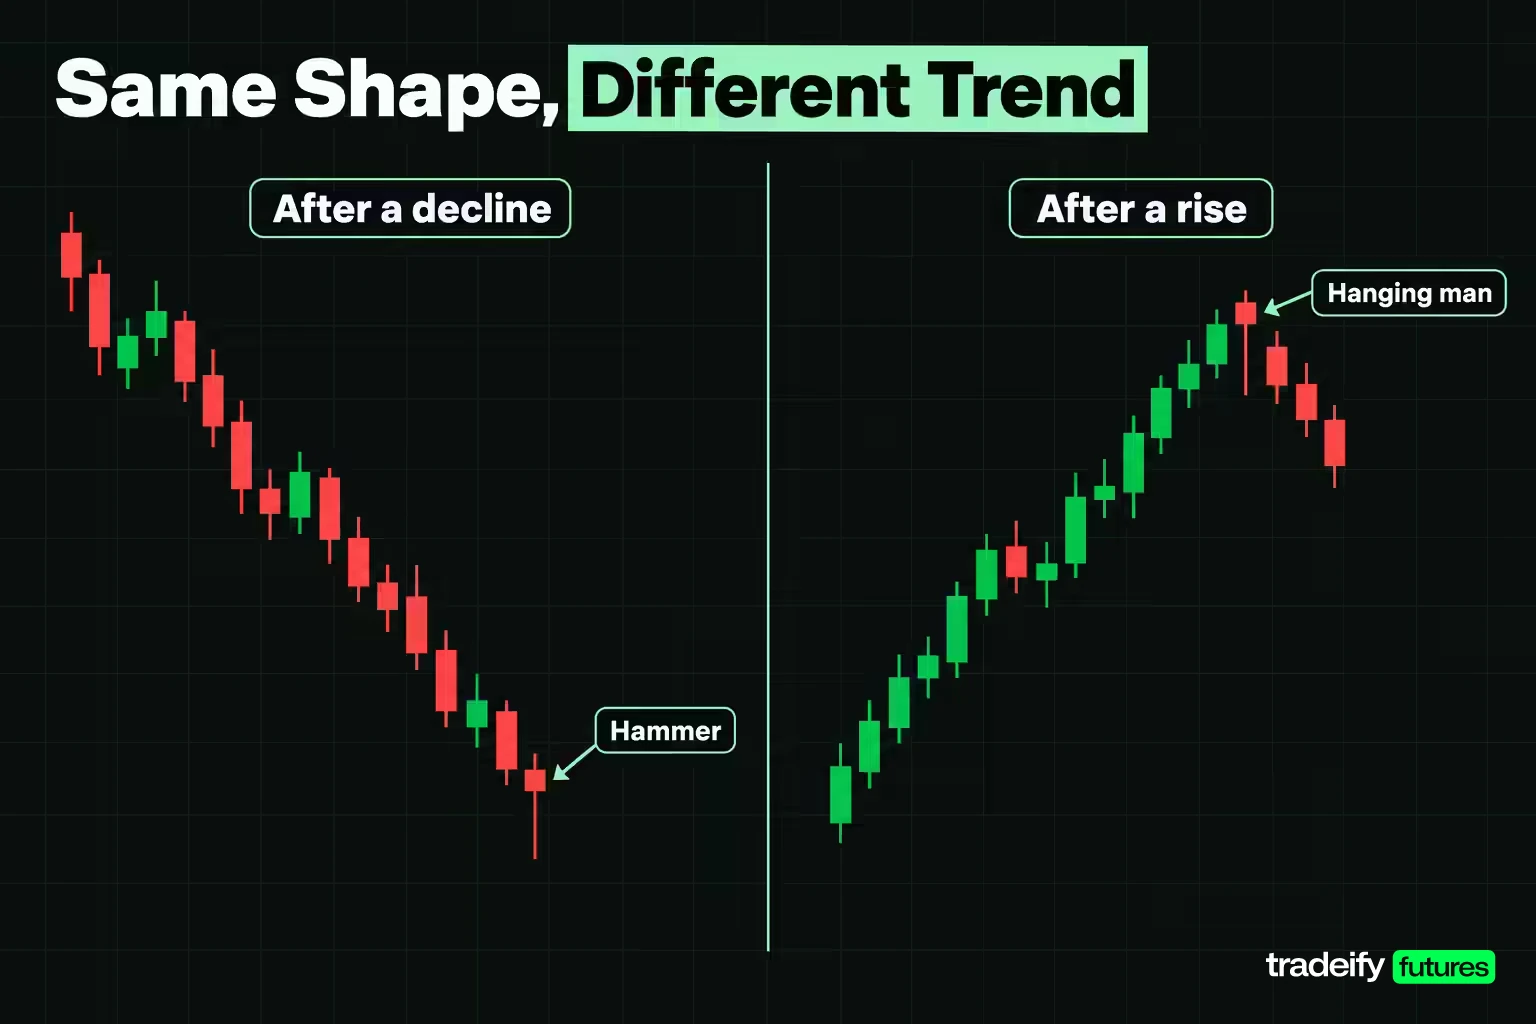
The hammer and the hanging man are the same shape, and so are the inverted hammer and the shooting star. The candle does not change. The trend before it does.
| Candle | Shape | Trend before it | Usual reading |
|---|---|---|---|
| Hammer | Small body high in the range, long lower shadow | Decline | Possible bullish reversal |
| Hanging man | Small body high in the range, long lower shadow | Rise | Possible bearish reversal, usually a warning |
| Inverted hammer | Small body low in the range, long upper shadow | Decline | Possible bullish reversal, needs confirmation |
| Shooting star | Small body low in the range, long upper shadow | Rise | Possible bearish reversal |
Related lesson: Shooting star and hanging man patterns
Telling a hammer from a hanging man in practice
Telling a hammer from a hanging man starts with the bars before the candle, not the candle itself. Take the illustrative ES bar used for the hammer tests: open 6,005.00, high 6,007.00, low 5,996.00, close 6,006.50. After a 44.00 point slide from 6,040.00, it is a hammer, and the trade question is whether to buy above its high with a stop under 5,996.00. Print the identical bar after a climb from 5,960.00, and it is a hanging man. Now the question is whether longs should tighten their stops, and the warning only becomes a short signal if a later bar closes below the hanging man's body or low.
Three checks keep the two apart:
- Direction of the swing. Mark the last swing high and swing low. A candle at the bottom of a falling swing is a hammer candidate; one at the top of a rising swing is a hanging man candidate.
- Where the shadow reached. A hammer's shadow usually tests a support level below. A hanging man's shadow dips into a rally that had not been tested.
- What confirmation means. A hammer is confirmed by price going higher. A hanging man is confirmed by price going lower. The same next bar can confirm one and cancel the other.
Charting tools make the same split. TradingView's built-in hammer and hanging man detectors describe the same shape and use a trend setting, such as price against its 50-period simple moving average, to decide which name applies.
Why the hanging man is a weaker hammer twin
The hanging man shows sellers pushing price sharply lower inside an uptrend, which is new information. But the candle still closes near its high, so buyers won that session. TradingView describes the hanging man as a weaker signal than the hammer for that reason, and most traders treat it as a warning rather than an exit trigger. The bearish case usually needs the next session to open and close lower.
Why the inverted hammer is a weaker signal than the shooting star
A shooting star appears after a rise. Buyers push price much higher, then sellers drive it back to the open by the close. In an uptrend, that is a clean rejection of higher prices, and the session ends with the sellers winning. The inverted hammer has the same session story at the bottom of a decline, and there the losing side is the buyers. So the same shape can make a stronger bearish case at a top than a bullish case at a bottom. The candle is identical; what it implies about who controlled the close is not.
The rule that falls out of this comparison is simple. Read the trend first, then the candle. A shape with no trend in front of it has no name.
Green vs Red Hammer Candles
A green hammer closes above its open and a red hammer closes below its open. The colour of a hammer tells you which way the body points, and on a candle with a body this small the difference is a few ticks.
Some references treat a green hammer as slightly stronger, because the close made it above the open. That reasoning is fair as far as it goes. But the information that makes a hammer a hammer is in the long lower shadow, the small body and the close near the high, and both colours share all three.
One study gives a rare look at the two colours separately. Tharavanij, Siraprapasiri and Rajchamaha tested candlestick patterns on the 50 largest stocks in the Stock Exchange of Thailand from July 3, 2006 to June 30, 2016. Their "paper umbrella" patterns are hammer shapes with no upper shadow and a lower shadow more than 2 times the body. Under a fixed-date exit:
- The white (green) version printed 921 signals. Its mean returns were 0.10% after 1 day, 0.00% after 3 days, -0.25% after 5 days and -0.06% after 10 days, none statistically significant.
- In the same Tharavanij study, the black (red) version printed 12,591 signals. Its mean returns were -0.08% after 1 day, 0.07% after 3 days, 0.15% after 5 days and 0.28% after 10 days. The 3-day figure was significant, but the paper itself points out it came with a 4.36% standard deviation.
In that sample, green did not beat red. That is one market and one method, so treat it as a reason to stop sorting hammers by colour, not as a new rule that red is better.
What a red inverted hammer means
A red inverted hammer closes below its open, so buyers lifted price, lost the move and finished slightly lower than they started. After a decline, it is still read as a possible bullish reversal, just a less convincing one than a green inverted hammer, which at least closed above its open. Either colour needs the same confirmation: price closing above the inverted hammer's high.
Hammer Candle Variants Like the Dragonfly Doji
Several hammer variants share the hammer's idea, a long shadow that records a rejected move, with small changes in the body:
- Dragonfly doji. Open and close at or near the session high, with almost no body and a long lower shadow. It is the hammer's extreme form, with buyers erasing the whole selloff. After a downtrend it is read as possible lower price rejection, and its colour does not matter.
- Gravestone doji. Open, close and low at or near the same price with a long upper shadow. It is the inverted hammer's extreme form, and like the shooting star it is usually read as bearish after a rise.
- Paper umbrella. A hammer-shaped candle with the high equal to the close (green) or the open (red). Some academic studies use this name, and it also covers the hanging man shape, since the label describes the candle, not the trend.
- Long lower shadow candle. A broader category for any candle with a long lower shadow. Charting tools often flag it separately, and it does not require the small body a hammer needs.
Related lesson: Doji candlestick patterns
The practical point for the hammer family: if you trade hammers, decide in advance whether a dragonfly doji counts. Mixing the two in one log blurs your results.
Reading Hammer Patterns in Context
Reading hammer patterns in context means asking where the candle printed before asking what it looks like. Context is what separates a hammer worth tracking from the hundreds of hammer-shaped bars on any chart.
Four questions do most of the work:
- How large was the decline? In the illustrative ES example, price fell 44.00 points from 6,040.00 into the 5,996.00 low. A long, orderly decline gives the hammer something to reverse. A two-bar dip in a range does not.
- Is there a level under the low? The example's low wicked through an illustrative prior swing low at 5,997.00 and closed back above it. That is a cleaner story than a hammer in open space, because traders who sold the break are now trapped above their entry.
- What does market structure say? If the decline is a pullback inside a larger uptrend, a hammer at the pullback low agrees with the bigger trend. If the larger trend is down, the hammer is fighting it and deserves a smaller expectation.
- Where is the next obstacle? A hammer that bounces straight into a prior lower high has little room. The illustrative target at 6,024.00 is that prior lower high, which is why the trade stops there.
Related lesson: Support and resistance
A hammer at a meaningful level after a meaningful decline is a candidate. A hammer anywhere else is usually noise.
How to Confirm a Hammer or Inverted Hammer
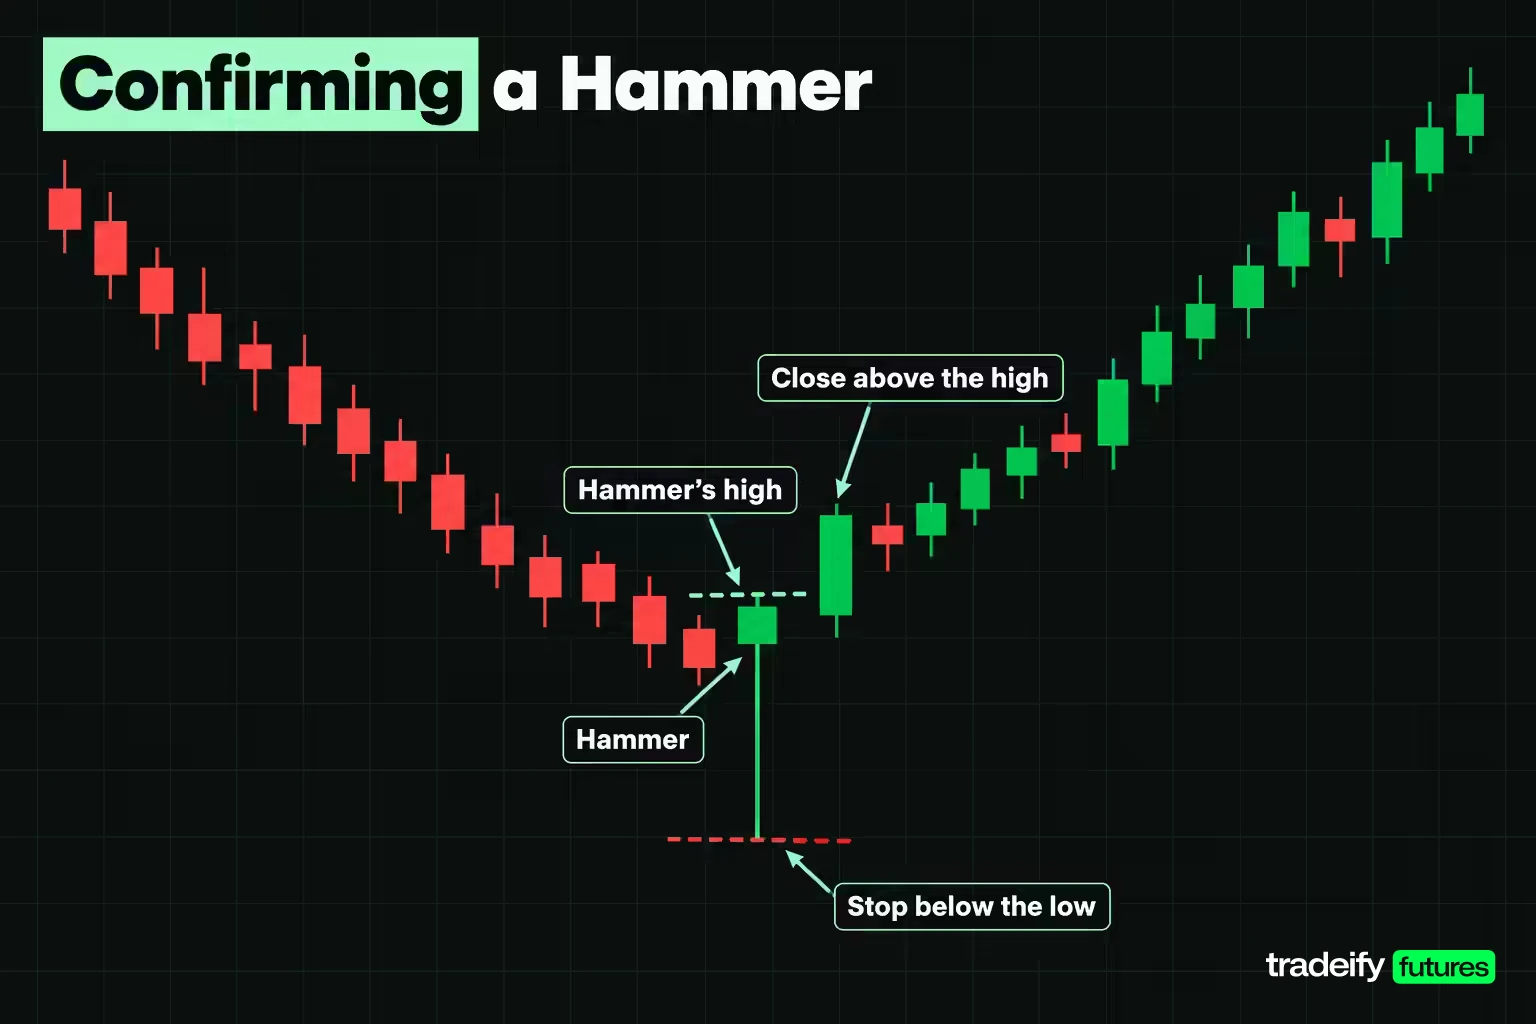
Confirming a hammer or inverted hammer means waiting for price to agree with the candle before acting on it. Confirmation is a price, not a feeling, so define it in a way you could hand to someone else.
Common confirmation methods for a hammer:
- A close above the hammer's high. The most common version. Investopedia describes waiting for a bullish candle that closes above the hammer's high.
- A close above the hammer's body. A looser version. TradingView lists a bullish candle closing above the body on the next session as adding weight.
- A break of the hammer's high. A buy stop one tick above the high fills the moment price trades through it, before the bar closes.
- A higher low. The next pullback holds above the hammer's low, which shows the defended level held twice.
For an inverted hammer the bar is higher. Confirmation usually means a close above the long upper shadow, because that shadow marks exactly where sellers were willing to act. That requirement is stricter than it sounds, and the worked example in this guide shows what it costs.
Each method has a tradeoff. Faster confirmation gives a better price and more false starts. Slower confirmation filters more failures and gives back more of the move. Neither is correct by default. What matters is choosing one and keeping it, so your results describe one rule instead of a mix.
Combining hammer patterns with indicators and volume
Indicators can serve as filters for hammer patterns, as long as you treat them as filters to test, not as proof. Common combinations:
- RSI. A hammer that prints while the Relative Strength Index is in oversold territory suggests the decline was stretched. TradingView lists oversold RSI as context that adds weight.
- Moving averages. A hammer at a rising 50-period average in a larger uptrend lines up with trend direction. TradingView's built-in detector even uses the 50-period simple moving average, or the 50 and 200-period pair, to decide whether a downtrend existed before the candle.
- Volume. Higher volume on the hammer or the confirming bar suggests real participation in the rejection rather than a thin wick.
One caution comes from the evidence rather than the theory. In the SET50 study, adding Stochastics, RSI or Money Flow Index filters generally did not increase profitability or prediction accuracy of candlestick patterns. A filter earns its place by removing failures in your own data, not by making the chart look more thorough.
Related lesson: Relative strength index
Trading Hammer and Inverted Hammer Patterns With a Worked ES Example
Trading hammer and inverted hammer patterns comes down to three numbers set before the order goes in: the stop, the entry and the target. The stop comes first, because it is the price that proves the read wrong.
The worked example uses an illustrative ES 5-minute hammer that printed after a 44.00 point decline: open 6,005.00, high 6,007.00, low 5,996.00, close 6,006.50. ES is worth $50 per point with a 0.25 point tick. All prices are round illustrative levels.
- Stop. One tick under the hammer's low, at 5,995.75. If price trades there, the buyers who defended 5,996.00 have lost.
- Target. The prior lower high at 6,024.00, where the decline last found sellers. The stop-to-target distance is 28.25 points.
- Entry. Three choices, each priced below.
Three hammer entry routes compared
The same hammer, the same stop and the same target produce three very different trades depending on when you enter. The micro contract (MES) is one tenth the size of ES, at $5 per point and $1.25 per tick.
| Hammer entry route | Entry price | Risk to stop | Risk per ES | Risk per MES | Reward to target | Reward to risk | Break-even win rate |
|---|---|---|---|---|---|---|---|
| At the hammer close | 6,006.50 | 10.75 points, 43 ticks | $537.50 | $53.75 | 17.50 points, 70 ticks | 1.63 | 38.05% |
| One tick above the hammer high | 6,007.25 | 11.50 points, 46 ticks | $575.00 | $57.50 | 16.75 points, 67 ticks | 1.46 | 40.71% |
| On a confirmation close | 6,009.00 | 13.25 points, 53 ticks | $662.50 | $66.25 | 15.00 points, 60 ticks | 1.13 | 46.90% |
The break-even win rate is risk divided by risk plus reward, before costs. Waiting for the confirmation close moves it from 38.05% to 46.90%, so the confirmed entry has to win far more often just to break even. That is the real question confirmation asks: does it remove enough failed hammers to pay for the worse price? Only a logged sample answers that.
Sizing a hammer trade from the stop
Position size follows from the stop distance, not the other way round. Take an illustrative risk budget of $300 per trade:
- One ES at the close entry risks $537.50, so ES does not fit on any route.
- At the close entry, 5 MES risk $268.75.
- On the break of the high, 5 MES risk $287.50.
- On the confirmation close, the size drops to 4 MES, risking $265.00.
The temptation is to keep 5 contracts on the confirmed entry because the setup looks better now. That quietly pushes the risk to $331.25, past the budget. Let the stop distance set the size every time.
Related lesson: Position sizing
Inverted hammer entries cost more to confirm
The inverted hammer shows the confirmation tradeoff at its sharpest. Take an illustrative ES 5-minute inverted hammer after a decline: open 6,001.00, high 6,010.00, low 6,000.50, close 6,002.50. The stop sits one tick under the low at 6,000.25, the target is a prior lower high at 6,024.00, and the risk budget is an illustrative $300.
- Entry at the close, 6,002.50. Risk is 2.25 points, 9 ticks, or $112.50 per ES and $11.25 per MES. Reward to risk is 9.56 and the break-even win rate is 9.47%. Those numbers look excellent because the trade is unconfirmed and most of the long upper shadow is still overhead as supply.
- Entry one tick above the high, 6,010.25. Risk is 10.00 points, 40 ticks, or $500.00 per ES and $50.00 per MES. Reward to risk falls to 1.38 and the break-even win rate rises to 42.11%. On the $300 budget that is 6 MES, risking $300.00.
Confirmation here costs 4.44 times the risk of the close entry, because the entry has to clear the whole upper shadow while the stop stays at the low. That is the honest reason many traders find inverted hammers harder to trade than hammers. The pattern can be valid and still offer a poor trade once confirmed.
Hammer Patterns on Different Timeframes
Hammer patterns appear on every timeframe, but they do not carry the same weight on each one. A daily hammer summarises a full session of buying and selling. A 1-minute hammer can be one large order and a few seconds of thin trading.
TradingView's pattern guide makes the same point directly: candles with a hammer shape appear often on lower timeframes, where many of them are noise. Most of the academic tests in this guide used daily bars. The one large intraday test, Duvinage, Mazza and Petitjean's study of 5-minute candles on the 30 Dow Jones stocks, found that after costs and a correction for data snooping no single candlestick rule beat buy and hold.
A practical way to use timeframes together:
- Higher timeframe for location. Mark the decline and the support level on a daily or hourly chart.
- Lower timeframe for the trigger. Look for the hammer on a 5 or 15-minute chart at that level.
- Same rules on both. Keep the body, shadow and close thresholds identical so you are not loosening the definition just because the lower timeframe offers more candles.
Related lesson: Multiple timeframe analysis
Hammer patterns on intraday futures accounts
Day traders who never hold overnight face a specific limit: a daily hammer can be context, but the trade itself has to fit inside one session. That favours intraday hammers at higher-timeframe levels, with targets close enough to be reached before the close.
On our accounts, every position must be closed by 4:45 PM ET on regular days, with no overnight or weekend holds, so a daily hammer is context and the trade happens on an intraday chart. Our 50K accounts allow up to 4 minis or 40 micros, which is why sizing a hammer trade in micros matters. WealthCharts on our accounts includes Chart Replay for practicing pattern reads on past sessions, and evaluation and funded accounts are simulated.
How Reliable Are Hammer Patterns
Hammer patterns are less reliable than most pattern guides suggest, and the honest answer depends on the market, the exit rule and trading costs. No single success rate applies everywhere. The published research does give a useful outline.
The studies that found little or nothing:
- Marshall, Young and Rose (2006) tested candlestick patterns on Dow Jones Industrial Average stocks over 1992 to 2002, using an extension of bootstrapping built for open, high, low and close prices, and could not find profits.
- Duvinage, Mazza and Petitjean (2013) tested candlestick rules on 5-minute bars of the 30 Dow stocks. Around a third of the rules beat buy and hold before costs, just a few stayed profitable after costs, and none survived a correction for data snooping.
- Tharavanij, Siraprapasiri and Rajchamaha (2017) found the mean returns of most candlestick reversal patterns on SET50 stocks were not statistically different from zero, including the green hammer-shaped paper umbrella.
The studies that found something:
- Lu and Shiu (2016) tested every possible 1-day candlestick pattern on the 30 Dow stocks from January 1974 to December 2009 and found several patterns may be profitable, with predictive power noticeably stronger from 1992 onwards.
- Lu, Shiu and Liu (2012) found three two-day bullish reversal patterns profitable on Taiwan's largest stocks from 29 October 2002 to 31 December 2008.
- Deng and co-authors (2022) tested 10 well-known patterns on Chinese SSE50 stocks from January 2000 to December 2018 and found several bullish patterns produced significant positive average returns over certain holding periods, while no bearish pattern had predictive power.
What hammer pattern research means for trading decisions
Three things follow from that research. First, the exit rule matters as much as the pattern: Lu, Chen and Hsu (2015) found that whether candlestick strategies made money depended on the holding strategy, not on how the prior trend was defined. Second, costs eat thin edges, and a hammer that is right slightly more often than not can still lose money after commissions and slippage. Third, almost all of these studies used stocks and daily bars, not intraday futures, so they tell you what to test, not what you will find.
The fair summary is that hammer and inverted hammer patterns describe something real, a rejected price, and offer a weak, inconsistent edge when traded mechanically. Location, confirmation and exits are where any edge has to come from.
Related lesson: Backtesting a trading strategy
Common Hammer Pattern Mistakes
Most hammer pattern mistakes are decision errors, not chart-reading errors. Each one has a rule that catches it.
| Hammer mistake | What is actually happening | The rule that catches it |
|---|---|---|
| Calling any long lower shadow a hammer | Without a decline before it, the shape has no reversal meaning, and after a rise it is a hanging man | Check the trend before the candle, every time |
| Buying the hammer close because the tail looks strong | The close entry has the tightest risk and the highest share of failed reversals | Pick one entry route in advance and log it |
| Treating the inverted hammer like a hammer | Buyers lost the inverted hammer session, so the case for a turn is weaker | Require a close above the upper shadow, and price that entry first |
| Placing the stop exactly at the low | Ordinary noise often retests a wick low by a tick | Put the stop beyond the low, then size from that distance |
| Keeping the same size after a wider confirmed entry | The stop distance grew, so the dollar risk grew with it | Recalculate contracts from the stop on every trade |
| Trading hammers into nearby resistance | The bounce runs straight into sellers before it can pay | Measure room to the next level before the entry |
| Judging the pattern on the last trade | One result says nothing about a rule | Review after 30 or more logged hammers on one fixed rule |
A Hammer Pattern Checklist
A hammer pattern checklist keeps the decision in the same order every time, which is where most of the protection comes from.
- Confirm a decline came before the candle. No decline, no hammer.
- Measure the body, the long shadow, the opposite shadow and the close against your written thresholds.
- Check the location: support, trendline, swing low or a higher-timeframe level.
- Set the stop beyond the candle's low before choosing an entry.
- Choose one entry route, the close, a break of the high or a confirmation close, and keep it for the whole sample.
- Measure room to the target and the break-even win rate for that route.
- Size the position from the stop distance and your fixed risk budget.
- Log the candle, the entry, the stop, the exit and the result for every instance, and review after 30 or more.
Related lesson: How to keep a trading journal
FAQ
What is a bullish hammer candle?
A bullish hammer candle is a single candle with a small body near the top of its range and a long lower shadow, usually at least twice the body, that forms after a decline. It shows sellers pushing price lower and buyers taking most of it back by the close. It is a possible reversal signal that needs confirmation.
What is the difference between a hammer and an inverted hammer?
A hammer has its long shadow below the body and closes near its high. An inverted hammer has its long shadow above the body and closes near its low. Both form after a decline and both are read as possible bullish reversals, but the inverted hammer is the weaker of the two because buyers lost that session.
Is an inverted hammer bullish or bearish?
An inverted hammer is bullish only after a decline. The same shape after a rise is a shooting star, which is bearish. The candle has no direction on its own; the trend before it decides the reading.
What is the opposite of a hanging man candle?
The hammer is the opposite of a hanging man in meaning. The two candles have the identical shape, but the hammer forms after a decline and is read as bullish, while the hanging man forms after a rise and is read as bearish. In shape, the inverted version of the hanging man is the shooting star.
What does an inverted red hammer candlestick pattern mean?
A red inverted hammer closed below its open, so buyers lifted price, failed to hold it, and finished slightly lower. After a decline it is still a possible bullish reversal, just a less convincing one than a green inverted hammer. It needs a close above its high before it means much.
What is the strongest bearish pattern?
No single bearish pattern is reliably the strongest, and rankings in pattern guides are opinions. In the SSE50 study, none of the bearish patterns tested had predictive power. Within the hammer family, the hanging man is the weaker bearish twin, because its close near the high shows buyers still won that session.
How do you confirm a hammer candle before entering?
Pick one written rule, such as a close above the hammer's high, a buy stop one tick above the high, or a higher low on the next pullback. Then price it, because every confirmation moves the entry further from the stop. In the illustrative ES example, waiting for a confirmation close raised the break-even win rate from 38.05% to 46.90%.
Which timeframe is best for hammer patterns?
No timeframe is best for everyone. Daily hammers summarise more trading and produce less noise. Lower timeframes print many hammer shapes that mean little. Many day traders mark levels on a higher timeframe and take hammer triggers on a 5 or 15-minute chart.
Hammer Pattern Trading Risk
Trading futures involves substantial risk of loss and is not suitable for everyone, and leverage means losses can exceed what you expect on a single trade. A stop order does not guarantee your exit price, and fast markets can fill far from the level you set. Every price, account figure and position size in this guide is an illustrative example, not a record of a real trade or a promise of any result. Evaluation and funded prop firm accounts are simulated, and simulated results do not represent live trading. This guide is general education, not investment advice.


