




TL;DR: Morning star and evening star patterns are three-candle reversals that need a prior trend and a third close past the first body's midpoint. The morning star is bullish after a decline; the evening star is its bearish mirror after a rise. The stop sits one tick beyond the star, so tall stars into nearby levels often fail the reward-to-risk check. Studies split, from strong S&P 500 results in 1992 to 1996 to no edge after costs elsewhere.
You see a long red candle, a tiny one under it, and then a green candle climbing hard. It looks like the bottom, and the urge is to buy before you miss it. Morning star and evening star patterns are built for exactly that moment, and they are also easy to see where they are not.
Three candles that look right on a finished chart are not the same as three candles that pass a written test, sit at a level that matters and leave room for a trade that pays.
This guide walks through how each star pattern is built, the six tests that qualify one, the psychology behind it, how it compares with other reversal candles, what the published studies found, and two illustrative futures examples priced to the tick, including one that passes every test and still is not worth taking.
What Morning Star and Evening Star Patterns Are
A morning star is a three-candle bullish reversal pattern that forms at the end of a decline. The first candle is a long bearish candle that continues the decline, the second is a small-bodied candle (the star) whose body sits below the first candle's close, and the third is a long bullish candle that closes above the midpoint of the first candle's body.
An evening star is the same structure turned upside down at the end of a rise. A long bullish candle extends the advance, a small-bodied star prints above it, and a long bearish candle closes below the midpoint of the first candle's body. That makes the evening star the direct opposite of the morning star, and TradingView's pattern library lists it as the bearish version.
Both patterns make a narrow, testable claim. The trend that was running stopped making progress for one session, and the next session handed control to the other side with enough force to retake at least half of the first candle's body. Neither pattern is a forecast of how far price will travel. Each one gives you a story about who is in control and a price that proves the story wrong, and that second part is what turns a shape into a trade you can measure.
Anatomy of a Star Pattern Candle by Candle
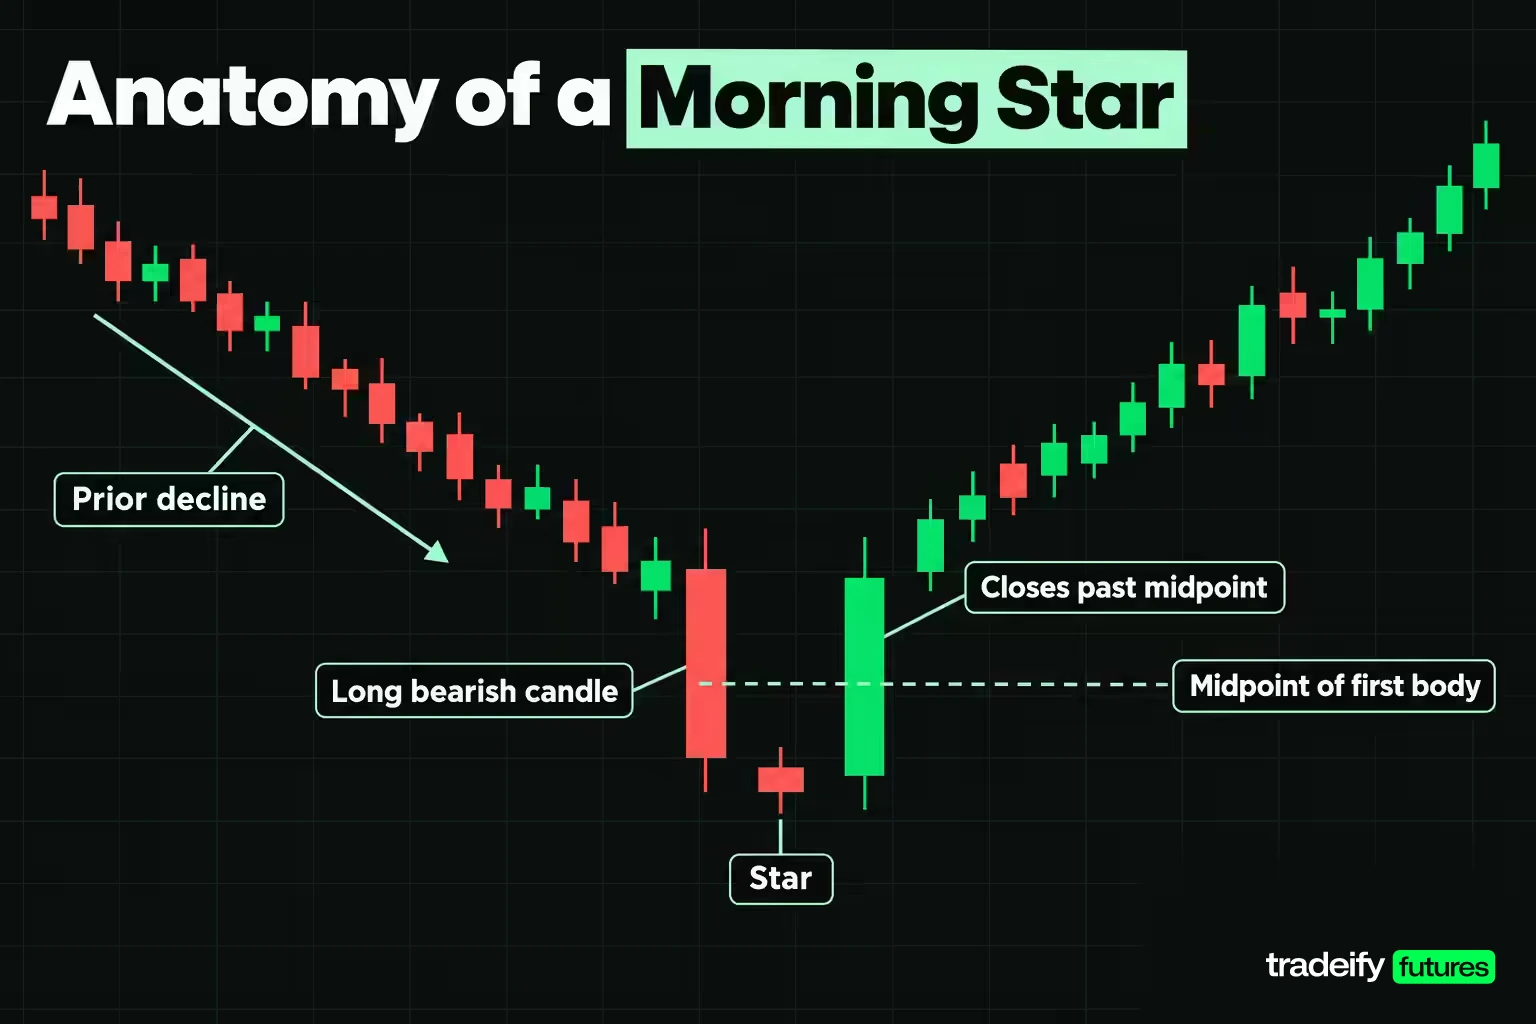
A star pattern has three parts, and each candle has its own job.
- First candle. A tall candle in the direction of the trend: bearish (black or red) in a morning star, bullish (white or green) in an evening star. Its body sets the yardstick for the other two candles.
- The star. A small body of either colour. In a morning star its body sits below the first candle's body; in an evening star it sits above. The shadows can be any length, but a narrow range says more indecision than a wide one.
- Third candle. A tall candle in the new direction that closes at least halfway into the first candle's body. This is the candle that carries the reversal claim.
The textbook version has gaps on both sides of the star. TradingView describes a middle candle that gaps down on the open and a third candle that gaps up, and Thomas Bulkowski's configuration has the star's body gapping below the first body and the last candle's body gapping above the star. The formal definition used in the academic tests is looser: the star's open and close only have to sit below the first candle's close, which is a gap between bodies rather than between full ranges.
Star Pattern Gaps and Variants
The gap question in a star pattern matters most on futures. E-mini S&P 500 futures trade on CME Globex from Sunday 6:00 PM to Friday 5:00 PM ET with a one-hour daily maintenance break, so one bar usually opens close to where the last one closed. Real body gaps are rare on intraday futures charts, and a strict gap rule would throw out almost every candidate. The workable approach is to state which version you use for each market and keep it fixed.
Two variants are worth recognising. When the star is a doji (open and close at or near the same price), the pattern is called a morning doji star or evening doji star. When the doji's shadows also gap completely clear of the shadows on both sides, the pattern is called an abandoned baby, a much rarer formation.
Related lesson: Abandoned baby candlestick pattern
Six Tests That Identify a Valid Morning Star
Identifying a morning star comes down to six tests, and any one of them can disqualify a candidate. Recognition by eye is where most bad entries start, because the chart you are looking at already shows you how the story ended.
- Trend. There must be a decline for the pattern to interrupt. Caginalp and Laurent's academic definition used a three-day moving average of closes that fell across six sessions with at most one violation. TradingView's built-in detector offers a simpler choice: price below its 50-period simple moving average counts as a downtrend. Either works. Having no rule does not.
- First candle. Long and bearish, measured against the recent candles.
- Star body. Small compared with the first candle's body. A star body under about a tenth of the first body is clean; a body that is merely smaller is the weak version.
- Star position. The star's body sits below the first candle's close (above it for an evening star).
- Third candle direction. Bullish, with a long body.
- Midpoint close. The third candle closes above the midpoint of the first candle's body. This threshold comes straight from the published definitions, and a close short of it is a failed pattern, not a matter of taste.
Running the Six Morning Star Tests on an Illustrative Chart
The six morning star tests are easiest to see on numbers. Here is an illustrative morning star on 15-minute Micro E-mini S&P 500 (MES) bars, built from round prices to show the measurements.
| Test | What it measures | Threshold | Illustrative MES formation | Verdict |
|---|---|---|---|---|
| Trend | A decline for the pattern to interrupt | Price below a declining average or a written trend rule | Sell-off from a 7,750.00 swing high into the pattern | Pass |
| First candle | Long bearish body | Tall against recent bars | Open 7,724.00, close 7,706.00, body 18.00 points | Pass |
| Star body | Star body against the first body | Under about one tenth of the first body | Body 1.00 point, which is 5.56% of the first body | Pass |
| Star position | Star body below the first close | Open and close both under 7,706.00 | Open 7,705.00, close 7,704.00 | Pass |
| Third candle | Long bullish body | Clearly bullish, not a small candle | Open 7,705.50, close 7,718.50, body 13.00 points | Pass |
| Midpoint close | Close past half of the first body | Above 7,715.00 | Close 7,718.50, recovering 69.44% of the first body | Pass |
Now change one number. If the third candle in this illustrative MES morning star had closed at 7,712.00 instead of 7,718.50, it would recover only 33.33% of the first body. The shape would still look like a morning star on a zoomed-out chart, but it fails the midpoint test, and the reversal claim fails with it.
What Buyers and Sellers Do in Each of the Three Candles
The psychology of a morning star runs across three sessions, and each session tells you something different about who is in control.
Session one: sellers in charge. The long bearish candle is the decline doing what it has been doing. Sellers press, buyers step aside, and price closes near the low. Nothing about this candle suggests a turn. If anything it tempts late sellers to join.
Session two: the stall. The star opens below the prior close and then goes nowhere. Sellers could not extend the move, and buyers were not yet strong enough to take it back. Caginalp and Laurent describe the small body as the beginning of market indecision, a sign that supply and demand have become more balanced. A stall is not a reversal. Plenty of declines pause for a bar and then keep going.
Session three: the handover. The long bullish candle is where the claim is made. Buyers retake more than half of the first candle's body, which means many of the traders who sold during session one are now holding losing shorts. Their buying to cover can add fuel. That is the logic behind the midpoint test: a third candle that only recovers a quarter of the first body has not shown a handover, just a bounce.
The evening star runs the same script in reverse. Buyers push in session one, stall in session two, and sellers take back more than half of the advance in session three, leaving late buyers trapped above.
Here is where traders usually get caught: they act on session two. The star looks like the turn, so they buy the stall before the third candle has proven anything. The pattern exists precisely because the stall alone is not enough.
Morning Star vs Evening Star
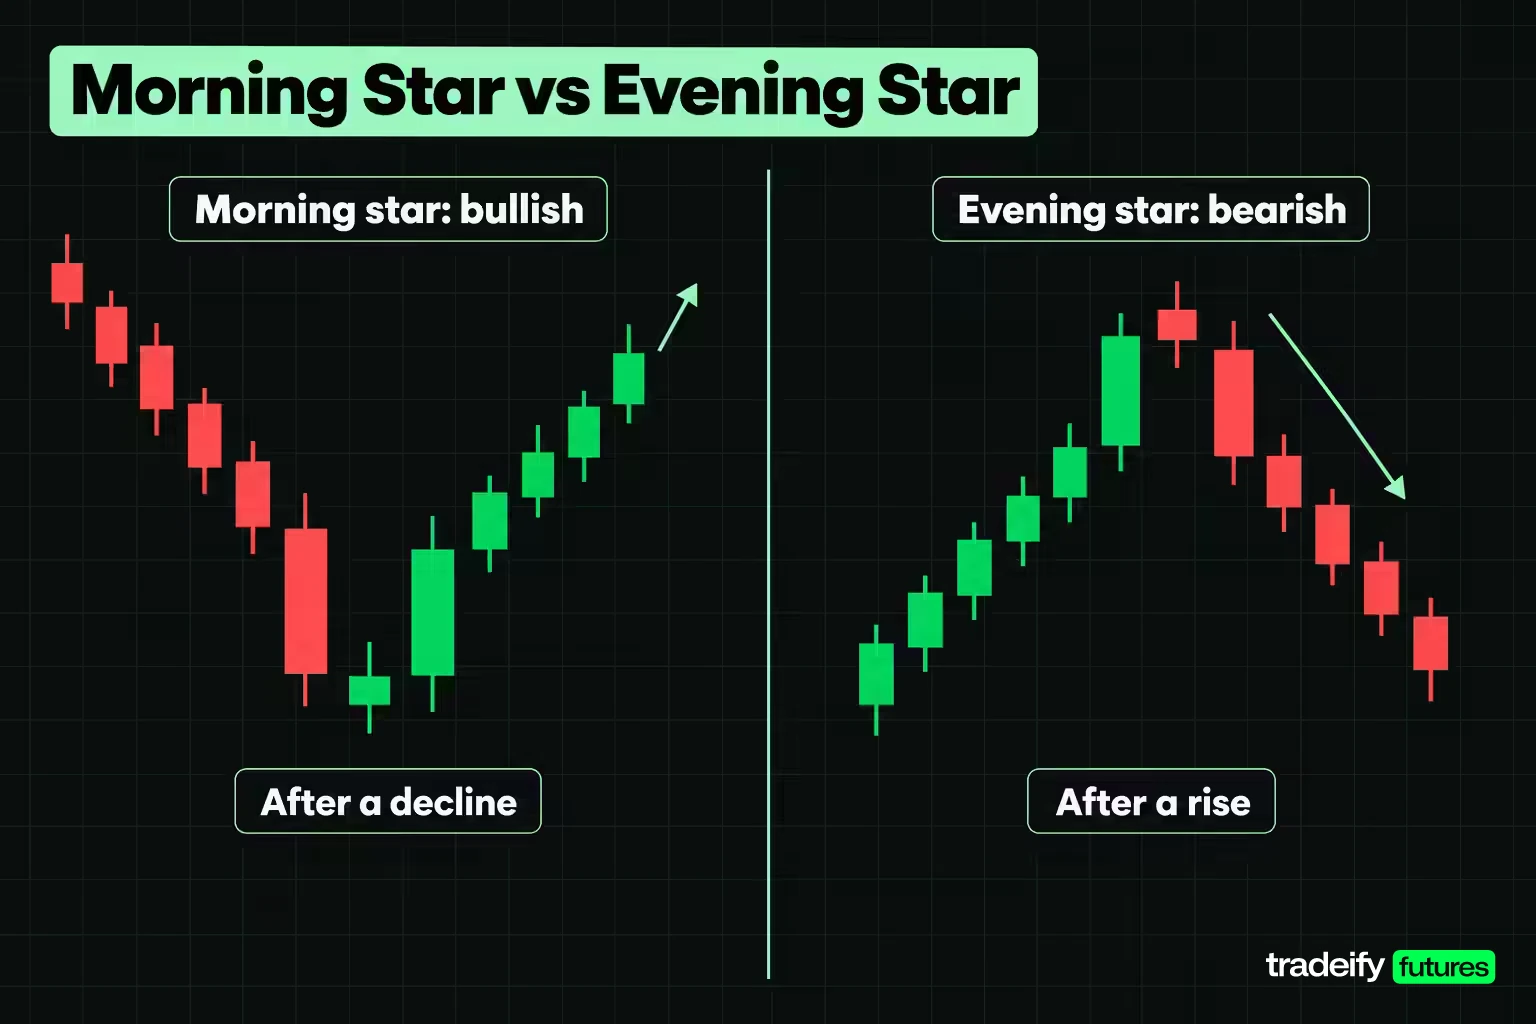
The morning star and evening star are the same structure pointed in opposite directions, and the practical differences are all about where the trade lives.
| Element | Morning star | Evening star |
|---|---|---|
| Prior trend | A decline into the pattern | A rise into the pattern |
| First candle | Long bearish body | Long bullish body |
| Star candle | Small body of either colour below the first close | Small body of either colour above the first close |
| Third candle | Long bullish body | Long bearish body |
| Midpoint test | Closes above the midpoint of the first body | Closes below the midpoint of the first body |
| Invalidation level | One tick below the star's low | One tick above the star's high |
| First target reference | The prior swing high | The prior swing low |
| Implied trade | Long | Short |
The two patterns are mirrors in geometry, but not in evidence. Several studies find bullish candlestick patterns doing better than bearish ones. Deng and co-authors tested 10 patterns on Chinese SSE50 stocks from January 2000 to December 2018 and found several bullish patterns with significant positive average returns, while none of the bearish patterns examined had predictive power. Lu, Shiu and Liu found three bullish reversal patterns profitable on Taiwan stocks but not the bearish ones.
The star patterns themselves do not follow that rule neatly. In Caginalp and Laurent's smaller data set of 54 world equity closed-end funds from April 1992 to June 1996, the average close over the next three days moved in the predicted direction after 23 of 41 morning stars (56.09%) against a 44.73% baseline for all downtrend days, and after 103 of 146 evening stars (70.54%) against a 56.07% baseline. Bulkowski's own tests put the morning star's reversal rate at 78% and the evening star's at 72%. The honest takeaway is that direction alone does not tell you which side has the edge, so test each side separately.
Star Patterns Compared With Doji, Engulfing, Harami and Piercing Candles
Star patterns are easiest to identify correctly when you know the patterns they get confused with. Most of those are one- and two-candle reversals, and the star pattern is often described as one of them plus an extra candle of confirmation.
| Pattern | Candles | How it differs from a star pattern |
|---|---|---|
| Doji | One | A single indecision candle; a doji can be the middle of a star but proves nothing alone |
| Hammer or shooting star | One | One candle with a long rejection shadow, no follow-through candle |
| Bullish or bearish engulfing | Two | The second body swallows the first; no stall candle in between |
| Bullish or bearish harami | Two | A small second body inside the first body; a harami plus a strong third candle resembles a star |
| Piercing line or dark cloud cover | Two | The second candle closes past the first body's midpoint with no star between them |
| Abandoned baby | Three | A doji star whose shadows fully gap clear of both neighbours |
The piercing line is the closest relative. Its second candle has to close above the midpoint of the first candle's body, the same threshold the morning star applies to its third candle. The star simply inserts a stall session between the two, which is why the published research describes three-day patterns as an extension of two-day patterns with an extra day for confirmation.
How many candlestick patterns are there? There is no fixed count. Bulkowski's Encyclopedia of Candlestick Charts covers 103 patterns, and TradingView's screener lists 44. Of those 44, TradingView labels 12 as strong signals, including the Morning Star and Evening Star, while it labels the Morning Doji Star and Evening Doji Star as medium. Those labels are TradingView's internal categorisation, not a measured ranking, and TradingView itself says patterns should not be used in isolation.
Related lesson: Engulfing candlestick patterns
Confirming a Star Pattern With Levels, Volume and Indicators
A star pattern confirmation is anything that adds information the three candles do not already contain. Some filters do that. Others just repeat the pattern in a different form.
- Location. A morning star at a level other traders already watch (a prior swing low, a daily open, a high-volume price area) makes its claim where it can be tested. A star in the middle of nowhere has no obvious reason to hold.
- Follow-through. The common confirmations are a close above the third candle's high on the next bar, a higher low on the following session, or a break of the trendline drawn through the decline. For an evening star, the mirror is a close below the third candle's low.
- Larger trend. Bulkowski reports that the morning star performs best when it appears in a downward retrace of a primary uptrend, and the evening star in an upward retracement of a primary downtrend. In plain terms, a star that turns price back toward the larger trend is a cleaner setup than one that tries to reverse it.
- Volume. Many traders want the third candle to print above-average volume. Treat that as a filter to test on your own sample, because none of the studies covered here isolates volume as the deciding variable.
- Oscillators and averages. RSI, stochastics and moving averages are popular filters. Tharavanij and co-authors tested stochastics, RSI and the Money Flow Index as filters on Thai SET50 stocks and found that filtering generally did not increase profitability or prediction accuracy.
- Fibonacci levels. A star at a retracement level is a location filter like any other. Its value depends on whether you would have drawn the same level before the pattern formed.
Each confirmation costs entry price, because waiting for proof means paying a higher price for a long or accepting a lower price for a short. That cost belongs in the plan, not in the moment.
Related lesson: Support and resistance
Trading Strategies for Morning Star and Evening Star Patterns
Trading strategies for morning star and evening star patterns fall into three broad approaches, and each one answers the question of why the reversal should happen here.
Trade the star at a level. Mark the levels before the session starts. Only take a morning star whose star candle trades into a marked support level, or an evening star into marked resistance. The pattern becomes the timing tool, and the level becomes the reason. This cuts the number of trades a great deal, which is the point.
Trade the star as a pullback within a larger trend. If the higher timeframe is rising, a morning star at the end of a short pullback signals the pullback may be done. This follows Bulkowski's finding that stars perform best inside a retrace of the primary trend. The trade joins the larger move instead of fighting it.
Use a higher-timeframe star as a bias. A morning star on the daily or hourly chart sets a directional bias, and entries come from a lower timeframe, such as a break of a 5-minute high after a pullback toward the star's third candle. This often allows a tighter stop than the full pattern's low, at the cost of more missed trades and more small losses.
Whichever approach you choose, keep it for the whole sample. Switching approaches after every loss feels like adapting, but it leaves you with three half-tested methods and no idea which one works.
Bulkowski also notes that the trend after a morning star breakout can take a while to get going, and he uses the word patience. If your exit rule cuts every trade after a few bars, you may be exiting the version of the trade that the pattern's best results come from.
Related lesson: Multiple timeframe analysis
Entry, Stop and Target Rules for a Morning Star
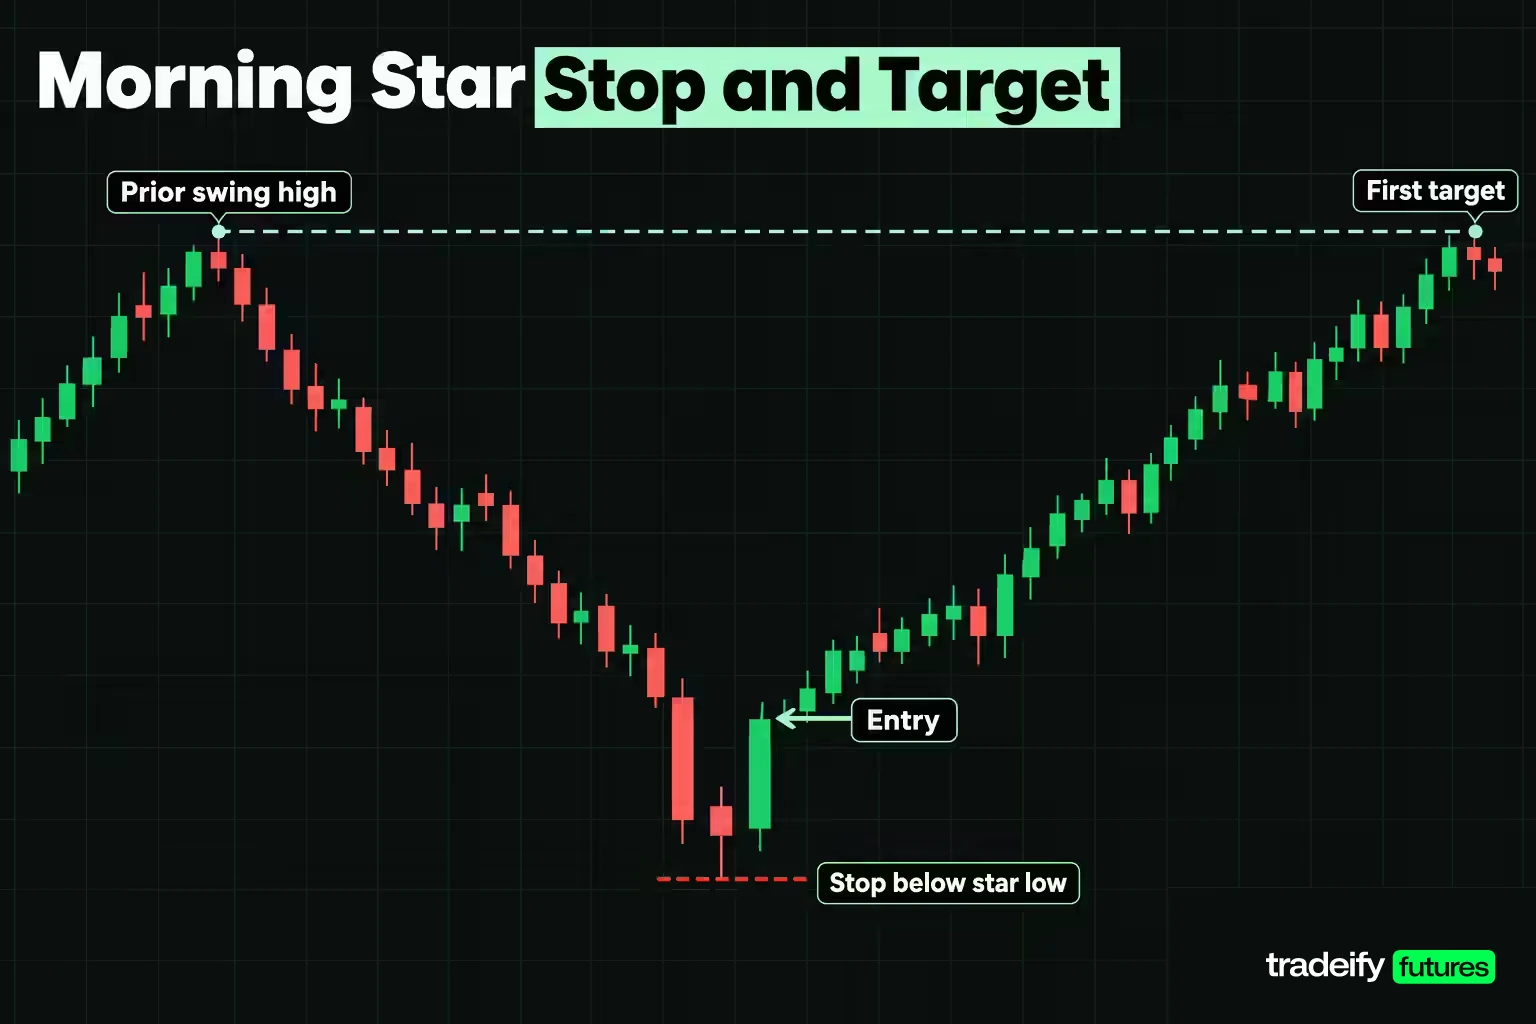
Entry, stop and target rules for a morning star start with the stop, not the entry. Using the illustrative MES formation (first candle 7,724.00 to 7,706.00, star low 7,698.00, third candle close 7,718.50), the levels fall out of the structure.
- Stop. If buyers really took control, price should not trade back below the star's low. The stop goes one tick under it at 7,697.75. MES ticks are 0.25 index points worth $1.25, and each full point is worth $5.
- Target. The first reference is the prior swing high at 7,750.00, where the decline started.
- Stop to target. 52.25 points, whatever the entry. Every entry choice divides that same distance into risk and reward.
Comparing Three Morning Star Entries
Three common morning star entries, priced against the same 7,697.75 stop and 7,750.00 target on the illustrative MES formation, produce three different trades.
| Entry route | Entry price | Risk in points and ticks | Risk per MES | Risk per ES | Reward to risk | Break-even win rate |
|---|---|---|---|---|---|---|
| Third candle close | 7,718.50 | 20.75 points, 83 ticks | $103.75 | $1,037.50 | 1.52 to 1 | 39.71% |
| One tick above the third candle high | 7,719.50 | 21.75 points, 87 ticks | $108.75 | $1,087.50 | 1.40 to 1 | 41.63% |
| Pullback to the first body midpoint | 7,715.00 | 17.25 points, 69 ticks | $86.25 | $862.50 | 2.03 to 1 | 33.01% |
Entering at the close gives the earliest fill and no extra proof. Waiting for a break of the third candle's high costs one more point of risk and raises the break-even win rate to 41.63%, in exchange for seeing buyers push past the pattern. The pullback entry has the best numbers on paper, but it only fills if price gives back 3.50 points from the close, and the strongest reversals often never come back. A lower break-even rate on a trade that fills half as often is not automatically cheaper. Proof costs you price, and patience costs you fills; pick which cost you would rather pay before the pattern forms.
The break-even rate here is simply risk divided by the full stop-to-target distance, before commissions and slippage. It tells you how often the trade has to reach the target to break even, which is the question to answer before you take it.
Related lesson: Risk reward ratio
An Evening Star Example on Micro Nasdaq Futures
An evening star example shows a different lesson: a pattern can pass every test and still be a trade to skip. These are illustrative 15-minute bars on Micro E-mini Nasdaq-100 futures (MNQ), where each index point is worth $2 and the minimum tick of 0.25 points is worth $0.50.
- First candle. Opens 25,000.00, closes 25,060.00, a bullish body of 60.00 points after a steady climb.
- The star. Opens 25,064.00, closes 25,066.00, a body of 2.00 points, which is 3.33% of the first body. Its body sits above the first close, and its high is 25,078.00.
- Third candle. Opens 25,062.00, closes 25,020.00, a bearish body of 42.00 points. The first body's midpoint is 25,030.00, so the close penetrates 66.67% of the first body.
That is a clean evening star. Now price the trade. The stop goes one tick above the star's high at 25,078.25. The nearest support is the prior swing low at 24,960.00.
| Evening star entry | Entry price | Risk in points and ticks | Risk per MNQ | Reward per MNQ | Reward to risk | Break-even win rate |
|---|---|---|---|---|---|---|
| Third candle close | 25,020.00 | 58.25 points, 233 ticks | $116.50 | $120.00 | 1.03 to 1 | 49.26% |
| One tick below the third candle low | 25,017.75 | 60.50 points, 242 ticks | $121.00 | $115.50 | 0.95 to 1 | 51.16% |
The pattern is 82.00 points tall from its low to the star's high, and the support is only 60.00 points away from the close. That leaves a trade that pays roughly one to one and needs to win about half the time just to break even, before costs. The confirmation entry is worse still, risking more than it can make.
If the nearest support were at 24,900.00 instead, the close entry would pay 2.06 to 1 with a 32.68% break-even rate. But you do not get to move the target to make the numbers work. The level is where it is. A tall pattern into nearby support is a pass, and passing is a decision, not a missed opportunity.
Position Sizing and Risk for Three-Candle Reversals
Position sizing for a three-candle reversal follows from the stop distance, and three-candle patterns tend to have wide stops because the stop sits beyond the star, which is often the extreme of the whole move.
Take an illustrative $50,000 account risking 0.5% per trade, a budget of $250. On the MES morning star:
| Entry route | Risk per MES | Contracts at a $250 budget | Dollars at risk | Share of the account |
|---|---|---|---|---|
| Third candle close | $103.75 | 2 | $207.50 | 0.42% |
| One tick above the third candle high | $108.75 | 2 | $217.50 | 0.44% |
| Pullback to the first body midpoint | $86.25 | 2 | $172.50 | 0.35% |
One E-mini S&P 500 contract on the close entry would risk $1,037.50, more than four times the budget, so the same pattern that fits as two micros does not fit as one mini at all. That is the practical reason micro contracts exist: one MES is one tenth of one ES, which lets the size match the stop instead of forcing the stop to match the size.
On the MNQ evening star, the same $250 budget buys 2 contracts at $116.50 each, or $233.00 at risk, for a trade that pays about one to one. The size is acceptable. The trade is not. Sizing tells you how much you can lose; it does not tell you whether the trade is worth taking.
Three habits keep star-pattern risk under control:
- Set the stop beyond the structure first, then size down to fit it. Never tighten the stop to fit a size you already wanted.
- Skip patterns whose stop distance is larger than the room to the first target.
- Round size down, never up. The leftover budget is the price of a clean rule.
Related lesson: Position sizing
How Reliable Star Patterns Are in Published Tests
The published record on star pattern reliability is split, and the split mostly follows the exit rule, the market and the costs rather than the shape.
The strongest positive result. Caginalp and Laurent tested eight three-day reversal patterns, the morning star and evening star among them, on daily data for S&P 500 stocks from 1992 to 1996. Out-of-sample, the four bullish patterns pooled showed significance at 36 standard deviations from the null hypothesis and a profit of almost 1% over a two-day holding period, with the four bearish patterns at 26.7 standard deviations. Their exit sold one third of the position on each of the three days after the signal. The paper is candid about the morning star itself, noting it had somewhat less predictive power than some other bullish patterns because its new uptrend is established for only one day.
The reconciliation. Lu, Chen and Hsu retested candlestick strategies on Dow Jones Industrial Average component stocks and found that eight three-day reversal patterns were profitable with the Caginalp and Laurent holding strategy, at 0.5% transaction costs and after a data-snooping adjustment. With a fixed-date exit, the same patterns were not profitable. The exit rule decided the result.
Studies That Found No Edge in Star Patterns
Several studies found no tradable edge in candlestick rules once costs and data snooping were accounted for. Marshall, Young and Rose found no profits from candlestick patterns on Dow stocks over 1992 to 2002 using a bootstrap method. Duvinage, Mazza and Petitjean went to 5-minute data on the 30 Dow stocks and found that around a third of candlestick rules beat buy-and-hold at a conservative significance level, but only a few stayed profitable after costs, and after a data-snooping correction no single rule beat buy-and-hold after costs.
The star patterns on their own. Tharavanij and co-authors tested both stars on Thai SET50 stocks from July 3, 2006 to June 30, 2016, buying at the next day's open with fixed exits. The morning star produced 200 signals with negative average returns at every holding period (-0.46% after 1 day, -0.69% after 3 days, -0.70% after 5 days and -1.11% after 10 days), and the share of winning trades ran from 37% to 50%. The evening star produced 209 signals with small, statistically insignificant returns and a 47% winning share for a short at every horizon.
The practitioner numbers. Bulkowski's site reports that the morning star acts as a bullish reversal 78% of the time and the evening star as a bearish reversal 72% of the time, with overall performance ranks of 12 and 4 out of 103 patterns. Those are reversal rates inside his own definitions and samples, described as based on hundreds of perfect trades, without a cost model. They are not a win rate for a trading rule.
Put together: almost every study tests a mechanical rule that enters at the pattern and exits on a timer, which is not the confirmation-based, level-filtered version most traders actually use. The only reliability number that applies to your version is the one in your own log.
Related lesson: How to keep a trading journal
Common Failure Modes in Three-Candle Reversals
Failed three-candle reversals usually come from decision errors, and each one has a rule that catches it.
| What it looks like | What is actually happening | The rule that catches it |
|---|---|---|
| Three candles turned up, so the low is in | Without a decline into it, the shape carries no reversal claim | Define the prior trend with a written rule before scanning |
| The third candle is green, so I am buying | The bar has not closed, so the midpoint test has not been passed | Wait for the close; a close at 7,712.00 recovers only 33.33% |
| The star looked like the bottom | A stall is not a handover; many declines pause and continue | Never act on the star candle alone |
| It passed all six tests, so I took it | Qualification says nothing about room to the target | Price the stop and target before entering; skip trades near one to one |
| The pattern failed, so it does not work | One trade is not evidence either way | Judge the rule over 30 or more logged instances |
| My stop was hit by a tick, then price ran | The stop sat at the exact star low or a round number | Place the stop beyond the structure, then size down |
| No gap, so it does not count | Strict gap rules come from daily stock data | State the gap rule per market and keep it fixed |
The one failure mode no table fixes is the trend that simply keeps going. A morning star in a strong downtrend is often just a pause. That is why location and the larger trend matter more than how textbook the three candles look.
Related lesson: Market structure
Gaps, Sessions and Timeframes for Star Patterns on Futures
Star patterns behave differently on futures than in the stock charts most textbooks use. Stock markets close overnight, so daily candles often open away from the prior close and true body gaps are common. Index futures trade nearly around the clock, from Sunday 6:00 PM to Friday 5:00 PM ET with a one-hour daily break, so gaps between bars are small on daily charts and rare on intraday charts.
That has three practical consequences:
- Use the body rule, not the gap rule. On futures, require the star's body to sit beyond the first candle's close, as the academic definition does, rather than demanding a visible gap.
- Choose the bar that matches your holding period. A daily-chart star implies a trade measured in days. If you only hold within one session, a 15-minute or hourly star matches the trade you can actually take, and the daily star becomes a bias rather than an entry.
- Expect more candidates and lower quality. Lower timeframes produce far more three-candle sequences, and many are noise. Tighter thresholds and a level filter matter more there.
On our accounts, every position is closed by 4:45 PM ET and nothing is held overnight or over a weekend, so a daily-chart star is a bias for the next session rather than a multi-day hold. Size is set by contract limits (a 50K account allows 4 minis or 40 micros, with 10 micros counting as one mini), and WealthCharts' Chart Replay is a practical way to log star patterns on historical bars before you risk anything on them.
Checklist for Qualifying and Pricing a Three-Candle Reversal
A three-candle reversal checklist only works if you run it the same way every time.
- Define the prior trend with a written rule before you scan for anything.
- Record the six prices that matter: the first candle's open and close, the star's body and extremes, and the third candle's open and close.
- Run the six tests against written thresholds, not against how the formation looks.
- Mark the invalidation level first, one tick beyond the star, and the first structural target second.
- Price the trade. If the stop distance is bigger than the room to the target, skip it.
- Choose one entry route (close, confirmation or pullback) and keep it for the whole sample.
- Size down to fit the stop, never the other way round.
- Log the entry, stop, size, exit and outcome for every instance, and review the rule after 30 or more trades rather than after the last one.
A good first step is the market you trade most. Scan a few months of its bars, count how many candidates pass all six tests, and price each one before you look at what happened next. The count alone usually changes how often you think this pattern shows up.
Morning Star and Evening Star FAQ
What is the morning star pattern in candlestick trading?
A morning star is a three-candle bullish reversal pattern at the end of a decline. It starts with a long bearish candle, then a small-bodied star below it, then a long bullish candle that closes above the midpoint of the first candle's body.
What is the opposite of evening star?
The morning star is the opposite of the evening star. The evening star is a bearish reversal after a rise, while the morning star is the bullish version after a decline, built from the same three candles in mirror image.
What is the most powerful candle in trading?
No single candle is reliably the most powerful. TradingView's screener labels a group of multi-candle patterns, including the morning star and evening star, as strong, but that is an internal label. Published tests show results depend more on the market, the exit rule and costs than on the shape.
How many candlestick patterns are there?
There is no fixed number. Bulkowski's encyclopedia covers 103 candlestick patterns, while TradingView's screener lists 44. Most traders work with a handful of one-, two- and three-candle reversals.
Is the morning star bullish or bearish?
The morning star is bullish, but only after a decline. The same three-candle shape in the middle of a rise is not a bullish reversal signal, because the pattern's meaning comes from the trend it interrupts.
Does the middle candle have to be a doji?
No. A doji in the middle makes it a morning doji star or evening doji star, which TradingView describes as more bullish (or bearish), yet Bulkowski's tests show the morning doji star reversing 76% of the time against 78% for the plain morning star. The third candle's close matters more than the star's exact shape.
How do you trade a morning star pattern?
Wait for the third candle to close above the first body's midpoint, then set the stop one tick under the star's low and the target at the prior swing high. Enter at the close, on a break of the third candle's high, or on a pullback, and size the position to the stop. Skip the trade if the stop is wider than the room to the target.
Which timeframe is best for star patterns?
No timeframe is best for every trader. Daily star patterns summarise more trading and produce fewer false candidates, while 5 and 15-minute charts produce many more three-candle sequences that are noise. Match the bar to how long you actually hold a trade.
Can a morning star form without a gap?
Yes, especially on futures and other nearly continuous markets. The academic definition only requires the star's body to sit below the first candle's close. Pick the gap rule you will use for each market and keep it fixed.
Star Pattern Trading Risk
This article is general education about how candlestick reversal patterns are read and how the risk around them is calculated, not investment advice or a recommendation to trade any product. Futures are leveraged, losses can exceed what you expect, and a stop order does not guarantee your exit price when the market moves fast. All prices, accounts and position sizes here are illustrative. Evaluation and funded accounts are simulated, and simulated results do not represent results in a live account.


