



TL;DR: Donchian channels plot the highest high and lowest low of the last N bars, so the real question is whether a break past them means anything. On a year of E-mini S&P 500 and Nasdaq-100 futures, 20 session breaks often failed to hold the close. Ten-session follow-through trailed random entries on both contracts. Use the channel as a measured reference and trailing stop, and test your own lookback before you trust a breakout.
Donchian channels are about the simplest indicator on any charting menu. Two lines mark the highest high and lowest low of a lookback window, and a third line splits the difference. There is no smoothing, no weighting and no standard deviation to argue about.
That simplicity is exactly why traders over-trust them. A candle pokes through the upper band, it feels like strength, and the buy button gets pressed before anyone asks whether that kind of break usually holds. A new 20 session high is a fact. Whether it is a reason to buy is a separate question, and it is the one this guide tests on a full year of real futures data.
What Donchian Channels Are and How They Work
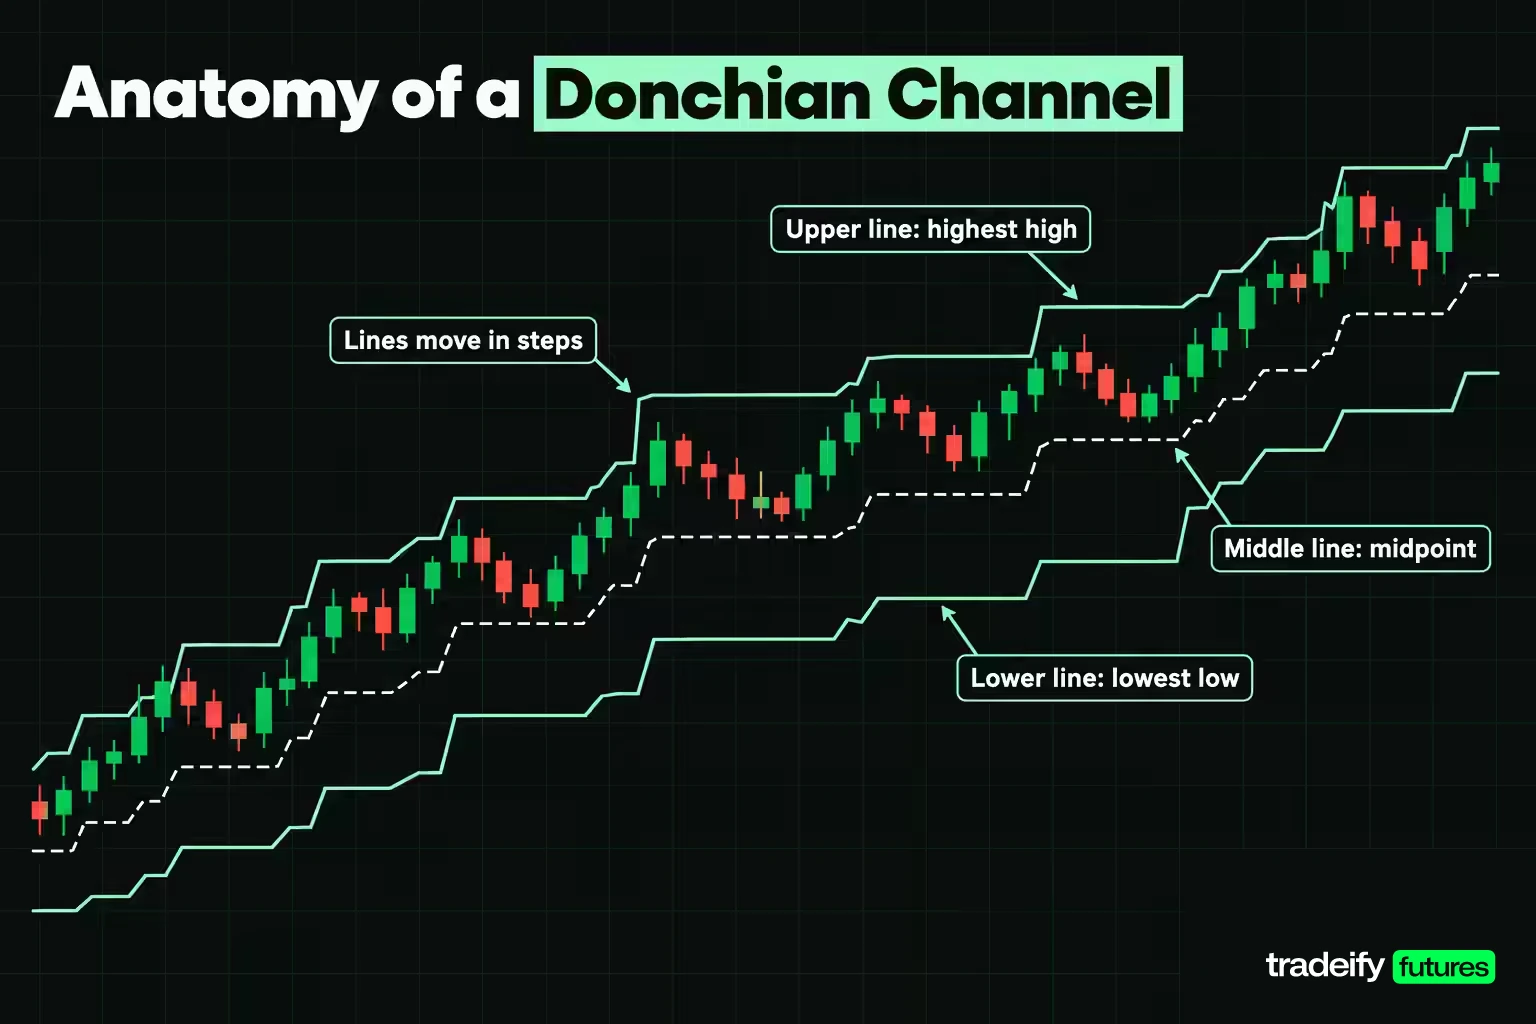
Donchian channels are a price channel built from a running maximum and a running minimum. The upper line is the highest high of the last N bars, the lower line is the lowest low of the last N bars, and the middle line is the average of the two. N is the only setting, and 20 is the common default.
The indicator carries the name of Richard Donchian, who started Futures, Inc. in 1949, often described as the first publicly managed futures fund. He spent decades building rule-based trend methods and wrote the Commodity Trend Timing newsletter for 19 years, which is why he is often called the father of trend following. The best-known descendant of his breakout idea is the Turtle trading system, which entered on 20-day and 55-day channel breaks.
Three behaviors make Donchian channels different from the bands that sit next to them on a platform menu:
- The lines are real prices. The upper line is a high that actually traded, so a break above it is a new extreme for the window, not a statistical estimate.
- The lines move in steps. A line changes only when a new extreme enters the window or an old one drops out of it, so long flat stretches are normal.
- The middle line is not a moving average. It is the midpoint of the range, so one spike high can drag it up for N bars and then release it all at once.
Bollinger Bands and Keltner Channels are built around an average and widen or narrow with recent volatility. Donchian channels track the extremes themselves. Both views have uses, but they answer different questions: "how far is price from its average?" versus "has price left the range it set?"
Related lesson: Support and resistance
The Donchian Channel Formula
The Donchian channel formula has three parts. For a lookback of N bars:
- Upper line = highest high of the last N bars
- Lower line = lowest low of the last N bars
- Middle line = (upper line + lower line) / 2
Channel width is the upper line minus the lower line. Dividing the width by the close turns it into a percentage, which lets you compare channels across instruments and over time.
One convention decides whether the Donchian channel can ever produce a breakout: whether the current bar is inside the window. If today's bar is included, the upper line is always at least as high as today's high, so the close can never finish above it. A breakout test needs the prior N completed bars. NinjaTrader's documentation says this directly for its DonchianChannel method, noting that a value read with a barsAgo of 0 includes the current bar and that a break check should compare today's high with the previous bar's channel value. Every number in this guide uses the prior N completed bars.
Worked Donchian Channel Example on ES
The table below shows ten completed E-mini S&P 500 sessions, using the continuous front-month daily series from Yahoo Finance. Each row's upper and lower lines come from the 20 sessions before that row, so the row's own high and low are not part of its channel. The prices are historical and are shown as an illustration, not as a trade record.
| Session | High | Low | Close | Upper line | Lower line | Middle line | Width |
|---|---|---|---|---|---|---|---|
| 2026-10-21 | 7812.25 | 7751.00 | 7800.25 | 7897.50 | 7672.75 | 7785.13 | 224.75 |
| 2026-10-22 | 7798.75 | 7676.75 | 7704.50 | 7897.50 | 7672.75 | 7785.13 | 224.75 |
| 2026-10-23 | 7714.25 | 7648.50 | 7659.75 | 7897.50 | 7672.75 | 7785.13 | 224.75 |
| 2026-10-26 | 7739.50 | 7651.75 | 7714.50 | 7897.50 | 7648.50 | 7773.00 | 249.00 |
| 2026-10-27 | 7772.75 | 7699.75 | 7758.25 | 7897.50 | 7648.50 | 7773.00 | 249.00 |
| 2026-10-28 | 7819.50 | 7750.25 | 7783.25 | 7897.50 | 7648.50 | 7773.00 | 249.00 |
| 2026-10-29 | 7773.75 | 7709.50 | 7754.25 | 7897.50 | 7648.50 | 7773.00 | 249.00 |
| 2026-10-30 | 7713.00 | 7558.25 | 7614.00 | 7897.50 | 7648.50 | 7773.00 | 249.00 |
| 2026-11-02 | 7693.75 | 7570.75 | 7574.50 | 7897.50 | 7558.25 | 7727.88 | 339.25 |
| 2026-11-03 | 7623.75 | 7546.00 | 7596.75 | 7897.50 | 7558.25 | 7727.88 | 339.25 |
Reading the Last Row of the Donchian Channel Example
Take the November 3, 2026 ES session and apply the Donchian channel formula to it. The highest high of the 20 sessions before November 3 was 7897.50, set on October 6. The lowest low was 7558.25, set on October 30. The middle line is (7897.50 + 7558.25) / 2 = 7727.88 rounded, and the width is 339.25 points.
The October 23, 2026 ES session shows a close beyond the channel. The low of 7648.50 broke the 7672.75 lower line, and the close of 7659.75 finished 13.00 points below it. On October 30 the same thing happened with more force: the close of 7614.00 finished 34.50 points below a 7648.50 lower line.
November 3 shows the other kind of break. The low of 7546.00 traded 12.25 points under the 7558.25 lower line, but the close of 7596.75 finished back inside, 38.50 points above it. On a chart both sessions show a candle poking through the lower band. Only one of them closed beyond it.
Why a Donchian Channel Line Drops While Price Rises
In the ES example from October 21 to November 3, 2026, the 20 session upper line never moved off 7897.50, even as ES fell more than 300 points from that high. That is not a bug. No new 20 session high was set, and the October 6 high stayed inside the window the whole time.
The reverse surprise comes when an old extreme leaves the window. For the November 4 session, the October 6 high of 7897.50 drops out of the 20 session window and the upper line falls 10.50 points to 7887.00, the October 12 high, without price doing anything. The channel is not forecasting a reversal. It is forgetting a high. If you trail a stop or set an alert off the line, those step changes move your level whether or not the market moves.
How to Read Donchian Channel Signals on a Chart
Reading Donchian channels comes down to four things: where price sits inside the range, whether a break was intrabar or on the close, which way the lines are stepping, and how wide the channel is.
Position inside the channel. A close near the upper line means price is finishing near the top of its N-bar range. A close near the lower line means the opposite. The middle line splits the range in half, so closes above it and below it are a quick read on which half of the range the market is using.
Touch, pierce or close. A touch means price reached the line. A pierce means price traded beyond it during the bar. A close beyond means the bar finished outside the prior range. These are three different events. On November 3, 2026, ES traded 12.25 points below its 20 session lower line and still closed 38.50 points back inside it: a pierce, not a close beyond.
Line direction. A rising lower line and a rising upper line together describe a market setting higher lows and higher highs over the window. A flat upper line with a falling lower line describes a market that has stopped making highs and is expanding its range downward, as ES did in late October.
Width. A wide channel means the extremes are far apart, which usually goes with bigger daily ranges. A narrow channel means the market has been compressing. Width describes what already happened. Whether a narrow channel forecasts a bigger move is a separate claim, and one worth testing on your own market before you rely on it.
TradingView's help page makes a useful point about context: in a clearly defined trend, repeated pushes into the outer band can be a sign of strength rather than a reversal warning. That is a reason not to read a touch of the upper line as "overbought" by default. The trend decides how a touch should be read.
Choosing the Lookback Period and Settings
The lookback period controls how often the close lands outside the Donchian channel, and that frequency is the practical thing you are choosing. Shorter lookbacks track recent bars closely and produce more breaks. Longer lookbacks hold old extremes and produce fewer breaks.
Here is how often the close finished beyond the channel over 252 completed sessions, November 3, 2025 to November 3, 2026, on the E-mini S&P 500 (ES) and E-mini Nasdaq-100 (NQ) daily series.
| Lookback | ES closes above | ES closes below | ES share outside | ES mean width | NQ share outside | NQ mean width |
|---|---|---|---|---|---|---|
| 10 sessions | 28 | 18 | 18.25% | 3.85% | 20.63% | 6.04% |
| 20 sessions | 26 | 9 | 13.89% | 5.37% | 16.27% | 8.44% |
| 55 sessions | 20 | 2 | 8.73% | 8.58% | 11.51% | 13.56% |
On ES, a 20 session channel put the close outside on 35 of 252 sessions, about one session in seven. A 10 session channel did it on 46, and a 55 session channel on 22, about one in eleven. NQ closed beyond its channel more often at every length in this sample, even though its channel was wider in percentage terms.
The lopsided above and below counts are a reminder of what kind of year this was. ES closed above its 55 session high 20 times and below its 55 session low only twice. A sample from a strong uptrend will always show more upside breaks, so the same settings on a different year can look very different.
Changing the lookback also changes which sessions count as breakouts. Moving from 20 to 55 sessions changed the classification of the close on 13 of 252 ES sessions and 12 of 252 NQ sessions.
Practical Rules for Choosing a Donchian Channel Setting
Three rules keep a Donchian channel setting honest:
- Pick the lookback from the signal frequency you want to review, not from habit. In the Yahoo Finance sample, a 20 period channel that was closed beyond about one session in seven on ES was closed beyond about one in six on NQ.
- Keep the timeframe and lookback together. A 20 bar channel on a 5-minute chart and a 20 bar channel on a daily chart are different tools.
- Check your data. Continuous futures series that are not back-adjusted jump at each contract roll. On November 3, 2026, the December 2026 ES settled at 7596.75 and the March 2027 contract at 7670.00, a gap of 73.25 points. A roll that size can create a false new high on a continuous chart, so test on the contract you trade or on back-adjusted data.
Donchian Channel Breakout Entry Rules
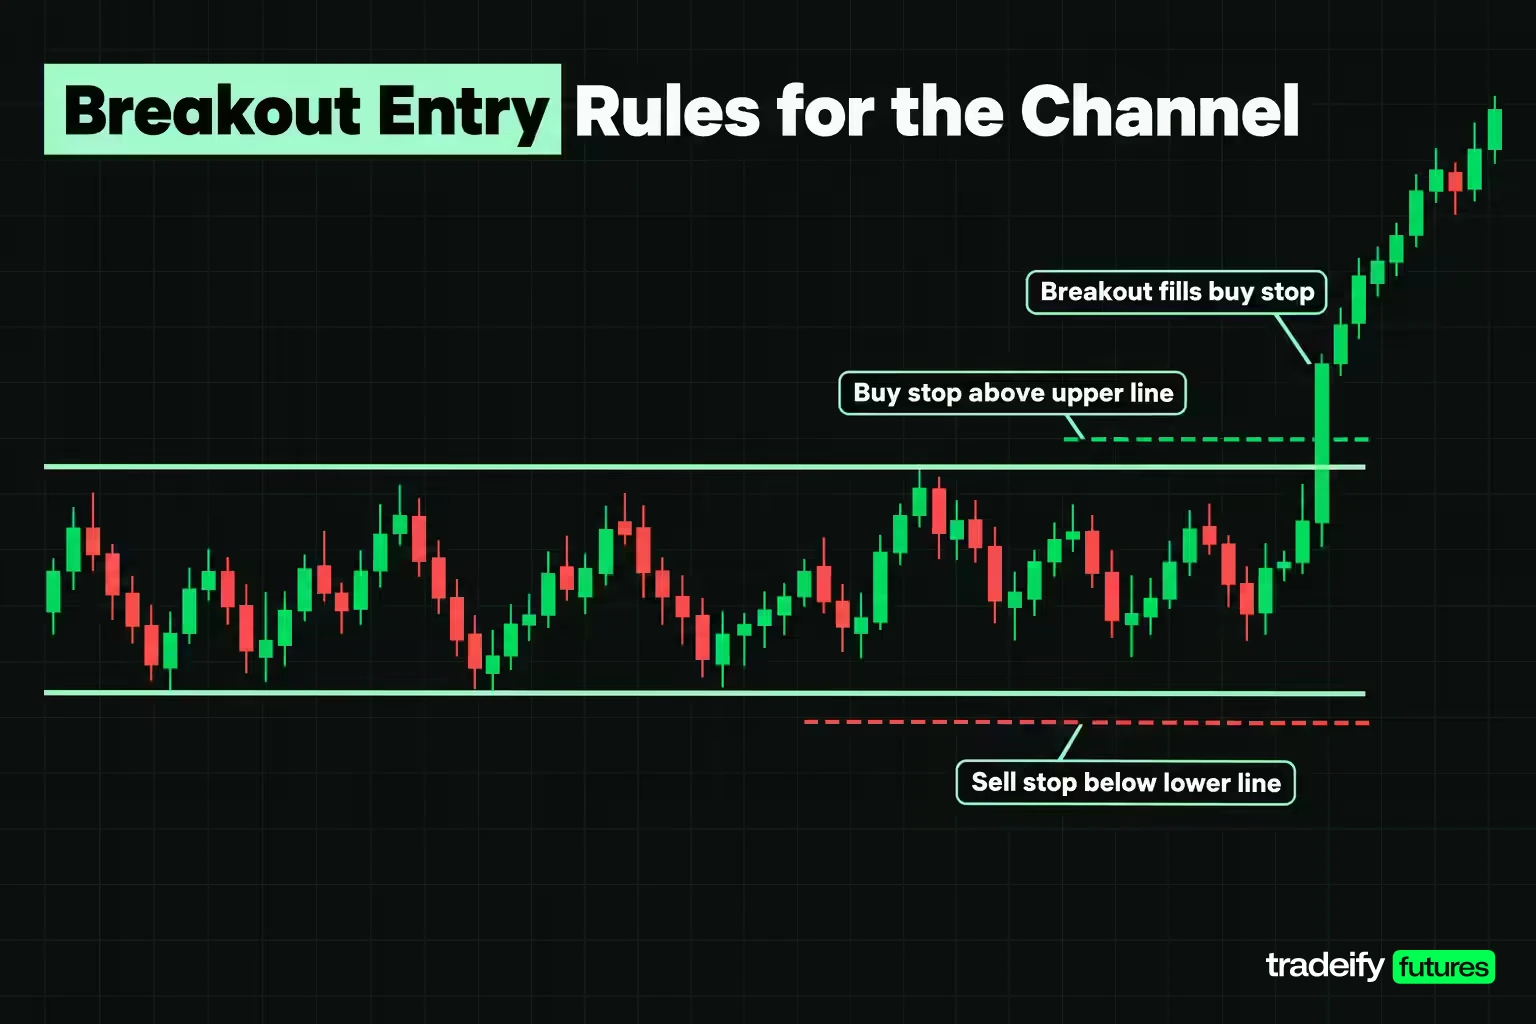
A Donchian channel breakout rule needs four decisions written down before the market opens: the trigger, the confirmation, the order type and the invalidation.
Trigger. The classic trigger is price trading beyond the prior N-bar extreme. The original Turtle rules entered when price exceeded the 20 day high or low by a single tick. On ES that means one tick, 0.25 points, above the upper line for a long and one tick below the lower line for a short.
Confirmation. An intrabar trigger fills as soon as the line trades. A close trigger waits for the bar to finish beyond the line and enters on the next bar. The intrabar version gets a better price on the breaks that keep going and gets caught on every pierce that closes back inside. The close version avoids those pierces and pays a worse entry on the real breaks.
Order type. An intrabar breakout is usually a buy stop above the upper line or a sell stop below the lower line. A stop becomes a market order when it triggers, so it can fill beyond the line in a fast market. If the session gaps through the line at the open, a stop order fills near the open, not at the line.
Invalidation. Decide what proves the break wrong. Common choices are a close back inside the channel, a break of the middle line, or a break of a shorter opposite channel. Each one changes how long a trade survives a pullback, so test the exit with the same care as the trigger.
A Complete Donchian Channel Breakout Entry Rule
A simple, complete Donchian channel breakout entry rule looks like this:
- Compute the 20 bar channel from completed bars only.
- Place a buy stop one tick above the upper line and a sell stop one tick below the lower line.
- If one fills, cancel the other and place the exit or stop you chose before entry.
- Size the position from the stop distance in dollars, not from the number of contracts you would like to trade.
- Skip the signal if the stop distance is larger than your per-trade risk limit allows on even one micro contract.
Related lesson: Breakout trading
The 20 Session Breakout Test on ES and NQ
The test asks three plain questions about 20 session Donchian channels on the same 252 ES and NQ sessions. When price breaks the line, does the close hold? When the close finishes beyond the line, how fast does it come back? And does following the break beat entering at random?
Method, in one paragraph: daily continuous ES and NQ futures bars from Yahoo Finance; trailing 252 completed sessions from November 3, 2025 to November 3, 2026; the channel for each session is the highest high and lowest low of the prior 20 completed sessions. The November 3 ES bar matches CME's December 2026 settlement data for that day. One year on two correlated index contracts is a small sample, so treat every figure here as a description of that year, not a forecast.
How Often 20 Session Breaks Hold the Close
These counts are this guide's own measurement on Yahoo Finance daily ES and NQ futures data, 252 sessions to November 3, 2026.
| Measure, 252 sessions | ES | NQ |
|---|---|---|
| Sessions that traded above the 20 session high | 45 | 49 |
| Share of all sessions | 17.86% | 19.44% |
| Of those, closed above the line | 26 | 27 |
| Upside held share | 57.78% | 55.10% |
| Sessions that traded below the 20 session low | 25 | 28 |
| Of those, closed below the line | 9 | 14 |
| Downside held share | 36.00% | 50.00% |
Price traded above the 20 session high on 45 ES sessions, a little under one session in five. Just 26 of those finished above the line, 57.78%. The other 19 were pierces that closed back inside the channel the same day.
Downside breaks were weaker still in the same Yahoo Finance ES data: 25 sessions traded below the 20 session low and only 9 closed below it, 36.00%. NQ held 14 of 28, 50.00%. The difference between the two contracts is a warning in itself. One year on one market is not enough to set a rule for another.
How Fast Failed Breakouts Return Inside the Channel
The next question is what happens after a close beyond the 20 session line. This table, from the same study of Yahoo Finance ES and NQ daily bars, counts how many of those closes were followed by a close back through the breakout-day line within one, three and five sessions.
| Sessions after a close beyond | ES back inside | ES share | NQ back inside | NQ share |
|---|---|---|---|---|
| 1 | 13 of 35 | 37.14% | 11 of 41 | 26.83% |
| 3 | 21 of 34 | 61.76% | 22 of 39 | 56.41% |
| 5 | 22 of 34 | 64.71% | 23 of 39 | 58.97% |
In that Yahoo Finance sample, 13 of 35 ES closes beyond the Donchian channel were undone by the very next close. Within five sessions, 22 of 34 had closed back through the line. NQ was a little stickier, but more than half of its breakouts still came back within three sessions.
A trader who treats a close beyond the line as a commitment has to plan for that. If more than half of the breaks give back the line within a few sessions, the stop placement and the size matter more than the trigger.
Ten Session Follow-Through Against Random Entries
The last check follows each close beyond the 20 session channel for ten sessions in the breakout direction, before costs.
- ES: 35 closes beyond, 33 with ten sessions of data afterward (26 upside, 7 downside). Following them produced -760.50 points in total, a mean of -23.05 points per event, even though 18 of 33 finished positive.
- NQ: 41 closes beyond, 38 scored (27 upside, 11 downside). The total was -3,577.75 points, a mean of -94.15, with 20 of 38 positive.
A losing total by itself does not say much, because the market's own trend can swamp a small sample. So the same mix of long and short entries, with the same ten session hold, was replayed 4,000 times from random sessions in the window. The ES breakout result beat only 6.0% of those random draws, and the NQ result beat 16.0%. In a year when ES rose, random long entries did well, and buying a fresh 20 session high did worse than buying a random day.
That does not prove Donchian channels never work. It shows that in this year, on these two contracts, the breakout itself carried no edge over random timing. If you have been buying every fresh 20 session high because it feels like the market is telling you something, this is the number to sit with. Any edge a channel strategy has has to come from somewhere else: the exit, the filter or the market selection.
Turtle Trend Following Rules and Results
The Turtle rules are the most famous complete trend-following system built on channel breakouts. The original rules, published by former Turtles in the Original Turtle Trading Rules document, used two systems:
- System 1: enter when price exceeds the 20 day high or low by one tick. Exit longs on a 10 day low and shorts on a 10 day high. Skip a System 1 signal if the last breakout would have been a winner.
- System 2: enter on a 55 day breakout and take every signal. Exit longs on a 20 day low and shorts on a 20 day high.
The full rules also sized positions by volatility and added units as a trade moved in the trader's favor. This test leaves those parts out, so read it as a check of the channel entries and exits, not of the complete Turtle program.
Turtle Rules Tested on ES and NQ
In this guide's test on Yahoo Finance ES and NQ daily data, each Turtle-style system traded one contract on the 252 sessions to November 3, 2026, entered at the line or at the open if price gapped through it, and paid an assumed 0.50 point per round turn (two ticks of slippage, $25 on ES and $10 on NQ, commissions not included). A position still open on November 3 was marked at that close.
| Rule set | ES trades | ES winners | ES net points | ES net per contract | NQ trades | NQ winners | NQ net points | NQ net per contract |
|---|---|---|---|---|---|---|---|---|
| 20 in, 10 out, long and short | 13 | 4 | -492.00 | -$24,600 | 13 | 2 | -3,721.75 | -$74,435 |
| 20 in, 10 out, long only | 7 | 2 | +141.75 | +$7,087.50 | 7 | 2 | -135.25 | -$2,705 |
| 55 in, 20 out, long and short | 5 | 1 | -126.50 | -$6,325 | 7 | 2 | -3,979.50 | -$79,590 |
The shape is typical of trend following, even in a losing year. Most trades lose, and the result depends on a few large winners. The best ES long-only trade made +559.75 points, enough to turn seven trades with five losers into a +141.75 point year. The short side of the same rule gave all of that back and more.
Two lessons hold up beyond this sample. First, win rates of one in three or worse are built into these systems, so a trader who cannot sit through a long run of losses will abandon the rules before the winner arrives. Second, thirteen trades a year is far too few to judge a system, which is why a test across many markets and years tells you more than any single contract can.
Donchian Channel Exits and Stop Placement
Exits decide most of what a system built on Donchian channels earns. In a year of ES and NQ daily data, 20 session breakout entries showed no edge over random timing, so whatever a channel system makes has to come largely from how it gets out. There are three common channel-based exits:
- Opposite band of the same channel. Exit a long when price breaks the 20 bar low. This is a stop-and-reverse design if you also take the new signal. It gives trades the most room and gives back the most profit.
- A shorter opposite channel. Exit a long on a 10 bar low, as Turtle System 1 does. It exits sooner and keeps more of an open gain.
- The middle line. Exit a long when price breaks the channel's midpoint. It exits soonest but gets shaken out by ordinary pullbacks.
Here is how those exits compared on the same 20 session entries, one contract, same cost assumption.
| Exit used after a 20 session entry | ES trades | ES winners | ES net points | NQ trades | NQ winners | NQ net points |
|---|---|---|---|---|---|---|
| 10 session opposite break | 13 | 4 | -492.00 | 13 | 2 | -3,721.75 |
| 20 session opposite break, stop and reverse | 11 | 2 | -711.75 | 11 | 2 | -5,625.25 |
| Middle line | 20 | 3 | -953.88 | 17 | 4 | -2,041.75 |
None of the exits rescued a year with no entry edge, but they changed the losses a lot. On ES the 10 session exit lost the least. On NQ the middle line lost the least because it cut the losing shorts sooner. The point is not which exit "won" one year. It is that you should test the exit as hard as the entry, because the same signals produced results that differed by more than 3,500 NQ points depending on the exit.
Pricing a Donchian Channel Stop in Dollars
A channel stop is only usable if the dollar risk fits your account. Use the channel for the November 4, 2026 session as an illustration. On ES the upper line was 7887.00, the middle line 7716.50 and the lower line 7546.00. On NQ the upper line was 31521.00, the middle line 29779.63 and the lower line 28038.25.
| Hypothetical long at the upper line | Stop distance in points | One full-size contract | One micro contract |
|---|---|---|---|
| ES, stop at the middle line | 170.50 | $8,525 | $852.50 |
| ES, stop at the lower line | 341.00 | $17,050 | $1,705 |
| NQ, stop at the middle line | 1,741.375 | $34,827.50 | $3,482.75 |
| NQ, stop at the lower line | 3,482.75 | $69,655 | $6,965.50 |
The dollar figures use CME point values: $50 per point on ES, $5 on Micro E-mini S&P 500 (MES), $20 on NQ and $2 on Micro E-mini Nasdaq-100 (MNQ). A daily Donchian stop on even one micro contract can mean well over $800 of risk on ES and several thousand on NQ.
Work in this order: convert the channel into a stop distance in points, convert points into dollars for the contract you trade, then let the dollars decide the size. If one micro contract is already too much, the trade does not fit. The tempting fix is to pull the stop closer until the dollars look comfortable, but a tighter stop chosen only to make the trade fit is a different strategy from the one you tested.
Related lesson: Position sizing
Advantages and Limitations of Donchian Channels
Donchian channels are worth keeping on a chart for a trailing stop and a clean read of the range, and they fail in predictable ways when used as a stand-alone entry signal.
Advantages:
- Transparent. Anyone can check a line against the raw highs and lows. There is no hidden smoothing or parameter.
- Real levels. The lines are prices that traded, so they line up with the swing highs and lows other traders watch.
- Built-in trailing stop. A lower line that only steps up when the range steps up is a natural trailing stop for a long.
- Rules are easy to write. Breakout, exit and filter rules translate directly into code, which makes testing easy.
Limitations:
- Lag by design. A 20 bar line can sit at an old extreme for weeks and then jump when that extreme leaves the window.
- Whipsaw in ranges. In this guide's year of Yahoo Finance ES daily data, fewer than six in ten upside pierces on ES held the close, and most closes beyond the line came back within five sessions.
- Wide stops on higher timeframes. A daily channel stop can be hundreds of ES points.
- Data sensitivity. Unadjusted continuous futures can print false highs or lows at a roll.
- No direction filter. The channel does not know if the market is trending. It only knows the extremes.
Does a Narrow Donchian Channel Predict a Bigger Move
Many guides say a narrow channel often comes before a large breakout. That is a forecast, so it can be checked. The test sorted the 242 sessions that had ten sessions of data afterward by 20 session channel width as a percentage of price, split off the narrowest fifth, and measured the average absolute move over the next ten sessions.
| Group | Width threshold | Sessions | Mean 10 session move in points | Mean move as % of price |
|---|---|---|---|---|
| ES narrowest fifth | at or below 3.94% | 48 | 123.84 | 1.66% |
| ES wider sessions | above 3.94% | 194 | 130.84 | 1.86% |
| NQ narrowest fifth | at or below 5.98% | 48 | 631.37 | 2.30% |
| NQ wider sessions | above 5.98% | 194 | 847.48 | 3.11% |
In this year, narrow channels were followed by smaller moves, not bigger ones, on both contracts. Quiet stretches stayed fairly quiet over the next two weeks. A narrow channel still tells you something useful. It means your usual point stop is wide compared with recent conditions, and a breakout from a tight range can still be the start of a trend. It just is not a reliable forecast on its own.
Combining Donchian Channels With Other Indicators
Combining Donchian channels with other indicators works best when each tool answers a question Donchian channels cannot. The channel tells you where the extremes are. It does not tell you the trend, the trend's strength or the typical bar size.
- Trend filter. Take long breaks only when price is above a longer moving average, and short breaks only below it. In this guide's one-year test of a 20 session entry and 10 session exit on Yahoo Finance ES daily data, the long-only version beat the long-and-short version by 633.75 points, which is the same idea in its bluntest form.
- ADX or DMI. TradingView's help page suggests pairing the channel with the Directional Movement indicator. A rising ADX says a trend is gaining strength, so a channel break in the same direction has more support than one in a flat market.
- ATR stops. Average true range measures typical bar size. Placing a stop a multiple of ATR beyond the entry gives a stop that adapts to volatility instead of jumping when an old extreme leaves the window.
- Bollinger Bands or Keltner Channels. These are a different measurement, not confirmation. A close outside both a Donchian channel and a Bollinger Band means price set a new extreme and is also stretched from its average. Treat agreement as context, not proof.
- Volume. A break on rising volume shows participation. A break on thin holiday volume is more likely to be a pierce that fails.
Each filter removes trades. Test the filtered version on its own sample, because a filter that improves a 13 trade year may only be removing two losers by luck.
Related lesson: Average directional index
Coding Donchian Channels in Pine Script and NinjaScript
Coding Donchian channels takes a few lines on any platform. The part that matters is the current-bar convention.
In Pine Script, TradingView's built-in functions ta.highest and ta.lowest return the highest and lowest value over a set number of bars, and the [1] history operator shifts a series back one bar. A prior-bar Donchian channel looks like this, written as plain lines:
- //@version=6
- indicator("Donchian prior bars", overlay = true)
- len = input.int(20, "Length")
- upper = ta.highest(high, len)[1]
- lower = ta.lowest(low, len)[1]
- plot(upper)
- plot(lower)
- plot((upper + lower) / 2)
Remove the [1] and the window includes the current bar, which means the close can never finish beyond the line. That one character is the most common reason a home-built Donchian breakout script never fires.
In NinjaTrader's NinjaScript, the DonchianChannel method takes a period and exposes Upper and Lower values by bars ago. The documentation's own example reads DonchianChannel(20).Upper[1], the previous bar's upper line, and compares it with High[0] to detect a break. Reading Upper[0] instead includes the current bar.
Before trusting any built-in Donchian indicator, check it against the formula on a few bars. Plot your own prior-bar version next to the built-in one. If the built-in line moves up with every new high on the current bar, it includes that bar, and a breakout condition built on it will not behave the way the textbook rule does.
Donchian Channels for Day Trading and Swing Trading
Donchian channels work on any timeframe, but the numbers change completely between a daily chart and an intraday chart.
Day trading. On ES 5-minute bars during regular hours, a 20 bar channel built only from that day's bars first appears on the 21st bar, at 11:10 AM ET. Across 48 full sessions from August 27 to November 3, 2026 (2,783 measured bars), the median 20 bar width was 23.75 points and the mean was 28.32. The close finished beyond the channel on 258 bars, 9.27%. A stop at half the median width, 11.875 points, is $593.75 on one ES and $59.38 on one MES. That is a stop a small account can size, unlike the daily version.
Intraday breaks bring their own convention choice. A channel that reaches back into the overnight session uses thinner overnight bars, while one built only on regular-hours bars ignores them. The two can draw different lines on the same chart, so pick one convention and test it.
Swing trading. Donchian himself worked with weekly rules, and swing traders often use a 20 day or 55 day channel as the trend frame and a shorter channel for entries and exits. A swing trade held for days carries overnight and weekend gap risk, which a stop order cannot protect against, because the market can open beyond your stop.
Common Donchian Channel Mistakes
Most Donchian channel losses come from a short list of avoidable mistakes:
- Including the current bar. The channel then can never be closed beyond, and break logic either never fires or fires on every new high depending on how it is written.
- Treating a pierce as a breakout. In this guide's study of a year of Yahoo Finance ES daily data, 19 of 45 pierces above the 20 session high closed back inside the channel the same day.
- Copying one setting across markets. In the same study, a 20 session channel put the close outside 13.89% of the time on ES and 16.27% on NQ.
- Reading the line as a forecast. A falling upper line can be an old high leaving the window, not new selling.
- Ignoring roll gaps. A continuous futures chart that is not back-adjusted can fake a new high or low on roll day.
- Choosing the stop after the size. The stop comes from the channel, the size comes from the stop. Reversing the order turns a tested rule into an untested one.
- Judging a system on a handful of trades. A 13 trade year can swing from profit to loss on one trade.
- Forgetting cost. A rule with many trades pays slippage and commission on each. Two ticks of slippage alone, 0.50 point, is $25 per round turn on ES before commissions.
Related lesson: Trendlines and channels
Practical Checks Before You Trade a Channel Break
Run these checks in order before acting on a break of Donchian channels on any timeframe. They are built to produce a "no" as easily as a "yes", and the hardest moment to run them is right after a candle has punched through the line and you are afraid of missing it.
- Write down the lookback, the timeframe and the current-bar convention. If the current bar is in the window, fix the indicator first.
- Confirm the data. Use the contract you trade or back-adjusted continuous data, and check that the last bar is complete.
- Decide in advance whether you trade the pierce or the close beyond, and accept the tradeoff that comes with it.
- Mark the invalidation level and convert it to points, dollars and size before the order goes in.
- Check the dollar risk on one micro contract. If even that is too large, pass.
- Compare the frequency and hold rate on your market with what you expect. If your instrument holds fewer than half of its breaks, plan for exits to do most of the work.
- Journal every signal, taken or skipped, so your own sample grows past a handful of trades.
A break that fails step 5 is a finished decision, not a missed trade. The next break is never more than a few sessions away: on ES daily bars a 20 session channel was closed beyond about once every seven sessions in the test year.
On our accounts, every position is closed by 4:45 PM ET and nothing is held overnight or over the weekend, so the daily-bar systems in this test cannot be run as written. Daily Donchian channels can still serve as context, with entries and exits taken on intraday bars and size kept within the account's contract limit (for example, 4 minis or 40 micros on a 50K account). TradingView connects through the Tradovate connection, NinjaTrader works with Tradovate credentials, and WealthCharts includes Chart Replay for practicing channel breaks on historical bars.
Donchian Channels FAQ
What is the Donchian channel formula?
The upper line is the highest high of the last N bars, the lower line is the lowest low of the last N bars, and the middle line is the two added together and divided by two. For a breakout test, use the prior N completed bars so the current bar is not in the window. N of 20 is the common default.
What is the best Donchian channel setting?
There is no single best setting. In this guide's study of a year of Yahoo Finance ES daily bars, a 10 session channel put the close outside 18.25% of the time, a 20 session channel 13.89% and a 55 session channel 8.73%. Choose the frequency you can review and test it on your own market.
Which is better, Donchian channels or Bollinger Bands?
Neither is better overall, because they measure different things. Donchian channels plot the actual highest high and lowest low, so a break is a new price extreme. Bollinger Bands plot an average plus and minus standard deviations, so they show how stretched price is from its mean. Many traders use the channel for breakout and stop levels and Bollinger Bands for stretch.
Is a Donchian channel breakout a buy signal?
Not by itself. In this guide's year of Yahoo Finance ES daily data, only 26 of 45 sessions that traded above the 20 session high closed above it. Following closes beyond the channel for ten sessions also did worse than most random entries on ES and NQ. Treat the break as a level to manage, not a forecast.
Why does my Donchian channel never show a breakout?
The indicator most likely includes the current bar. When today's high is part of the window, the upper line is always at least as high as today's high, so price cannot close above it. Shift the channel back one bar, for example with [1] in Pine Script or Upper[1] in NinjaScript.
Can you use Donchian channels for day trading?
Yes, Donchian channels work on intraday bars. In this guide's check of 48 sessions of ES 5-minute regular-hours bars, a 20 bar channel was a median of about 24 points wide, far tighter than the daily channel. Use the prior-bar convention, test the lookback and size the stop in dollars.
This article is educational and is not investment advice or a recommendation to trade any instrument. The ES and NQ figures are historical measurements from one data series over a fixed window, shown to illustrate how Donchian channels behave, and they do not predict future results on any market. Futures are leveraged, losses can exceed what you planned to risk, and a stop order does not guarantee your exit price. Prop firm evaluation and funded accounts may be simulated, and simulated results do not reflect live trading.


