



TL;DR: The ADX indicator measures how strong a trend is, not which way it is heading. Readings above 25 usually mean a trend is in place and readings below 20 mean there is none. Direction comes from the +DI and -DI lines, and the reading lags because it is smoothed twice. Calibrate the bands on your own market and load enough history before you trust the number.
The ADX indicator answers one question before you take a trend trade: is this market actually trending, or are you about to run a trend setup in a market that is going sideways? That sounds simple. It is also where traders get caught, because the number is easy to read and easy to misread. A high ADX reading can belong to a falling market. A low reading can sit under a move that already paid. And the number on your chart may not match the number on someone else's chart for the same day.
This guide covers what the ADX indicator measures, how it is calculated, how to read its values, the signals traders build from it, and where it fails. The examples use real E-mini S&P 500 futures daily bars, computed for this article, so you can check the textbook rules against an actual contract instead of taking them on faith.
What the ADX Indicator Measures
The ADX indicator, short for Average Directional Index, measures the strength of a trend on a scale from 0 to 100. It does not tell you whether price is rising or falling. A strong uptrend and a strong downtrend can both print the same high ADX value.
J. Welles Wilder introduced ADX in his 1978 book New Concepts in Technical Trading Systems, the same book that introduced Average True Range (ATR), Parabolic SAR and the Relative Strength Index (RSI). Wilder was a commodity and currency trader and built the system around daily commodity charts. Traders now apply it to stock index futures, stocks, forex and intraday charts.
The useful way to think about ADX is as a measure of how one-sided recent price movement has been. If most of the recent bars extended in one direction, ADX climbs. If price has been chopping back and forth, ADX sinks. That is why ADX is used as a filter: it tells you whether a trend-following tool has a trend to work with.
The ADX indicator is also a lagging indicator. A trend has to establish itself before the reading rises, so ADX confirms what has already happened rather than forecasting what comes next.
Related lesson: Directional movement index
ADX, +DI and -DI in the Directional Movement System
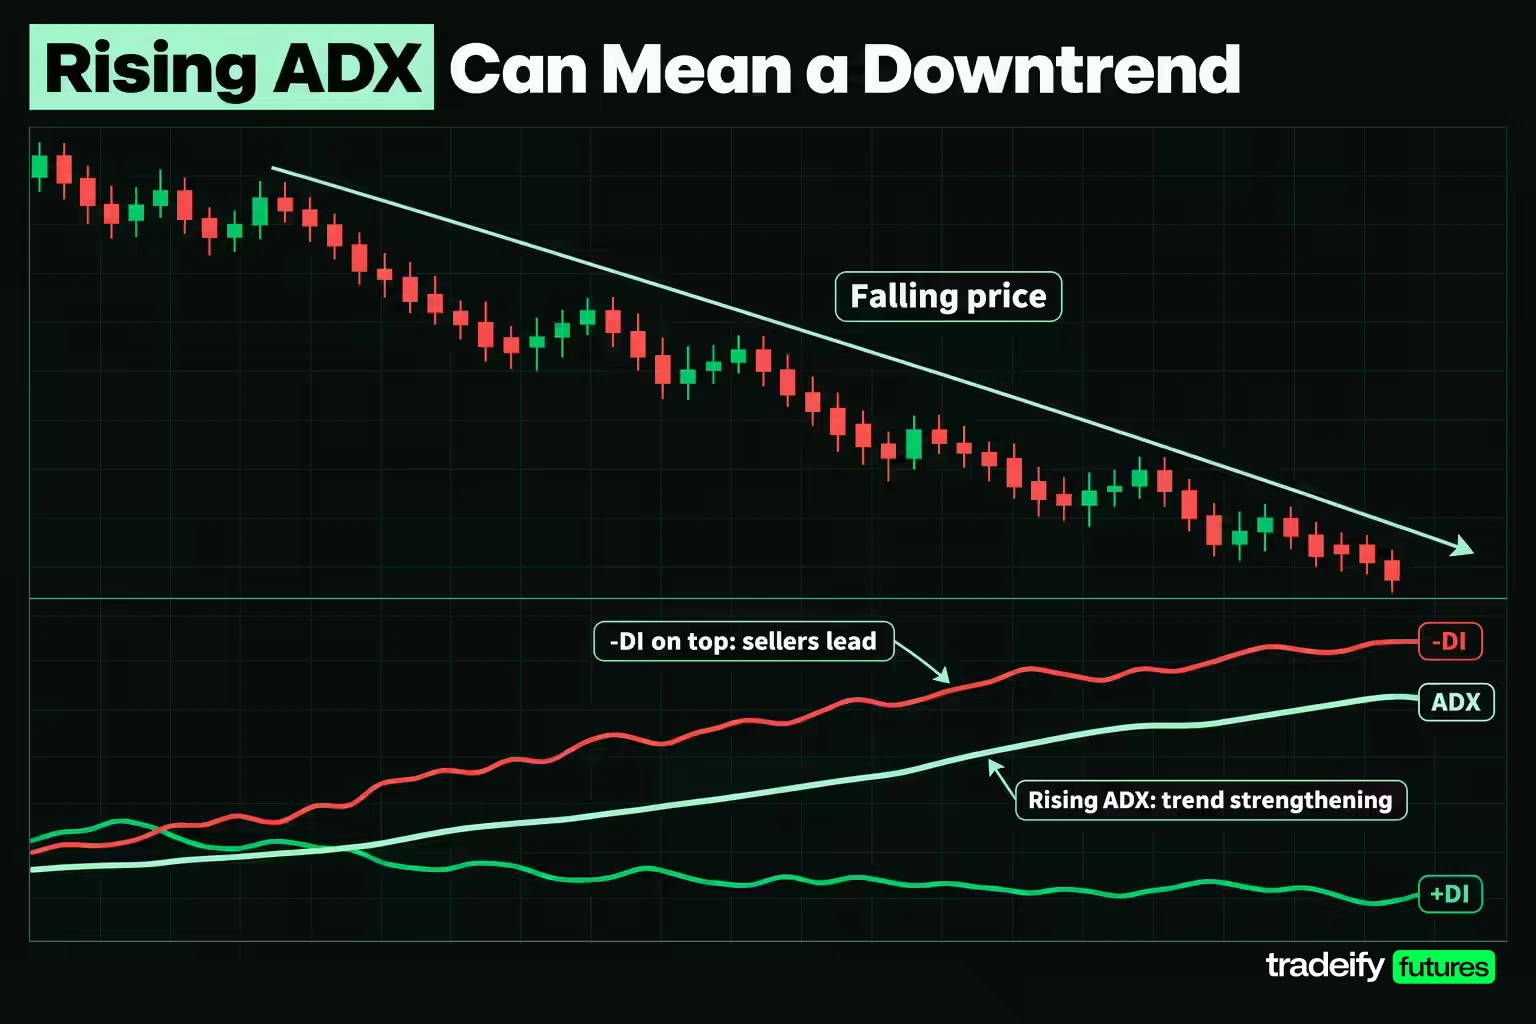
ADX is one of three lines in Wilder's Directional Movement System. The other two carry the direction that ADX leaves out.
- +DI (Positive Directional Indicator) measures the strength of upward movement.
- -DI (Negative Directional Indicator) measures the strength of downward movement.
- ADX measures how far apart +DI and -DI are, smoothed over time, regardless of which one is on top.
When +DI is above -DI, buyers have had the edge and the trend is up. When -DI is above +DI, sellers have had the edge and the trend is down. Traders often call the +DI and -DI pair the Directional Movement Indicator, or DMI, which is why the same study may appear on your platform as ADX, DMI or ADX/DMI.
The key relationship is simple once you see it. ADX rises when the two directional lines pull apart and falls when they converge. So a rising ADX with -DI on top means a downtrend is getting stronger. Reading that as bullish because "ADX is going up" is the most common ADX mistake, and it inverts the signal.
Some platforms split the lines into separate studies. TradingView's built-in ADX indicator plots only the ADX line, while its Directional Movement Index (DMI) indicator shows ADX, +DI and -DI together. If you want direction on the same panel, load the three-line version.
How the ADX Indicator Is Calculated
You do not need to calculate the ADX indicator by hand, but walking through the formula once explains why the line behaves the way it does. The standard setting is 14 periods, the value Wilder recommended.
- Directional movement. Compare each bar with the one before it. The upmove is the current high minus the prior high. The downmove is the prior low minus the current low. If the upmove is larger and positive, it becomes +DM and -DM is zero. If the downmove is larger and positive, it becomes -DM and +DM is zero. An inside bar gives zero for both.
- True range. Take the largest of the current high minus the current low, the current high minus the prior close, and the current low minus the prior close (as absolute values).
- Wilder smoothing. Smooth +DM, -DM and true range over 14 periods. The first value is the sum of the first 14 readings. Each later value is the prior smoothed value, minus one fourteenth of itself, plus the current reading.
- Directional indicators. +DI equals 100 times smoothed +DM divided by smoothed true range. -DI equals 100 times smoothed -DM divided by smoothed true range.
- DX. The directional movement index equals 100 times the absolute gap between +DI and -DI, divided by their sum.
- ADX. The first ADX value is the average of the first 14 DX readings. Each later value equals the prior ADX times 13, plus the current DX, divided by 14.
Two things fall out of the formula. Dividing directional movement by true range makes ADX relative, so a quiet market and a volatile one can print the same reading. And step 6 smooths a number that was already smoothed in step 3, which is why ADX turns slowly.
ADX Calculation Worked on One E-mini S&P 500 Session
Here is the calculation on October 30, 2026, a sharp down day in E-mini S&P 500 futures. The prior session, October 29, had a high of 7,773.75, a low of 7,709.50 and a close of 7,754.25. October 30 traded to a high of 7,713.00 and a low of 7,558.25 and closed at 7,614.00.
| ADX calculation step | Value | How it is obtained |
|---|---|---|
| Upmove | -60.75 | 7,713.00 minus 7,773.75 |
| Downmove | 151.25 | 7,709.50 minus 7,558.25 |
| +DM | 0.00 | Upmove is negative, so it is set to zero |
| -DM | 151.25 | Downmove is larger and positive, so it is taken in full |
| True range | 196.00 | Largest of 154.75, 41.25 and 196.00 |
| Smoothed true range | 1,241.39 | 1,125.81 minus one fourteenth, plus 196.00 |
| Smoothed +DM | 195.26 | 210.28 minus one fourteenth, plus 0.00 |
| Smoothed -DM | 397.07 | 264.73 minus one fourteenth, plus 151.25 |
| +DI | 15.73 | 100 times 195.26 divided by 1,241.39 |
| -DI | 31.99 | 100 times 397.07 divided by 1,241.39 |
| DX | 34.07 | 100 times the gap between the DI lines, divided by their sum |
| ADX | 16.13 | Prior ADX of 14.75 times 13, plus 34.07, divided by 14 |
The true range of 196.00 came from the low against the prior close, not the session's own high-to-low range of 154.75, because the entire session traded below the October 29 close of 7,754.25. Small differences in the last decimal come from rounding the displayed values; the indicator carries full precision.
One big down day shows the lag clearly. -DI jumped from 23.51 to 31.99 and DX printed 34.07, more than double the prior ADX. Yet ADX only moved from 14.75 to 16.13, because the newest DX gets a weight of 1/14, about 7%. That is the lag in action. One violent bar barely moves the ADX indicator; it takes a run of one-sided bars to lift it.
How to Read ADX Values
The common reading of the ADX indicator uses Wilder's two levels. Above 25, a strong trend is present. Below 20, there is no trend. Between 20 and 25 sits a gray zone where the reading is ambiguous. Many technical analysts simplify this and use 20 as the single key level.
Other sources stretch the scale further. One widely used set of bands treats readings below 20 as weak, above 40 as strong and above 50 as exceptionally strong.
| ADX value | Common interpretation | What it usually means for trend tools |
|---|---|---|
| Below 20 | No trend or a weak trend | Trend entries fire into chop; range tactics fit better |
| 20 to 25 | Gray zone | A trend may be forming or fading; wait for the slope to settle |
| 25 to 40 | Trending | Trend-following tools have something to follow |
| 40 to 50 | Strong trend | The move is well developed; manage open trades closely |
| Above 50 | Exceptionally strong trend | Rare on most index futures; often late in the move |
So what is a good ADX value? There is no universal one. A good value is one that separates trending from non-trending conditions on the market and timeframe you trade, and that depends on how that market normally behaves.
How Often ADX Bands Occur on E-mini S&P 500 Futures
The textbook bands say nothing about how often each band shows up. To check, this study computed a 14-period Wilder ADX on Yahoo Finance's continuous front-month E-mini S&P 500 daily series (ES=F, not back-adjusted for rolls), using 1,254 daily bars from November 5, 2021 to October 30, 2026 so every reading was fully settled. This is an illustrative study of one instrument, not a forecast.
| ADX band on ES daily bars | One year (252 sessions) | Four years (1,004 sessions) |
|---|---|---|
| Below 20 | 129 sessions, 51.2% | 405 sessions, 40.3% |
| 20 to 25 | 34 sessions, 13.5% | 216 sessions, 21.5% |
| Above 25 | 89 sessions, 35.3% | 383 sessions, 38.1% |
| Above 40 | 17 sessions, 6.7% | 56 sessions, 5.6% |
| Above 50 | 0 sessions | 7 sessions |
Three things stand out in this Yahoo Finance ES=F study. First, the 25 level is not a rare event on this contract; ADX sat above it on 38.1% of sessions over four years. Second, the "exceptionally strong" band above 50 barely exists here. Over the one year ending October 30, 2026, the highest reading was 47.86, and over four years ADX cleared 50 on only 7 sessions, peaking at 51.72 on July 16, 2024. Third, the median reading was 19.74 over the last year and 21.94 over four years, so a typical day on ES daily bars sits right around the gray zone.
The practical takeaway: if you are waiting for ADX to reach 50 on ES daily bars before you call a trend strong, you are waiting for something that happened on a handful of days in four years. Measure the distribution on your own instrument before you adopt a threshold.
Measuring Trend Strength With ADX Level and Slope
The level of the ADX indicator tells you which condition you are in. The slope tells you which way that condition is changing, and for trade decisions the slope often matters more.
- ADX rising means the move is becoming more one-sided. Trend-following tools tend to work better as long as it keeps rising.
- ADX falling means the move is losing cohesion. That can mean consolidation, a slowing trend or a coming range, but it does not mean the trend has reversed.
- ADX flat at a high level can still describe a steady trend. A trend that climbs at a constant slope tends to flatten ADX, because the ADX slope tracks acceleration in price rather than price itself.
There is a simple way to anticipate the slope. Because each new ADX value equals the prior ADX times 13 plus the current DX, divided by 14, ADX rises whenever DX is above the prior ADX and falls whenever DX is below it. If the directional lines are spreading wider than the ADX value implies, ADX will keep rising. The October 30, 2026 session shows this: DX printed 34.07 against a prior ADX of 14.75, so ADX ticked up even though the reading was still below 20.
High ADX does not mean bullish. In March 2026, ES ADX climbed to 46.64 on March 19 and peaked at 47.86 on March 20, with -DI at 27.98 far above +DI at 6.20. That was the strongest trend of the year by ADX, and it was a decline. If you only watched the ADX line, the strongest trend reading of the year said nothing about which side to be on.
Related lesson: Trend following
Reading Low ADX in Range-Bound Markets
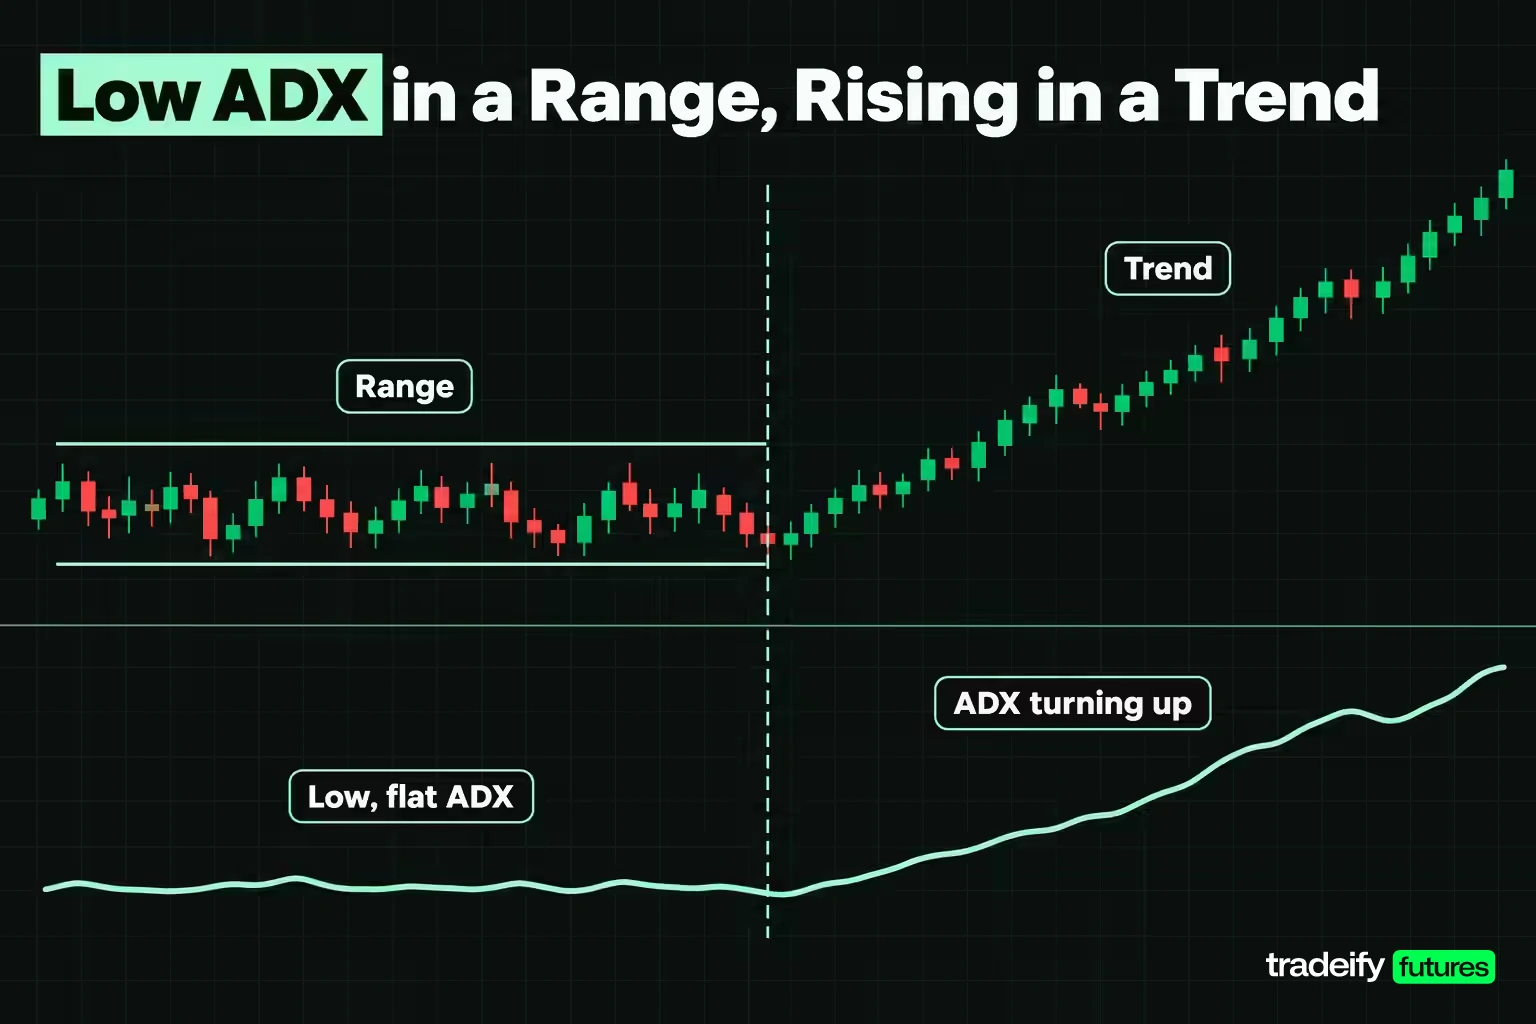
A low ADX indicator reading says the market has not been moving in one direction with any consistency. Bars overlap, the directional lines sit close together and cross often, and DX stays low. Below 20 is the usual line, and in this article's study of Yahoo Finance ES=F daily bars, more than half of all sessions over the last year (51.2%) sat there.
That matters because most trend tools assume there is a trend. Moving-average crossovers, breakout entries and pullback buys all fire in a range, and in a range they tend to stop you out on both sides. A low ADX is the warning that the conditions for those tools are missing.
What changes when ADX is low:
- Strategy choice. Range tactics, such as fading the edges of a defined range, fit a low-ADX market better than trend entries do. Mean reversion and support-and-resistance methods are built for it.
- Targets. In a range, the far side of the range is a more honest target than an open-ended trend target.
- Patience. Sometimes the right read is that there is no trade. A trader in a choppy session may feel pressure to make something happen; a low ADX is the reason to let it go.
Watch the transition as well. In October 2026, ES ADX sat near its yearly low, at 10.78 on October 9 and 10.86 on October 14, then rose steadily to 15.42 by October 23 and 16.13 by October 30 as selling picked up. Still below 20, but rising for most of three weeks. A climbing ADX from a very low base is often the first sign a range is ending, well before the reading clears any threshold.
Related lesson: Mean reversion trading
ADX Trading Signals and the DI Crossover
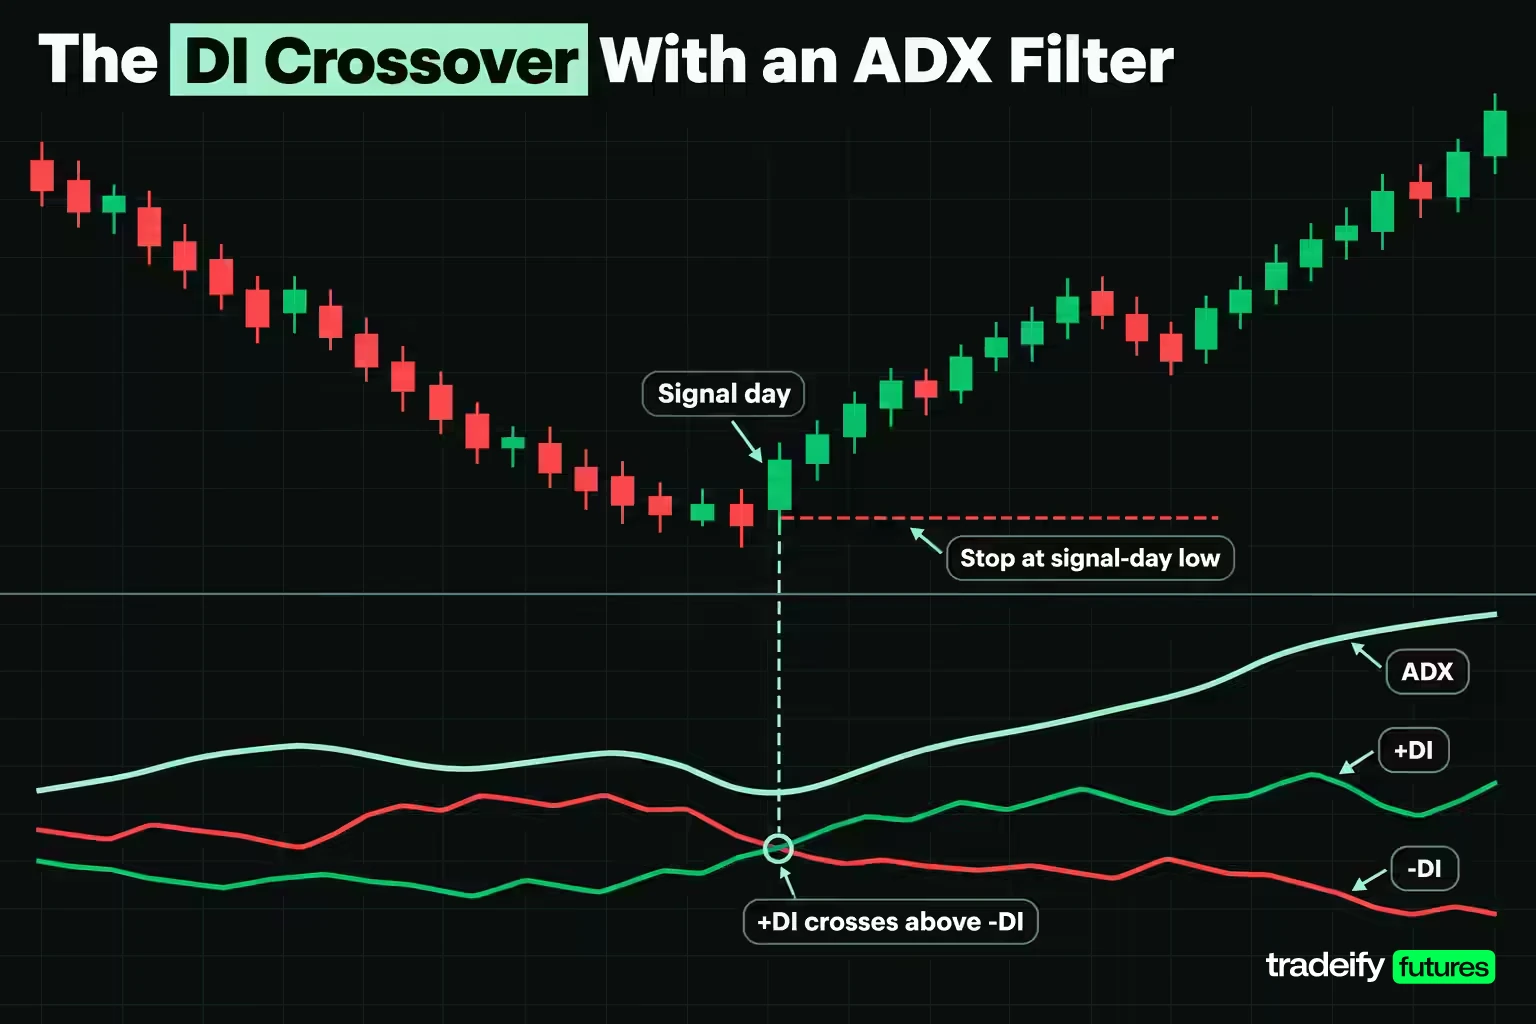
The ADX indicator itself has no buy or sell signal. The signals traders use come from the directional lines, with ADX acting as a filter on them.
Wilder's original system works like this:
- Filter. Only take signals when ADX is above 25, so the market is trending. Many traders lower the bar to 20.
- Buy signal. +DI crosses above -DI. The initial stop goes at the low of the signal day.
- Sell signal. -DI crosses above +DI. The initial stop goes at the high of the signal day.
- Signal stays in force as long as that signal-day extreme holds, even if the lines cross back.
Wilder also used what is often called the extreme point rule. After a bullish cross, wait for price to trade above the high of the crossover day before entering. After a bearish cross, wait for a break of the crossover day's low. That turns a line cross into an observation and the price break into the confirmation, which cuts the number of trades. Spotting the cross and having an entry are two separate decisions.
Other traders read the ADX indicator itself for timing. Alexander Elder described a buy signal when ADX turns up from below both directional lines while +DI is above -DI, exiting when ADX turns back down.
How Many DI Crosses Pass the ADX Filter
The textbook warning is that crossovers whipsaw in ranges, and TradingView notes that false signals are most common when ADX is below 25. Using the same Yahoo Finance ES=F daily series and 14-period Wilder ADX as the band study (data computed for this article), the share of crosses that happen in low-ADX conditions is large.
| Where the DI cross happened | Crosses over four years | Share | Close 10 sessions later was beyond the cross in its direction |
|---|---|---|---|
| ADX below 20 | 58 | 59% | 27 of 58 (47%) |
| ADX 20 to 25 | 18 | 18% | 8 of 18 (44%) |
| ADX above 25 | 22 | 22% | 10 of 22 (45%) |
In that ES=F study, over 1,004 sessions there were 98 crosses, and the median ADX on a cross day was 18.30. So most crosses happen in exactly the conditions the filter tells you to skip. The one-year figures look the same: 27 crosses, 16 of them below 20 (59%), with a median ADX of 16.74.
The last column is the uncomfortable part. On this sample, a raw cross with ADX above 25 did no better at following through over 10 sessions than a cross below 20. That matches ChartSchool's own assessment that an ADX requirement reduces signals but tends to filter out as many good signals as bad ones. It is one instrument, one timeframe and a crude follow-through test, so treat it as a reason to test the filter on your market, not as proof it never works.
There is also a timing trap in the high-ADX crosses. On April 8, 2026, +DI crossed above -DI with ADX at 37.19, which passes any threshold. But that high reading was left over from the March decline. ADX was measuring the trend that was ending, not the one that was starting.
ADX Signal Worked on the October 2026 Cross
On October 14, 2026, -DI rose to 25.51 and crossed above +DI at 20.07. By Wilder's rules that is a sell signal, but ADX stood at 10.86, far below both 20 and 25. The filter says no trade.
Had a trader taken it anyway, Wilder's initial stop would sit at the signal-day high of 7,879.75, with the close at 7,770.25. That is 109.50 points of risk, about 1.45 times the day's ATR of 75.43. On one Micro E-mini S&P 500 (MES) contract at $5 per point, that is $547.50. On one E-mini (ES) at $50 per point, it is $5,475.
What happened next is the honest part. Price never traded back above 7,879.75 through October 30, and the October 30 close of 7,614.00 was 156.25 points below the October 14 close. The filtered-out signal worked. The ADX filter would have kept a trader out of a move that paid, while letting through other crosses that failed. That is the trade-off of using any filter, and it is why the decision rule should come from testing, not from a single chart.
Using ADX to Confirm Breakouts
Breakouts are where the ADX indicator earns much of its reputation. A breakout out of a range and a fresh push in an existing trend can look identical on a price chart. ADX helps separate them.
The usual sequence looks like this:
- Low ADX before the break. A range or pattern forms while ADX sits low, often below 20. Some analysts describe ADX as a coincident indicator of chart pattern development, with readings below 20 often appearing shortly before pattern breakouts.
- Price breaks the level. This is the observation, not the confirmation.
- ADX turns up and DX expands. If the breakout has follow-through, the directional line in the breakout direction separates from the other one and ADX begins to rise.
- ADX crosses 20 or 25. By this point the move is confirmed by the indicator, but it is also several bars old.
The catch is lag. Because ADX gives the newest DX only a 1/14 weight, confirmation arrives after the breakout has already moved. A trader who waits for ADX above 25 gets more confidence and a worse price. A trader who acts on the price break alone gets a better price and more false breakouts.
A practical middle ground is to treat a rising ADX slope and an expanding gap between the DI lines as the confirmation, rather than a fixed level. And if ADX is already above 40 when price breaks out, ask whether the move is fresh or late in its own run. A breakout after a long trend has a different risk profile than one out of a quiet range.
What would invalidate the breakout read: price falling back inside the range while ADX flattens and the DI lines converge again. That is the market telling you the range is still in charge.
Related lesson: Breakout trading
ADX Divergence and Fading Trend Strength
ADX indicator divergence happens when price keeps making new highs or new lows while ADX makes lower peaks. It signals that the trend's strength is fading, which some traders read as an early warning of a pause or reversal.
Be careful with that reading. A falling ADX says the move is less one-sided. It does not say the move is over. ADX also flattens in a trend that rises at a steady pace, because the ADX slope reflects acceleration in price, so a calm trend can show "divergence" while it keeps working.
The March 2026 decline in ES shows the trap. ADX peaked at 47.86 on March 20 and fell to 44.68 by March 26. Price kept falling anyway, closing at 6,525.00 on March 26 and 6,388.25 on March 30, well below the 6,609.25 close on March 19. The close fell another 221.00 points from March 19 to March 30, so a trader who read the ADX peak as the end of the decline would have been far too early.
Use ADX divergence as a reason to tighten management of an open trade, not as a reason to reverse it. Price structure, such as a failed new low or a break of the last swing high, is the confirmation.
Combining the ADX Indicator With Other Indicators
The ADX indicator works best as a filter on top of a method that already produces entries. On its own it has no entry, no exit and no direction. Pair it with tools that supply what it lacks.
- Moving averages for direction and entries. A common setup uses a long moving average for trend direction and ADX for strength. ChartSchool shows a version that takes only buy signals when price trades above the 50-day simple moving average and ADX is above 20. The average sets the side; ADX decides whether there is enough trend to bother.
- RSI for stretch and timing. RSI measures the speed of price change and whether a move looks stretched. ADX measures whether a trend exists. In a strong trend with high ADX, RSI can stay overbought or oversold for a long time, so a high ADX is a reason to be careful about fading RSI extremes.
- ATR for stops and sizing. ADX and ATR come from the same true range calculation. ADX tells you whether there is a trend; ATR tells you how far price typically moves, which helps set a stop outside normal noise.
- Price structure for confirmation. Swing highs and lows, support and resistance, and breakouts give the actual trigger. ADX tells you whether trend-style triggers are likely to have room.
- A higher timeframe for context. A 5-minute ADX above 25 inside a daily chart with ADX below 20 is a short-term trend inside a larger range. Know which one you are trading.
Avoiding Redundant ADX Pairings
The pairing to avoid with ADX is stacking several trend-strength tools that measure the same thing. ADX, a moving-average slope and a momentum oscillator often agree because they are reading the same bars. More confirmation from the same data is not independent evidence.
People often ask which indicator is the most accurate. No indicator, ADX included, is accurate on its own, because every indicator is a summary of past prices. The more useful question is which combination answers the decisions you actually make: direction, trend presence, timing and risk.
Related lesson: Relative strength index
ADX Settings, Period Length and Warm-Up
The default ADX indicator setting is 14 periods, the value Wilder recommended. On some platforms there are two separate inputs. TradingView's DMI indicator, for example, has an ADX Smoothing input and a DI Length input, both 14 by default.
Changing the period changes the trade-off between speed and noise:
- Shorter settings react faster and produce more crosses and more threshold breaks, including more false ones.
- Longer settings react slower, cross less often and lag more.
ChartSchool notes that low-volatility markets may not generate signals on Wilder's default parameters, and that traders may need to adjust the settings or the signal thresholds to fit the instrument. If you change the period, re-measure your bands. A threshold of 25 on a 14-period ADX does not mean the same thing on a 7-period ADX.
Platforms also differ in how they compute ADX. MetaTrader 5 ships two versions: Average Directional Movement Index, which uses its own averaging, and ADX Wilder, built to follow Wilder's book exactly. The two can show different values on the same chart, so when you compare a reading with someone else, check which version they are running.
Why Two Charts Show Different ADX Values
Because of the double smoothing, ADX needs a long run of history before its values settle. ChartSchool puts it at around 150 periods and notes that ADX computed from 30 periods of history will not match ADX computed from 150. Here is how big that effect was on ES on October 30, 2026, with ADX computed from only the most recent bars.
| Bars of history used | ADX on October 30, 2026 | Difference from settled value |
|---|---|---|
| 30 | 25.15 | +9.02 |
| 45 | 17.35 | +1.22 |
| 60 | 17.73 | +1.61 |
| 80 | 16.41 | +0.28 |
| 100 | 16.05 | -0.08 |
| 150 | 16.13 | 0.00 |
| 300 | 16.13 | 0.00 |
| 1,254 | 16.13 | Settled value |
With 30 bars loaded, ADX read 25.15, above Wilder's trend threshold. With full history it read 16.13, below 20. Same contract, same day, opposite conclusions. By 150 bars the value had settled. If your platform or backtest starts from a short history, load several hundred bars before you trust the reading.
How to Add the ADX Indicator to a Chart
Most charting platforms list ADX under their built-in indicators. Search for "ADX", "Average Directional Index" or "DMI".
- TradingView: the "Average Directional Index" study shows the ADX line only; the "Directional Movement Index" study shows ADX, +DI and -DI together.
- StockCharts: choose "ADX Line (w/+DI and -DI)" from the indicator list, or the ADX line on its own.
- MetaTrader 5: under trend indicators, choose Average Directional Movement Index or ADX Wilder.
Plot it in its own panel below price, and add horizontal lines at 20 and 25 (or at the levels you measured) so threshold breaks are easy to spot.
ADX Across Markets and Timeframes
The ADX indicator started on daily commodity charts and was later adapted to other markets and timeframes. It works anywhere you have highs, lows and closes, but the readings behave differently from market to market.
- Futures. Energy, metals and index futures can trend hard, and ADX tends to be most useful where trends are strong and sustained. Measure the bands per contract, because a distribution measured on ES will not carry over to another market.
- Stocks. ChartSchool notes that low-volatility stocks may not generate signals on Wilder's parameters, so the defaults may fit a volatile stock better than a quiet one.
- Forex. If a currency pair spends long stretches in ranges, expect low readings and frequent DI crosses, and measure before assuming the defaults fit.
- Intraday charts. The 14 periods are 14 bars, so on a 5-minute chart a 14-period ADX covers 70 minutes and the 150-bar warm-up is 750 minutes, or 12.5 hours of bars. Session gaps also inflate true range on the first bar after a break, which can distort intraday readings around the open.
Timeframe choice changes what ADX describes. A daily ADX tells you about the multi-week backdrop; a 5-minute ADX tells you about the last hour or so. Many traders read a higher-timeframe ADX for context and a lower-timeframe chart for entries.
On our accounts, every position is closed by 4:45 PM ET and nothing is held overnight, so a daily ADX reading works as background for the session rather than as a multi-day swing signal. TradingView is available through the Tradovate connection, and WealthCharts includes 200+ indicators plus Chart Replay, which lets you practice an ADX filter on historical bars before using it live.
Related lesson: Multiple timeframe analysis
ADX Limitations
The ADX indicator is useful, but its weaknesses are built into the formula.
- Lag. Double smoothing means ADX confirms trends after they are underway and keeps describing old trends after they end. The April 2026 cross at ADX 37.19 is a clear case of a reading left over from the prior move.
- No direction. ADX rises in uptrends and downtrends alike. Read direction from +DI and -DI or from price.
- Filters cut good trades too. On ES daily bars, crosses above 25 followed through no more often than crosses below 20, and the October 2026 sell signal that the filter rejected went on to work.
- Thresholds depend on the market. The 20 and 25 levels came from Wilder's commodity work. On ES daily bars, readings above 50 occurred on only 7 sessions in four years.
- History and platform differences. Short history inflates or deflates readings, and different ADX formulas give different values.
- Range whipsaws. The DI lines cross often when ADX is low, and most crosses on ES happened below 20.
None of these make the ADX indicator useless. They make it a context tool. Use it to decide whether trend logic applies, then let price and risk rules decide the trade.
Related lesson: Average true range
ADX Indicator FAQ
What is ADX?
ADX, the Average Directional Index, is a technical indicator that measures trend strength on a scale from 0 to 100. J. Welles Wilder introduced it in 1978. It does not show direction; the +DI and -DI lines that come with it do.
What is a good ADX value?
Readings above 25 are commonly treated as trending and readings below 20 as non-trending. The better answer is whatever level separates trend from range on your own market, which you can find by measuring how often each band occurs. In this article's study of Yahoo Finance ES=F daily bars, ADX was above 25 on 38.1% of sessions over four years.
What is the most accurate stock market indicator?
No single indicator is reliably accurate, because each one summarizes past prices. Indicators are more useful in combination, with each covering a different question, such as trend presence, direction, timing and risk. Testing on your own market matters more than the choice of tool.
How do you see the ADX indicator on a chart?
Open your platform's indicator list and search for ADX, Average Directional Index or DMI. On TradingView, the DMI study shows all three lines, while the ADX study shows only the ADX line. Plot it in a separate panel with reference lines at 20 and 25.
Is ADX better than RSI?
They answer different questions, so neither replaces the other. ADX measures whether a trend exists and how strong it is. RSI measures the speed of price change and whether a move looks stretched.
Does a rising ADX mean price will go up?
No. A rising ADX means the current move, up or down, is getting more one-sided. Check which directional line is on top to see whether that move is up or down.
ADX Indicator Risk Disclosure
This article is educational and is not investment advice or a recommendation to trade any instrument. The E-mini S&P 500 figures are historical measurements from one data series over a fixed window, shown to illustrate how ADX behaves; they do not predict future readings or results on any market. Futures are leveraged, losses can exceed what you planned to risk, and a stop order does not guarantee your exit price. Prop firm evaluation and funded accounts may be simulated, and simulated results do not reflect live trading.


