



TL;DR: Ease of movement measures how far a bar's midpoint moved for the volume it took, so it describes a move rather than forecasting one. Its two published divisors differ by exactly 10,000, which rescales thresholds but never changes a sign or a crossing. On two years of ES and NQ futures, zero line crossings did worse than the base rate ten sessions later.
Ease of movement answers a narrow question: did price travel far for the volume it took, or did it grind? You add it to a chart, it crosses above zero after a selloff, and now there is a decision to make. Is that a reason to buy, or a line telling you what the last two weeks already showed?
This guide builds the ease of movement indicator from three pieces of arithmetic, reconciles it by hand on 15 real E-mini S&P 500 futures sessions, and then tests what its readings, crossings, divergences and confirmations actually did. The study uses Yahoo Finance's continuous front-month daily bars for the E-mini S&P 500 (ES) and E-mini Nasdaq-100 (NQ) futures, 502 completed sessions from November 5, 2024 to November 3, 2026, with a 14-period simple moving average. Every count was computed for this article, so you can see the method and judge the sample yourself.
What Is the Ease of Movement Indicator
The ease of movement indicator (EMV, or EOM on some platforms) is a volume-based oscillator that moves above and below a zero line. It relates the change in a bar's midpoint to the volume and range that produced it. StockCharts and TradingView both describe the basic reading the same way: positive values mean prices are advancing with relative ease, negative values mean they are declining with relative ease.
It was developed by Richard W. Arms Jr., the analyst behind EquiVolume charts and the Arms Index (TRIN). An EquiVolume box uses the high and low for its top and bottom and volume for its width, so a wide box means a lot of trading for the ground covered. Ease of movement turns that visual idea into a number. A wide range on light volume says price moved easily. A narrow range on heavy volume says it moved with difficulty.
Who created the ease of movement indicator
Richard W. Arms Jr. built ease of movement as an extension of his own charting work. StockCharts describes it as taking EquiVolume to the next level: EquiVolume shows the price and volume relationship as box shapes on the chart, and ease of movement turns that relationship into an oscillator you can read and scan. cTrader's documentation dates the indicator to the 1990s and places it alongside his other volume-based work, the Arms Index (TRIN).
That lineage explains the design. Arms cared about how much trading it took to move price, not only where price went. EquiVolume builds volume into the width of each box, and ease of movement builds it into the denominator of the formula.
What ease of movement is used for
What ease of movement is for matters more than the definition. Both StockCharts and TradingView say it is not a standalone indicator and is best used to confirm other signals or chart analysis. Keep that in mind the first time a crossing looks like a trade.
Related lesson: What is volume
How the Indicator Measures Easy and Hard Movement
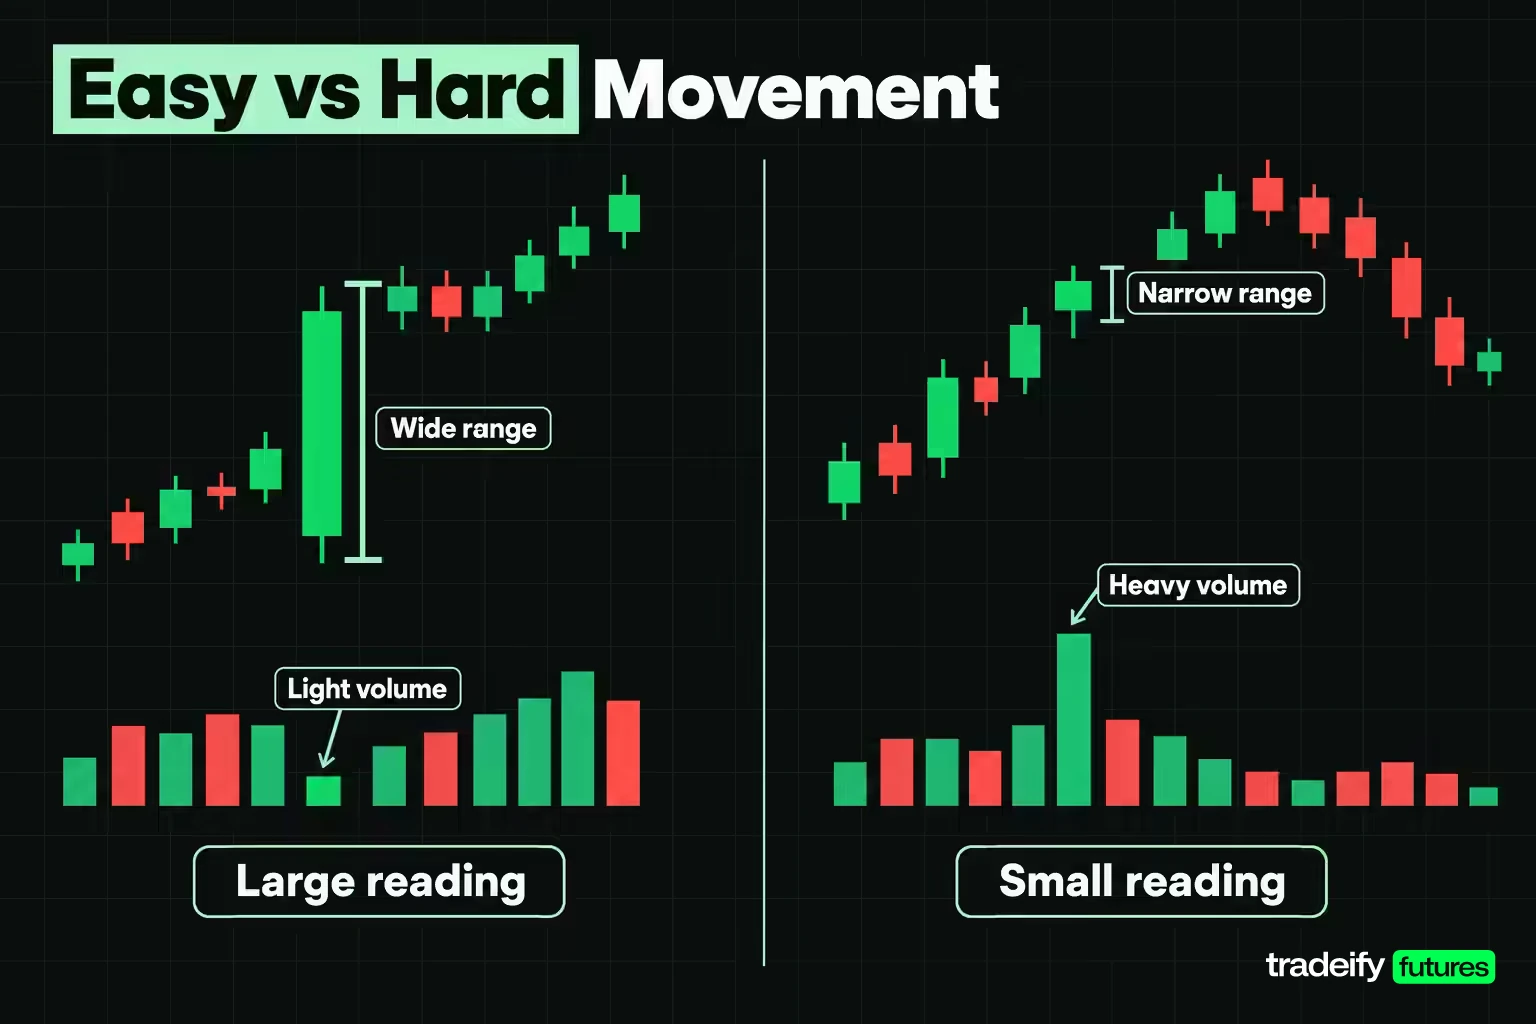
Ease of movement has two moving parts, and they do different jobs.
- Distance moved supplies the direction. It is the current bar's midpoint minus the previous bar's midpoint, where the midpoint is the high plus the low divided by two. A higher midpoint gives a positive value, a lower one a negative value.
- The box ratio supplies the size. It is scaled volume divided by the bar's high minus low range. Low volume and a wide range make the box ratio small, so dividing by it makes the reading large. Heavy volume on a narrow range makes the box ratio large and the reading small.
StockCharts gives a clean pair of examples. If scaled volume is two and the range is four, the box ratio is 0.50. If scaled volume is four and the range is two, the box ratio is 2. Same inputs, swapped, and the ratio moves by a factor of four.
A round illustrative case shows the volume effect on its own. Take a bar whose midpoint rose 10 points on a 20-point range. With 2,000,000 contracts traded, ease of movement in the 10,000 form is 10 x 20 x 10,000 / 2,000,000 = 1.00. With 200,000 contracts it is 10.00. Same price action, one tenth of the volume, ten times the reading.
Four real sessions of ease of movement
Real E-mini S&P 500 bars show the trade off, including the case where the formula has nothing to say.
| ES session | High minus low | Volume | Distance moved | Box ratio | One-period EMV | What it shows |
|---|---|---|---|---|---|---|
| 2026-10-30 | 154.75 | 2,539,896 | -106.00 | 1.641290 | -64.58 | The widest range in the chain on heavy volume, but the range was wide enough to keep the box ratio small, so this was the largest reading |
| 2026-10-21 | 61.25 | 1,680,253 | 33.625 | 2.743270 | 12.26 | A solid rise in the midpoint on a narrow range, so the box ratio is large and the reading is modest |
| 2026-11-02 | 123.00 | 2,002,583 | -3.375 | 1.628116 | -2.07 | A wide range, but the midpoint barely moved, so the reading sits near zero |
| 2025-06-05 | 87.75 | 0 | not comparable | zero | undefined | The data feed reported zero volume for a normal trading session, so the reading does not exist rather than printing a number |
The November 2 row is the one traders tend to misread. A 123-point range feels like a big day, yet ease of movement barely registers, because the bar opened and closed its swing near the prior midpoint. Range only scales the reading. The midpoint change decides whether there is anything to scale.
The Ease of Movement Formula and Its Two Divisors
The ease of movement formula has four steps, as TradingView publishes them for a 14-period line:
- Distance moved = (current high + current low) / 2 - (previous high + previous low) / 2.
- Box ratio = (current volume / 100,000,000) / (current high - current low).
- One-period EMV = distance moved / box ratio.
- 14-period EMV = the 14-period simple moving average of the one-period values.
StockCharts uses the same volume divisor of 100,000,000. The cTrader documentation writes the same expression the other way up: distance moved times the high minus low range, divided by volume, then multiplied by 10,000. Both are the same arithmetic. The only difference is the constant.
Why the divisor changes thresholds but not signals
Dividing volume by 100,000,000 inside the denominator is the same as multiplying the result by 100,000,000. The cTrader form multiplies by 10,000. So the StockCharts form is always exactly 10,000 times the cTrader form on the same bar.
| Formula version | Volume scaling | ES reading on November 3, 2026 | Median 14-period reading | Full range of the line | Readings above zero |
|---|---|---|---|---|---|
| StockCharts and TradingView help pages | Volume divided by 100,000,000 | -83,655.96 | 5,582.65 | -382,806.42 to 339,218.84 | 225 of 426 |
| cTrader help page | Multiplied by 10,000 | -8.37 | 0.56 | -38.28 to 33.92 | 225 of 426 |
On all 426 defined 14-period readings on ES, the two versions had the same sign. Every reading above zero, every crossing and every turn in the line happened on the same session in both. The divisor can never change what ease of movement says about direction. It changes only the number you write beside a threshold.
That is where the trap sits. A rule written as "buy when EMV is above 20" on one version becomes "above 200,000" on the other. Copy a threshold from a page that uses the other divisor and the rule either never fires or fires constantly. TradingView's study has a Divisor input for exactly this reason, and its help page says heavily traded instruments need a higher divisor to keep the reading in single or double digits. Check the setting on your own study before borrowing anyone's number.
The same problem runs across markets. The median absolute 14-period reading was 5.96 on ES and 539.25 on NQ in the cTrader form, about 90 times apart, because NQ trades a far wider point range on fewer contracts. A raw ease of movement threshold is specific to one instrument and one divisor.
Calculating EMV Step by Step on 15 Futures Sessions
Here is the 14-period ease of movement line on the E-mini S&P 500 across the 15 completed sessions from October 14 to November 3, 2026, in the 10,000 form. Each row is a raw daily bar or arithmetic on it, so a spreadsheet can reproduce the last value.
The 15-session EMV chain table
The October 14 row is the starting point of this E-mini S&P 500 ease of movement chain. Its midpoint becomes the prior midpoint for October 15, and its own one-period value falls outside the November 3 window.
| Date | High | Low | Prior midpoint | Midpoint | Distance moved | Range | Volume | Box ratio | One-period EMV | 14-period EMV |
|---|---|---|---|---|---|---|---|---|---|---|
| 2026-10-14 | 7,879.75 | 7,741.00 | 7,849.250 | 7,810.375 | -38.875 | 138.75 | 2,063,500 | 1.487207 | -26.14 | 2.76 |
| 2026-10-15 | 7,801.75 | 7,717.25 | 7,810.375 | 7,759.500 | -50.875 | 84.50 | 1,909,800 | 2.260118 | -22.51 | 0.11 |
| 2026-10-16 | 7,809.50 | 7,676.00 | 7,759.500 | 7,742.750 | -16.750 | 133.50 | 2,380,698 | 1.783294 | -9.39 | -0.03 |
| 2026-10-19 | 7,773.25 | 7,677.00 | 7,742.750 | 7,725.125 | -17.625 | 96.25 | 1,740,657 | 1.808475 | -9.75 | -0.14 |
| 2026-10-20 | 7,791.50 | 7,704.50 | 7,725.125 | 7,748.000 | 22.875 | 87.00 | 1,718,580 | 1.975379 | 11.58 | 0.62 |
| 2026-10-21 | 7,812.25 | 7,751.00 | 7,748.000 | 7,781.625 | 33.625 | 61.25 | 1,680,253 | 2.743270 | 12.26 | 2.22 |
| 2026-10-22 | 7,798.75 | 7,676.75 | 7,781.625 | 7,737.750 | -43.875 | 122.00 | 2,274,209 | 1.864106 | -23.54 | -1.02 |
| 2026-10-23 | 7,714.25 | 7,648.50 | 7,737.750 | 7,681.375 | -56.375 | 65.75 | 1,791,568 | 2.724818 | -20.69 | -4.20 |
| 2026-10-26 | 7,739.50 | 7,651.75 | 7,681.375 | 7,695.625 | 14.250 | 87.75 | 1,677,784 | 1.912005 | 7.45 | -5.97 |
| 2026-10-27 | 7,772.75 | 7,699.75 | 7,695.625 | 7,736.250 | 40.625 | 73.00 | 1,556,188 | 2.131764 | 19.06 | -4.14 |
| 2026-10-28 | 7,819.50 | 7,750.25 | 7,736.250 | 7,784.875 | 48.625 | 69.25 | 1,576,563 | 2.276625 | 21.36 | -1.69 |
| 2026-10-29 | 7,773.75 | 7,709.50 | 7,784.875 | 7,741.625 | -43.250 | 64.25 | 1,998,904 | 3.111135 | -13.90 | -3.46 |
| 2026-10-30 | 7,713.00 | 7,558.25 | 7,741.625 | 7,635.625 | -106.000 | 154.75 | 2,539,896 | 1.641290 | -64.58 | -8.79 |
| 2026-11-02 | 7,693.75 | 7,570.75 | 7,635.625 | 7,632.250 | -3.375 | 123.00 | 2,002,583 | 1.628116 | -2.07 | -8.63 |
| 2026-11-03 | 7,623.75 | 7,546.00 | 7,632.250 | 7,584.875 | -47.375 | 77.75 | 1,645,013 | 2.115772 | -22.39 | -8.37 |
Walking the last row of the EMV chain
Take November 3 column by column. The high was 7,623.75 and the low 7,546.00, so the midpoint is 7,584.875. The prior midpoint was 7,632.250, so distance moved is -47.375 points. The range is 77.75 points and volume was 1,645,013 contracts.
In the 10,000 form, the box ratio is volume divided by 10,000 and then by the range: 1,645,013 / 10,000 / 77.75 = 2.115772. Distance moved over the box ratio gives -47.375 / 2.115772 = -22.39. In the 100,000,000 form the box ratio is 0.000211577 and the one-period reading is -223,913.50, exactly 10,000 times larger.
Reconciling the 14-period ease of movement value
The 14 one-period values from October 15 to November 3 sum to -117.11 when each is rounded to two decimals. Divided by 14, that is -8.37, the value the table prints for November 3. If your own sum does not reproduce your platform's line, one of three things is off: an input bar, the length, or the divisor.
Notice how uneven the one-period ease of movement column is. The largest single row is October 30 at -64.58, which is 24.79% of the window's total absolute movement on its own. Remove it and the other 13 values average -4.04. The line stays negative, but half its size came from one session.
Reading Positive, Negative and Near Zero Movement Values
Reading ease of movement starts with the sign and ends with the size.
- Positive. Midpoints have been rising on volume light enough, relative to range, to make the move look easy. StockCharts reads this as prices advancing with relative ease.
- Negative. Midpoints have been falling with relative ease.
- Far from zero. The further the line sits from zero, the easier the move has been. A large positive value after a wide-range, light-volume rally is the classic reading.
- Near zero. StockCharts says prices are likely in a trading range. That is often true, but there is a second cause worth checking: heavy volume on narrow ranges. A market where both sides are trading a lot without making ground also pins the line near zero.
None of these readings say anything about the next bar on their own. They summarize the last 14.
Turning an ease of movement reading into points
A raw ease of movement number has no natural unit, which is why "is minus 8 a big reading?" is hard to answer. You can put it back into price terms by reversing the formula. Distance moved equals the reading times volume divided by the divisor and by the range.
Using ES's median session over the study window, about 1.41 million contracts on a 77.00-point range, one unit of the 14-period line in the 10,000 form equals about 1.83 points of average midpoint shift per session. On NQ, with a median of about 545,467 contracts on a 403.125-point range, one unit equals about 0.1353 points.
| Market | Median 14-period reading, absolute | Points per unit of the line | Implied average midpoint shift per session |
|---|---|---|---|
| E-mini S&P 500 | 5.96 | 1.83 | 10.92 points |
| E-mini Nasdaq-100 | 539.25 | 0.1353 | 72.97 points |
The raw medians are about 90 times apart. In implied points they are about 6.7 times apart, against median daily ranges about 5.2 times apart. Most of the raw gap is units, not behavior.
The conversion holds up on the ES chain from October 14 to November 3, 2026. The November 3 line of -8.37 times 1.83 is about -15.31 points per session. The actual average midpoint change over those 14 sessions was -16.11 points. Close enough to tell you what the line was really reporting: midpoints had been falling about 16 points a day.
How EMV Tracks Trend Direction and Strength
TradingView calls trend direction the most straightforward use of ease of movement. The study shows why: the line mostly is the trend, restated.
| Measure on the 14-period line | E-mini S&P 500 | E-mini Nasdaq-100 |
|---|---|---|
| Defined readings | 426 | 426 |
| Rank correlation with the plain 14-session midpoint change | 0.923 | 0.881 |
| Share of the line's variance explained by that midpoint change | 79.09% | 66.72% |
| Readings whose sign matched the midpoint change | 388 of 426 (91.08%) | 377 of 426 (88.50%) |
| Readings that disagreed on direction | 38 | 49 |
On ES, the plain 14-session midpoint change, with volume ignored entirely, explained 79.09% of the line's variance. The two agreed on direction 91.08% of the time. That is a design consequence, not a flaw. Distance moved sets the sign, and StockCharts says outright that ease of movement generally rises and falls with price.
So the volume term earns its keep in the roughly one reading in ten where it disagrees with price. Those are windows where a few large, low-volume moves in one direction outweighed more ground covered on heavy volume in the other. That is the information a plain price chart does not show you, and it is the part worth looking at.
How one session can dominate a 14-session EMV window
Trend strength readings carry a hidden risk: a single bar can supply most of the window. This guide measured it on the same Yahoo Finance ES and NQ daily bars, November 2024 to November 2026.
| Measure of window concentration | E-mini S&P 500 | E-mini Nasdaq-100 |
|---|---|---|
| Median share of a window's absolute movement from its largest session | 23.64% | 22.57% |
| Windows where one session supplied more than half | 11 of 426 (2.58%) | 16 of 426 (3.76%) |
| Largest single-session share seen | 84.90% | 75.28% |
| Windows whose sign reverses when that session is removed | 102 of 426 (23.94%) | 100 of 426 (23.47%) |
In this guide's study, dropping the single largest session reversed the sign of ease of movement in about one window in four. The most extreme ES case was December 26, 2024, when the line read -15.76 but the other 13 sessions averaged 4.90. On NQ, June 30, 2026 read -126.33 while the other 13 averaged 1,861.44.
Acting on the sign without checking whether one bar carries it means trading that one bar with extra steps.
Zero Line Crossovers on the Movement Line Tested Over Two Years
The textbook ease of movement signal is the zero line crossover. cTrader's documentation frames it as a buy signal when EMV crosses above zero and a sell signal when it crosses below. StockCharts members can scan for both crossings. Here is what they did on the 14-period line in this guide's study of Yahoo Finance ES and NQ daily bars from November 2024 to November 2026, measured close to close against each market's own base rate across all defined sessions.
| Zero line test, 14-period line | E-mini S&P 500 | E-mini Nasdaq-100 |
|---|---|---|
| Upward crossings | 24 | 23 |
| Next session higher after an upward crossing | 15 of 24 (62.50%) | 12 of 23 (52.17%) |
| Base rate, next session higher | 51.29% | 54.12% |
| Ten sessions later higher after an upward crossing | 9 of 24 (37.50%) | 8 of 23 (34.78%) |
| Base rate, ten sessions later higher | 56.97% | 55.29% |
| Downward crossings | 24 | 23 |
| Next session lower after a downward crossing | 12 of 24 (50.00%) | 9 of 23 (39.13%) |
| Base rate, next session lower | 48.71% | 45.88% |
| Ten sessions later lower after a downward crossing | 8 of 23 (34.78%) | 13 of 23 (56.52%) |
| Base rate, ten sessions later lower | 43.03% | 44.71% |
In this guide's two-year Yahoo Finance study, the one result that looks good is ES's next session after an upward crossing, 62.50% against a 51.29% base rate. It does not survive a longer horizon. Ten sessions after an upward crossing, ES was higher only 37.50% of the time against 56.97% for an ordinary session. NQ was 34.78% against 55.29%.
Why upward EMV crossings lagged the move
Why would an upward ease of movement crossing do worse than an ordinary session? An upward crossing tends to arrive after a run of rising midpoints has already pulled the average above zero. By the time the line confirms, part of the move is done, and a 14-session average is slow to tell you when it is over.
Downward crossings were mixed. ES's ten-session result ran below its base rate, and NQ's above it. With 23 or 24 events per market, a gap of a few cases moves the percentages by double digits, so none of these eight tests is strong evidence for or against the crossover. What the sample does rule out is treating a crossing as a reliable forecast.
The crossings were also frequent: 28.39 a year on ES and 27.21 a year on NQ, about one every two weeks.
Divergence Between Price and Ease of Movement
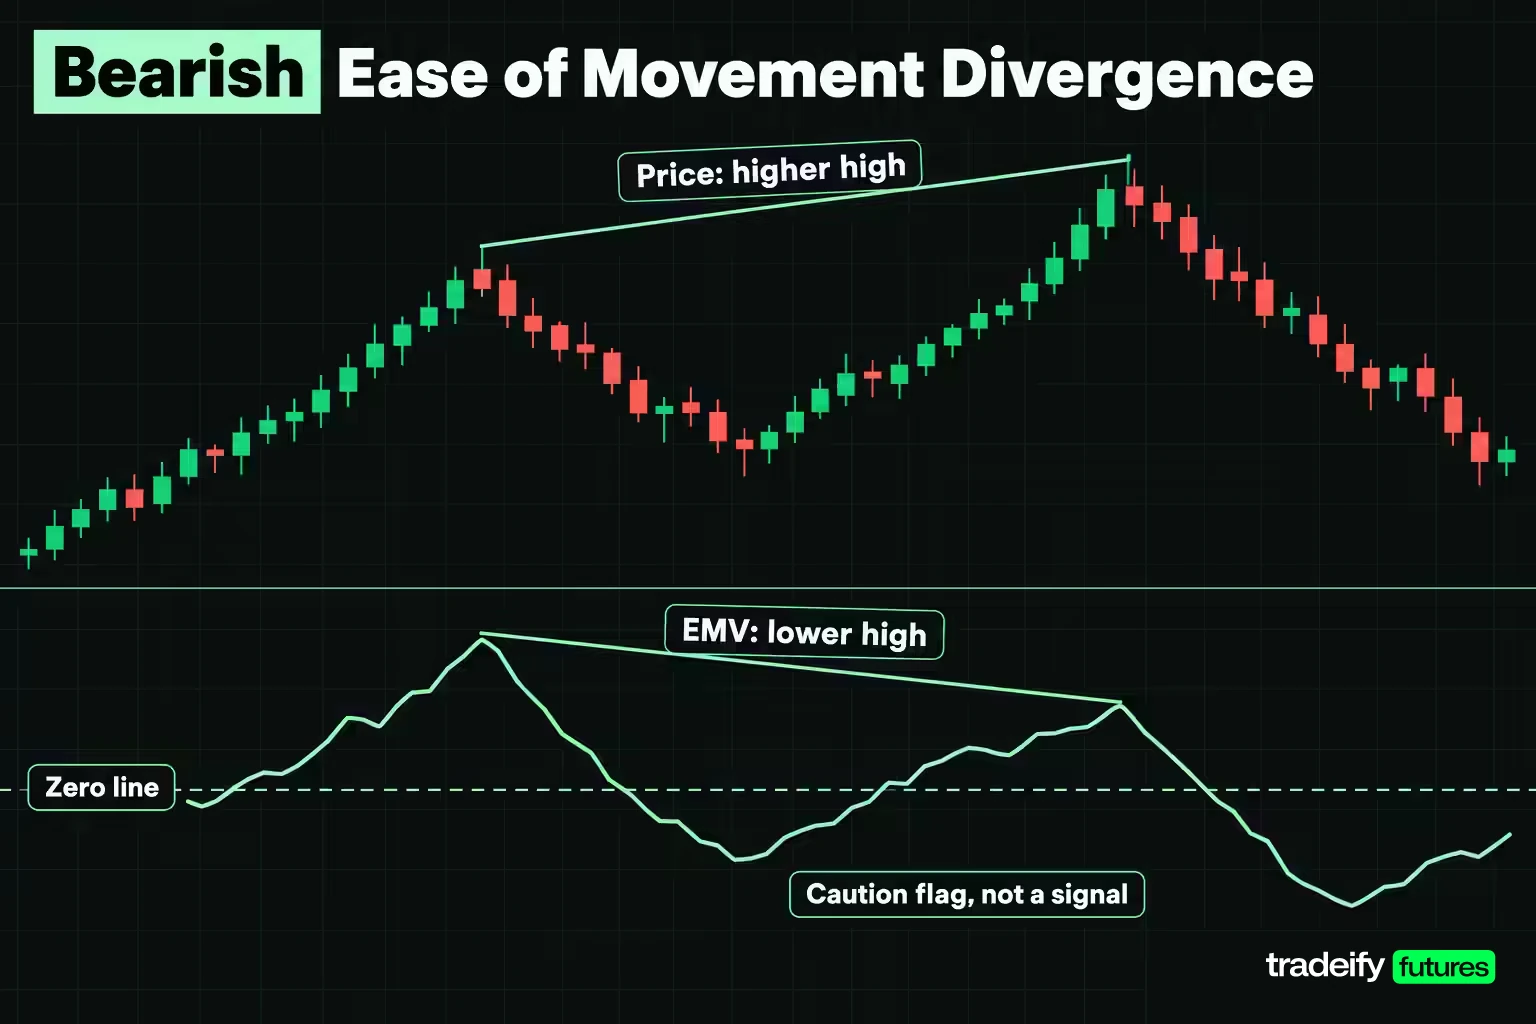
A bullish divergence on ease of movement is a lower low in price with a higher low in EMV. A bearish divergence is a higher high in price with a lower high in EMV. cTrader's documentation reads the bearish case as weakening buying pressure and a possible reversal.
To test the bearish case, this guide's study of Yahoo Finance ES and NQ daily bars took every new 20-session closing high and compared its 14-period ease of movement reading with the reading at the previous 20-session closing high 5 to 60 sessions earlier. A lower reading at the new high counted as a bearish divergence.
| New 20-session closing high | ES higher ten sessions later | NQ higher ten sessions later |
|---|---|---|
| With a bearish divergence | 16 of 36 (44.44%) | 14 of 39 (35.90%) |
| Without a divergence | 16 of 28 (57.14%) | 26 of 35 (74.29%) |
In this guide's ES and NQ study, new highs that came with a weaker ease of movement reading were followed by further gains less often than new highs without one. That leans the way the textbook says. Treat it as a lean, not a rule. Consecutive new highs a few days apart share most of their ten-session outcome, so the cases are not independent, and a few dozen events in one two-year window is a small sample.
The practical use is as a caution flag rather than a short signal. A divergence says the most recent push higher took more volume per point than the last one. It does not say when, or whether, price turns. A trader who shorts every divergence is betting on the timing the indicator never claimed to provide.
Using EMV to Confirm Price Breakouts
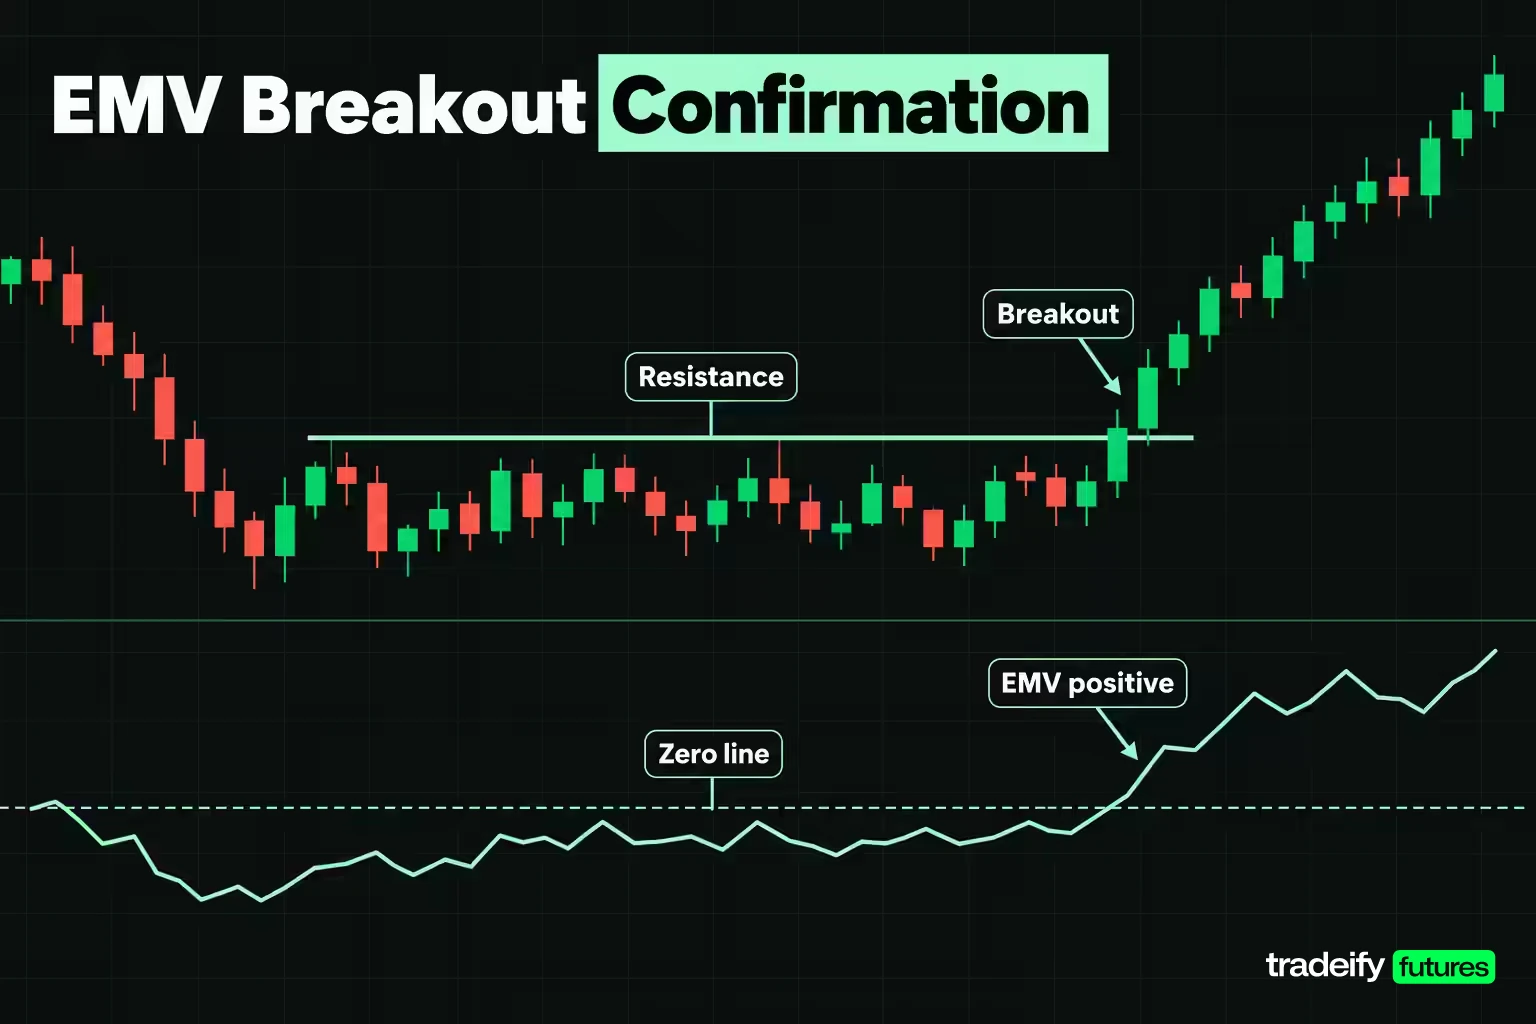
Confirmation is the use StockCharts recommends most: a breakout on the price chart, confirmed by ease of movement moving into positive territory, or a breakdown confirmed by a move into negative territory.
This guide's two-year study of Yahoo Finance ES and NQ daily bars measured how often that confirmation was already in place on a breakout, and what it was worth.
| Event on the daily chart | E-mini S&P 500 | E-mini Nasdaq-100 |
|---|---|---|
| New 20-session closing highs | 68 | 76 |
| Ease of movement already positive at the new high | 61 of 68 (89.71%) | 71 of 76 (93.42%) |
| Higher ten sessions later when confirmed | 30 of 61 (49.18%) | 38 of 71 (53.52%) |
| Base rate, ten sessions later higher | 56.97% | 55.29% |
| New 20-session closing lows | 33 | 34 |
| Ease of movement already negative at the new low | 33 of 33 | 34 of 34 |
| Lower ten sessions later when confirmed | 12 of 33 (36.36%) | 13 of 34 (38.24%) |
| Base rate, ten sessions later lower | 43.03% | 44.71% |
Here is the catch. In this guide's study, confirmation was almost always present. Nine in ten new highs already had a positive ease of movement reading, and every new low had a negative one. That makes sense, because a new closing high after a rise in midpoints will usually carry a positive distance moved. But a filter that passes 90% of cases filters almost nothing, and the confirmed breakouts did no better than an ordinary session.
The rare unconfirmed cases are the interesting ones: 7 new highs on ES and 5 on NQ with ease of movement still negative. That is too few to measure. What they do tell you is worth a second look: a breakout made on heavy volume per point of progress, which is the opposite of the "easy" move the indicator is built to describe.
Related lesson: Breakout trading
Combining EMV With Volume, RSI and Moving Averages
Ease of movement is built from distance, range and volume, so pairing it with a tool that measures the same thing adds nothing. The useful pairings fill a gap it has.
- A plain volume study. TradingView notes that many analysts run a standard volume indicator next to ease of movement. It shows whether a small reading came from heavy volume or a tiny midpoint change, which the line alone cannot separate.
- RSI. cTrader suggests the Relative Strength Index for overbought and oversold context, and StockCharts shows ease of movement confirming RSI crosses of 50. RSI is built from closes, ease of movement from midpoints and volume, so they can disagree in useful ways.
- Moving averages. cTrader also suggests moving averages to smooth short-term noise. A price moving average gives the trend context, while ease of movement says whether the move along it has been easy or labored.
- Average true range. ATR is a better tool for stop distance than ease of movement, because it is measured in points and ease of movement is not.
The pairing to avoid is two volume-weighted momentum readings at once, such as ease of movement and a money flow line, read as two independent confirmations. They share inputs. When they agree, that is one opinion counted twice.
Related lesson: Relative strength index rsi
Ease of Movement Settings and Smoothing Length
Ease of movement has two settings that matter: the length of the moving average and the divisor. The divisor only rescales the line. The length changes how often it changes its mind.
StockCharts and TradingView both default to 14 periods, and StockCharts notes that a longer lookback gives a smoother line. Here is what the length did on the study window.
| Smoothing length | Defined sessions | ES zero line crossings per year | NQ zero line crossings per year | ES share above zero | NQ share above zero |
|---|---|---|---|---|---|
| 1 period (unsmoothed) | 495 | 99.27 | 94.69 | 54.75% | 56.77% |
| 3 periods | 483 | 52.17 | 53.74 | 56.31% | 56.31% |
| 14 periods | 426 | 28.39 | 27.21 | 52.82% | 45.77% |
| 30 periods | 362 | 16.01 | 20.19 | 48.34% | 40.06% |
On ES, the unsmoothed line crossed zero 195 times in the window, the 3-period line 100 times, the 14-period line 48 times and the 30-period line 23 times. Going from 3 to 14 periods cut crossings by more than half, and going to 30 halved them again. The share of sessions above zero moved far less.
So the length decides how many decisions the line asks of you, not what it fundamentally says. Choose it from the number of crossings you are prepared to act on, then write it into your plan. Changing it after a losing run until the last loss would have been avoided feels like learning. It is fitting the indicator to a story.
StockCharts also shows an extra moving average laid over the ease of movement line as a signal line. That adds a second set of crossings to the first. If you use one, test it the same way.
Ease of Movement Trading Strategies as Filters and Warnings
Ease of movement trading strategies work best when the line is a filter or a warning inside a plan built on price. This guide's two-year ES and NQ study found no standalone edge in its crossings, so the three common structures here are written as rules you could test yourself:
- Trend filter. Trade only in the direction of a price trend you have already defined, for example price above a rising moving average, and stand aside on long setups while ease of movement is negative. The line will rarely disagree with the trend, so this mainly removes trades in the roughly one window in ten (in this guide's ES and NQ data) where volume says the move has been labored.
- Breakout check. Take a breakout from a defined range, then check the volume context. A breakout with ease of movement still negative, or with one session supplying most of the window, is a reason to cut size or wait for a retest rather than chase.
- Exit warning. While holding a position, treat a bearish divergence or a sharp drop toward zero as a reason to tighten a plan you already have, not as a new trade in the other direction.
Setting stops and targets when trading with EMV
Ease of movement cannot place a stop, because it has no price unit. cTrader's documentation suggests stops below significant support for longs and above resistance for shorts, which is the right place to look. Set the stop from price structure first, then size the position from the stop.
A worked illustrative case with round numbers: a stop 20 points from entry on ES is $1,000 of risk per contract at $50 per index point. On the Micro E-mini S&P 500 (MES), at $5 per point, the same stop is $100 per contract. If your plan allows $200 of risk on the trade, that is two MES contracts and no ES. The ease of movement reading never enters that arithmetic, and it should not.
Targets work the same way: use a prior swing, a measured move or a multiple of ATR. If ease of movement shrinks toward zero while price is still moving your way, that is information about effort, not a price level.
Related lesson: Position sizing
Advantages and Limitations of Ease of Movement
Ease of movement has three genuine strengths, and none of them is prediction.
- Simple. Three lines of arithmetic, easy to reconcile against any platform.
- Adds a volume lens. It shows whether a move took little or a lot of volume per point, which a price chart alone hides.
- Clear zero line. Direction is easy to read at a glance.
The limitations matter more, because they are where traders get caught.
- It mostly restates price. In this guide's ES study, 79.09% of its variance came from the plain midpoint change.
- It lags. As a 14-period average, ease of movement confirms a move after much of it has happened, which fits the weak ten-session results after zero line crossings in this guide's study.
- It is fragile. About one window in four changed sign without its single largest session.
- Thresholds do not travel. Divisor and instrument both change the scale.
- cTrader warns about false signals in low-volume markets and during consolidation.
When zero volume or zero range breaks the EMV formula
Two inputs make the formula undefined, and a third makes it misleading.
| Problem input | What the formula does | Seen in this guide's ES and NQ data | What to do |
|---|---|---|---|
| Zero volume | The box ratio becomes zero, so the reading is undefined | 6 sessions on each market where the data feed reported zero volume for a normal trading day | Treat it as missing data, not a zero reading, and skip any window that contains it |
| High equals low | The range is zero, so the reading is undefined the other way | None across 502 sessions on either market | Expect it on illiquid symbols and very short intraday bars |
| Very thin volume | A normal range on tiny volume inflates the reading without limit | Not visible on index futures, where the lightest non-zero ES session still traded 113,831 contracts | Check the volume is real before trusting a reading many times its normal size |
The zero-volume sessions were June 5, June 18, July 3, July 4, August 29 and November 3, 2025. Four were ordinary full sessions and two sat around the July 4 holiday, so these are gaps in the data, not markets where nothing traded. Because a 14-period value needs 14 clean inputs, those 6 sessions removed 62 of 488 candidate windows, 12.70% of the sample. A platform that prints those days as zero instead of a gap would quietly bend the line.
Repeated volume is the quieter version of the same problem. In the same feed, October 13, 2025 carried a volume figure identical to the session before it on both ES and NQ. In a later read on November 10, 2026, the November 9 bar carried the November 6 volume exactly, which is what a not-yet-updated volume field looks like.
Intraday ease of movement and incomplete bars
StockCharts warns that daily volume is incomplete during the trading day and that volume-based scans should use the last market close. The same applies to any bar still forming. On an intraday chart the current bar's ease of movement keeps changing until it closes, because both its range and its volume are still growing. Judge a reading on a completed bar.
Related lesson: On-balance volume obv
Coding the EMV Indicator in a Spreadsheet or Python
Ease of movement is easy to code, and coding it is the fastest way to find out which version your platform uses.
In a spreadsheet with dates in column A, highs in B, lows in C and volume in D, starting at row 2:
- Midpoint in E3: =(B3+C3)/2, and the same for row 2.
- Distance moved in F3: =E3-E2.
- Range in G3: =B3-C3.
- Box ratio in H3: =(D3/10000)/G3. Use 100000000 instead of 10000 to match the StockCharts form.
- One-period value in I3: =F3/H3.
- 14-period value in J16: =AVERAGE(I3:I16), copied down.
In Python, the same logic is a loop over bars. For each bar after the first, compute the midpoint, subtract the previous midpoint, multiply by the range and the scale, and divide by volume. Then take a rolling 14-value mean.
Two edge cases decide whether the code is trustworthy:
- Return a missing value, not zero, when volume is zero or the high equals the low.
- Do not produce a smoothed value for any window that contains a missing input. A rolling mean that silently skips the gap averages 13 values and labels it 14.
Test the result against the worked chain for November 3, 2026 on ES. If you get -8.37 in the 10,000 form, the code matches.
A Checklist Before Acting on an Ease of Movement Reading
Run these before an ease of movement reading changes a trade:
- Name the divisor and length your study uses. Without them, any threshold you copied is a guess.
- Check the sign against the plain midpoint change. If they agree, the reading is mostly telling you the trend you can already see.
- Find the largest bar in the window. If removing it would flip the sign, treat the reading as provisional.
- Convert the reading to points before calling it big or small.
- Do not treat a zero line crossing as a forecast. In this guide's two-year ES and NQ study, the ten-session outcome after an upward crossing ran below the base rate.
- Confirm the volume behind the line is real, complete and current, especially on the latest bar.
- Set the stop and size from price structure. Write down what would invalidate the trade before the session opens.
On our accounts, every position is intraday and must be closed by 4:45 PM ET, so a daily ease of movement reading works as context for the next session, not as a reason to hold a multi-day swing. If you chart in TradingView, it connects to our accounts through Tradovate only; Rithmic users can chart in Quantower, Sierra Chart, R Trader Pro or Tradesea. Funded accounts are simulated.
Ease of Movement FAQ
What is the ease of movement indicator?
It is a volume-based oscillator, developed by Richard W. Arms Jr., that relates a bar's midpoint change to its volume and range. Positive readings mean prices have been rising with relative ease and negative readings mean they have been falling with relative ease. Most platforms plot a 14-period average.
How is ease of movement calculated?
Subtract the previous bar's midpoint from the current one to get distance moved. Divide scaled volume by the bar's range to get the box ratio. Divide distance moved by the box ratio, then average the last 14 results.
Why do two platforms show different ease of movement values?
Two platforms show different ease of movement values because they use different volume divisors. One divides volume by 100,000,000 and another multiplies by 10,000, a constant factor of 10,000. The sign and every crossing are identical, but the number beside a threshold is not.
What is the best ease of movement setting?
The best ease of movement setting is the length whose signal rate you will actually act on, and 14 periods is the common default. On two years of ES daily bars, a 3-period line crossed zero 52.17 times a year and a 30-period line 16.01 times. Pick the length from the number of signals you will actually act on.
Does ease of movement predict price?
Ease of movement did not predict price in this guide's two-year study. Ten sessions after an upward zero line crossing on Yahoo Finance ES data, the market was higher 37.50% of the time against a 56.97% base rate. The line describes recent movement well and forecasts it poorly.
Which is better for day trading, SMA or EMA?
Neither is better in general. An exponential moving average puts more weight on recent prices, so it has less lag and turns before a simple average, which is steadier and slower. Ease of movement itself is usually smoothed with a simple average.
Is ROC a good indicator?
ROC is a useful momentum gauge but a weak standalone signal. Rate of Change is a pure momentum oscillator that measures the percent change from n periods ago. StockCharts notes its zero line crossovers are prone to whipsaws and its divergences fail more often than not. It answers a different question from ease of movement, which adds volume.
What is the 3-5-7 rule in trading?
The 3-5-7 rule is an informal risk rule of thumb, not an exchange or regulatory rule. A common version says risk no more than 3% of the account on one trade, keep total open risk at or under 5%, and aim for winners of at least 7%. Versions differ on the last number.
Which is the most powerful indicator in trading?
No single indicator is reliably the most powerful, because each one restates price, volume or both in a different way. Ease of movement shows why, since most of its movement on ES was the plain midpoint change. The stronger edge usually comes from rules tested over a meaningful sample.
This article is for education only and is not investment advice. Futures trading uses leverage and can lose more than you expect, quickly. Every measurement here is historical, based on continuous futures data and a stated method, and past behavior of an indicator does not predict future results. Evaluation and funded trading accounts are simulated, and simulated results differ from live trading.


