



TL;DR: OBV indicator lines add a session's volume on up closes and subtract it on down closes. The level is arbitrary, so only slope and turns matter. On a year of ES and NQ futures, a rising line gave ES a modest edge, NQ none, and OBV-confirmed breakouts did no better. Divergences that survived a roll check worked 9 times out of 9, which is too small a sample to trade blindly. Check the volume feed and the contract roll before trusting any OBV reading on futures.
The OBV indicator is one of the oldest volume tools on any charting platform, and it is easy to like. The line climbs, price is still flat, and the story writes itself: someone is accumulating, and price will follow.
The problem is that the story arrives before the evidence. This guide explains what on-balance volume measures, walks through a real calculation row by row, and then audits the most common OBV claims on 251 completed sessions of E-mini S&P 500 (ES) and E-mini Nasdaq-100 (NQ) futures, from November 4, 2025 to November 3, 2026. It also audits the volume data itself, because on futures the feed can break the indicator before the market ever gets a say.
What the OBV Indicator Measures
The OBV indicator, short for on-balance volume, measures whether a market's volume is landing on days that close higher or on days that close lower. It is a cumulative line. Every session either adds its full volume to the running total, subtracts it, or leaves the total alone, depending only on how the close compares with the prior close.
Where the OBV Indicator Came From
The OBV indicator was created by Joe Granville, who introduced on-balance volume in his 1963 book Granville's New Key to Stock Market Profits. It was one of the first indicators to track positive and negative volume flow, at a time when most chart work looked at price alone.
Granville's thesis was that volume precedes price. If more volume shows up on up days than on down days, buyers are absorbing supply, and price should eventually follow. He noted in his research that OBV would often move before price. That idea produced the classic rules still taught today:
- OBV rising while price is flat or falling: expect price to move higher. Chartists call this accumulation.
- OBV falling while price is flat or rising: expect price to move lower. Chartists call this distribution.
- OBV and price moving together: the trend has volume behind it.
Those rules use the same accumulation and distribution vocabulary that later volume tools, such as the Accumulation Distribution Line, also use. They are also claims that can be checked against data, which is what the rest of this guide does.
What the OBV Line Actually Records
Granville's theory explains why traders reach for the OBV indicator, but it helps to be precise about what the line actually records:
- It records direction of the close, not who bought or sold. A session that closes up 0.25 points gets all of its volume counted as positive. Every contract traded that day had a buyer and a seller.
- It records volume, not dollars or size of move. A 5-point up day and a 150-point up day on the same volume add the same amount.
- It has no fixed zero. The level depends entirely on where the running total started, which is why its slope and turns carry the information, not the number.
So when someone asks which indicator shows buy and sell volume, OBV is only a rough stand-in. It splits each session's volume by the sign of the close. A true buy-versus-sell split needs trade-by-trade data (volume delta or footprint tools that classify each trade by whether it hit the bid or the offer), and that is a different measurement.
Related lesson: What is volume
How the OBV Indicator Is Calculated
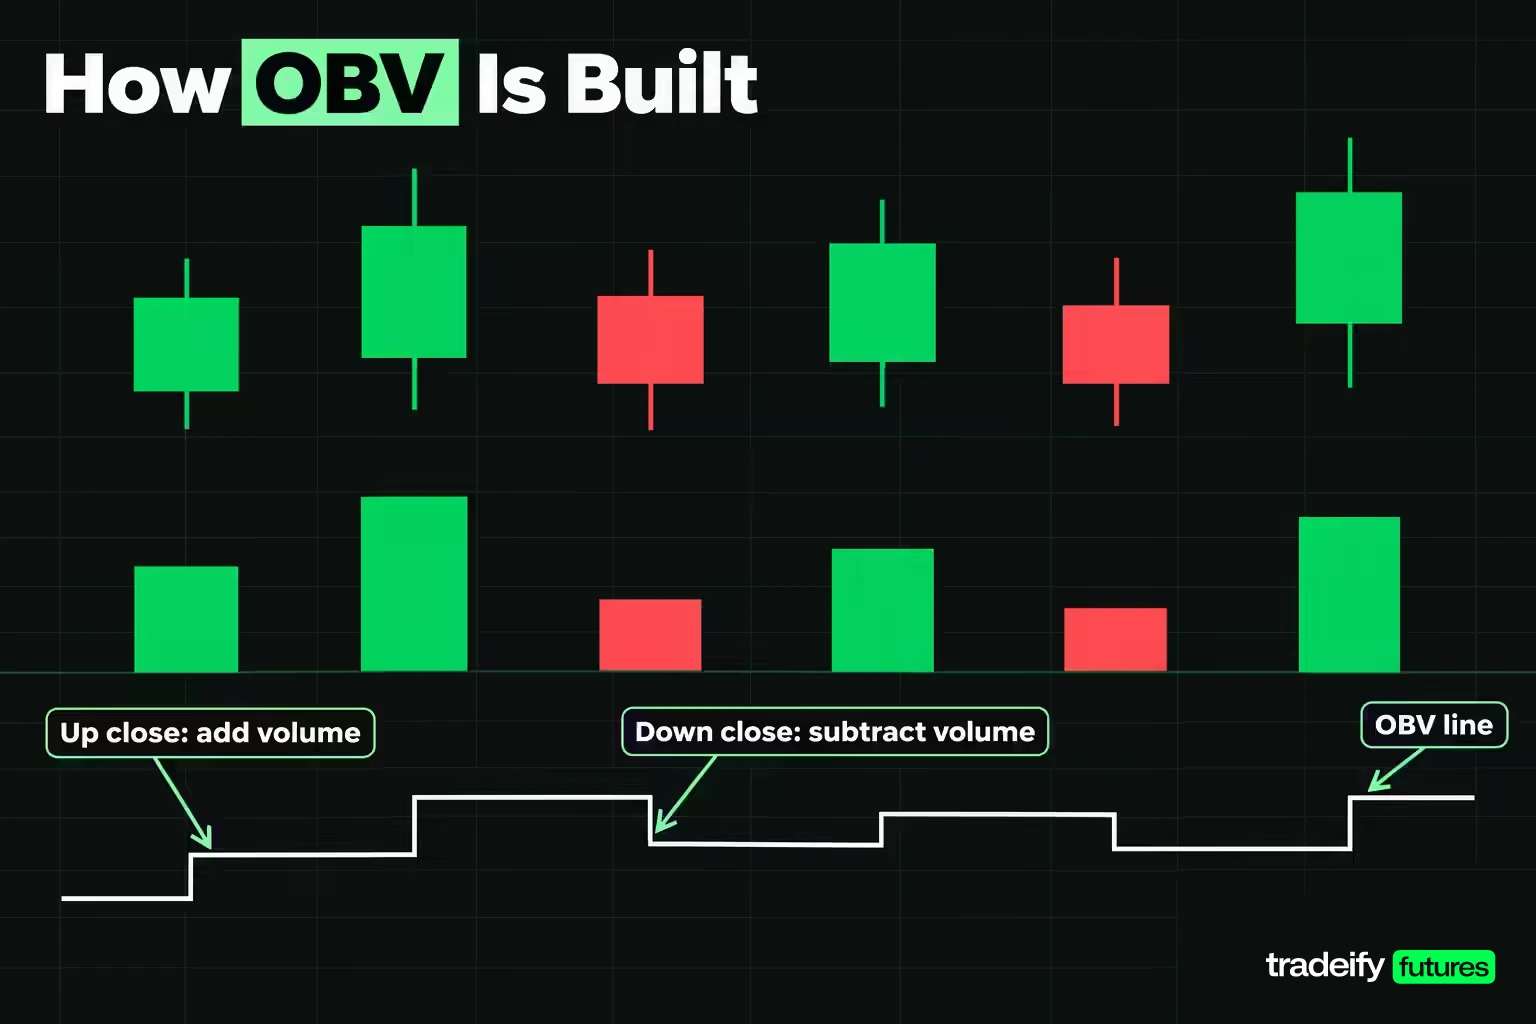
The OBV indicator uses three rules applied to each new session:
- Close above the prior close: OBV equals the prior OBV plus the session's volume.
- Close below the prior close: OBV equals the prior OBV minus the session's volume.
- Close equal to the prior close: OBV is unchanged.
There is no average, no smoothing and no lookback in the core formula. The running total starts at an arbitrary point, usually the first bar loaded on the chart, and every later value is that start plus or minus the sessions since.
The table shows the last 14 completed ES sessions in the study window, using daily continuous-contract closes and volume, with OBV set to zero at the November 3, 2025 close. The prior OBV column carries the total in, so you can recompute any row from the one before it.
| Session | ES close | Change from prior close | Sign | Volume | Prior OBV | New OBV |
|---|---|---|---|---|---|---|
| Oct 15, 2026 | 7,791.00 | +20.75 | + | 1,909,800 | -8,524,747 | -6,614,947 |
| Oct 16, 2026 | 7,704.25 | -86.75 | - | 2,380,698 | -6,614,947 | -8,995,645 |
| Oct 19, 2026 | 7,734.50 | +30.25 | + | 1,740,657 | -8,995,645 | -7,254,988 |
| Oct 20, 2026 | 7,755.25 | +20.75 | + | 1,718,580 | -7,254,988 | -5,536,408 |
| Oct 21, 2026 | 7,800.25 | +45.00 | + | 1,680,253 | -5,536,408 | -3,856,155 |
| Oct 22, 2026 | 7,704.50 | -95.75 | - | 2,274,209 | -3,856,155 | -6,130,364 |
| Oct 23, 2026 | 7,659.75 | -44.75 | - | 1,791,568 | -6,130,364 | -7,921,932 |
| Oct 26, 2026 | 7,714.50 | +54.75 | + | 1,677,784 | -7,921,932 | -6,244,148 |
| Oct 27, 2026 | 7,758.25 | +43.75 | + | 1,556,188 | -6,244,148 | -4,687,960 |
| Oct 28, 2026 | 7,783.25 | +25.00 | + | 1,576,563 | -4,687,960 | -3,111,397 |
| Oct 29, 2026 | 7,754.25 | -29.00 | - | 1,998,904 | -3,111,397 | -5,110,301 |
| Oct 30, 2026 | 7,614.00 | -140.25 | - | 2,539,896 | -5,110,301 | -7,650,197 |
| Nov 2, 2026 | 7,574.50 | -39.50 | - | 2,002,583 | -7,650,197 | -9,652,780 |
| Nov 3, 2026 | 7,596.75 | +22.25 | + | 1,645,013 | -9,652,780 | -8,007,767 |
Reading the OBV Calculation Row by Row
In the ES calculation table, read the last row first. On November 3, 2026 ES closed at 7,596.75, which is 22.25 points above the prior close of 7,574.50. That makes it an up day, so its 1,645,013 contracts are added: -9,652,780 plus 1,645,013 gives -8,007,767.
Now compare October 21 and October 30. The October 21 gain of 45.00 points added 1,680,253. The October 30 drop of 140.25 points subtracted 2,539,896. The calculation saw one session as about one and a half times the other, even though the price move was about three times larger. That gap between move size and volume credit comes back in every honest OBV discussion.
The negative values are not bearish on their own. They exist only because the running total was started on November 3, 2025. Start it a year earlier and every number in the table shifts by the same constant, while every change from row to row stays identical.
How to Read an OBV Chart
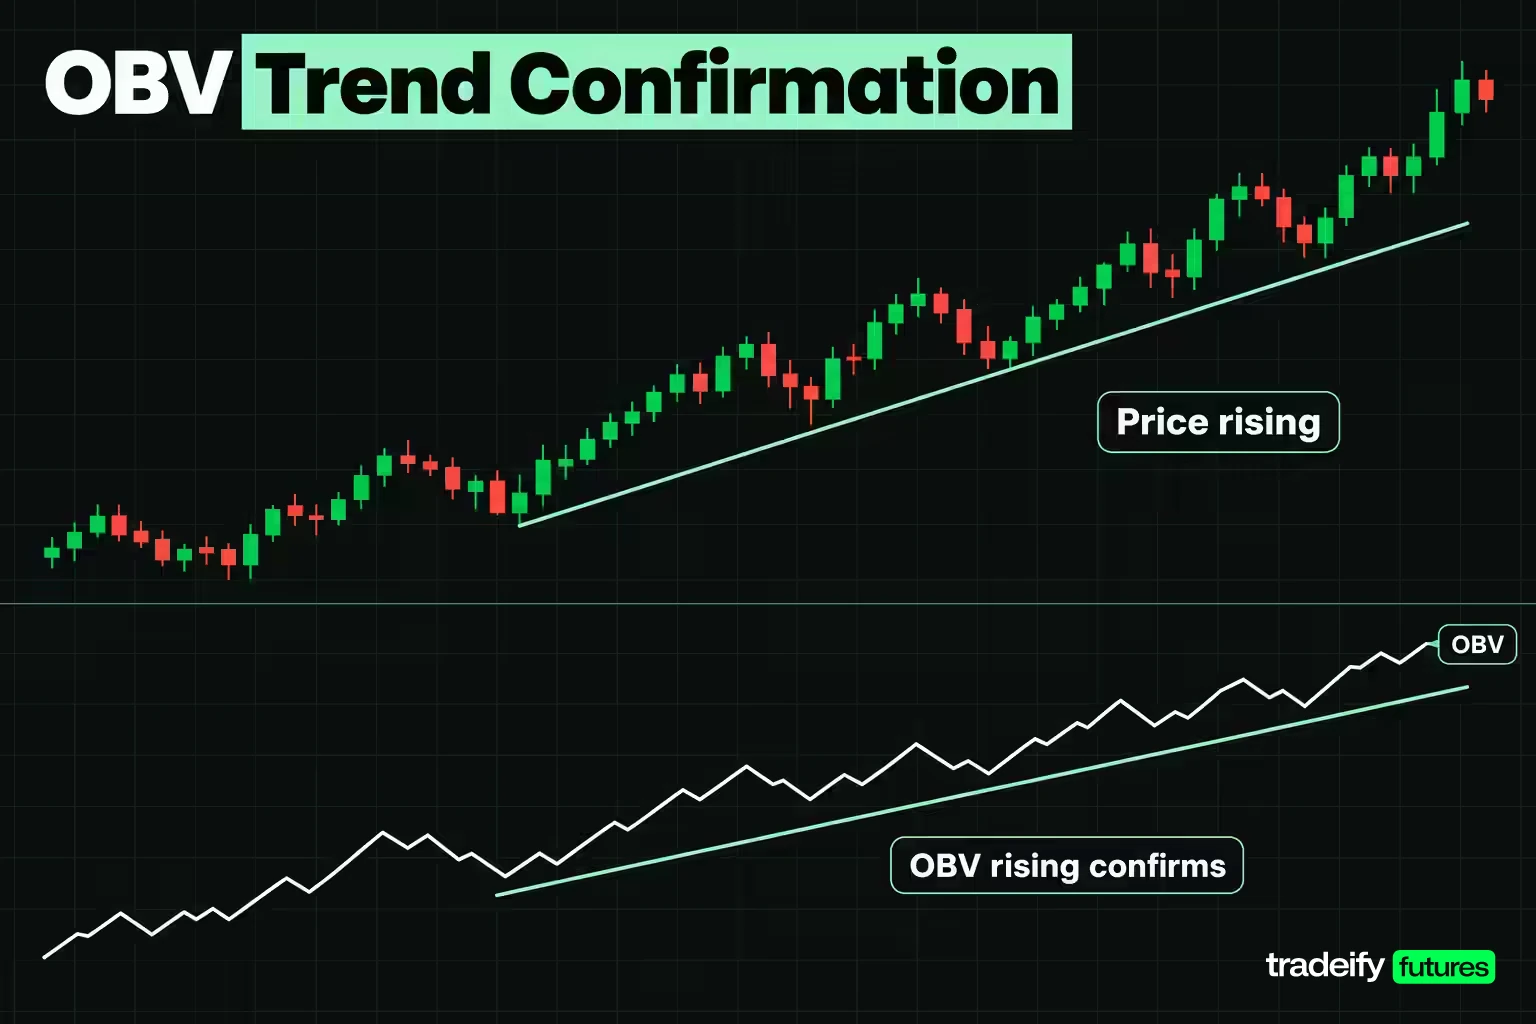
Reading an OBV indicator chart comes down to the shape of the line compared with the shape of price. StockCharts' ChartSchool says the OBV scale is not relevant and does not even display it on its charts. The useful questions are about direction and turning points:
- Is OBV trending, and does that trend match price? Rising price with rising OBV is the textbook healthy uptrend. Rising price with flat or falling OBV says the advance is happening without volume favoring up days.
- Is OBV rising while price moves sideways? Chartists read that as accumulation inside a range, a hint of an upside break. The mirror image reads as distribution.
- Has OBV broken its own support or resistance? You can draw levels and trendlines on the OBV line itself. A break is treated as a signal that the volume trend has changed.
- Read it on closes. OBV is built from closing prices, so divergences and breaks should be judged on closes, not on intraday highs and lows.
OBV vs Price Over a Year of ES and NQ Futures
The textbook OBV reading assumes a healthy uptrend comes with a rising OBV line. A year of index futures data shows how loose that link can be. These figures are this guide's own calculations from Yahoo Finance daily continuous-contract data for ES and NQ, November 4, 2025 to November 3, 2026.
| Measure | ES | NQ |
|---|---|---|
| Sessions | 251 | 251 |
| Price change | +714 points (+10.37%) | +2,202.50 points (+8.44%) |
| Up days and down days | 128 and 123 | 133 and 118 |
| Volume on up days | 187,740,153 | 71,163,963 |
| Volume on down days | 195,747,920 | 71,313,277 |
| Net OBV change | -8,007,767 | -149,314 |
| Net OBV as a share of all volume | -2.09% | -0.10% |
Both index futures gained more than 8% over the year, and both OBV lines finished lower than they started. ES had more up days than down days, but its average down day carried 1,591,447 contracts against 1,466,720 on its average up day. NQ's net figure was a rounding error: -0.10% of the year's volume.
A chartist reading only the OBV indicator would have called that year distribution. Price disagreed by more than 700 ES points (714, to be exact). The plain interpretation is that OBV described where volume landed, not what happened next. Down days in these markets tend to be busier, and a cumulative count of them can drift lower while price climbs.
What Ten Heavy Sessions Did to the OBV Line
A handful of very busy sessions can steer the OBV line for months. In this guide's own count on Yahoo Finance daily ES data, the heaviest session of the year was November 20, 2025, at 2,987,357 contracts, or 2.00 times the median session of 1,491,899. Nine of the ten heaviest ES sessions were down days.
Those ten sessions were only 6.6% of the year's volume, yet their signed total was -20,114,656. Remove them and the ES line finishes the year at +12,106,889 instead of -8,007,767. NQ behaves the same way: nine of its ten heaviest sessions were down days, and without them its line ends at +7,412,874. The sign of the year's OBV reading came down to ten sessions, most of them sell-offs.
That is why ChartSchool warns that volume spikes can throw the OBV indicator off and need a settling period. When you read an OBV chart, find the few biggest volume bars in your window before you read the slope.
Related lesson: Support and resistance
OBV Trend Confirmation Measured
OBV trend confirmation means checking that the OBV indicator is moving the same way as price over the same lookback. If price is up over the last 20 sessions and OBV is also up, the trend counts as confirmed. If they point opposite ways, the move is unconfirmed.
That claim is easy to test. For every session, compare the sign of the price change with the sign of the OBV change over the same number of sessions, and count how often they agree. These figures are this guide's own calculations from Yahoo Finance daily continuous-contract data for ES and NQ, November 4, 2025 to November 3, 2026.
| Lookback | ES sessions compared | ES agreement | NQ sessions compared | NQ agreement |
|---|---|---|---|---|
| 5 sessions | 246 | 80.89% | 247 | 88.26% |
| 10 sessions | 242 | 71.90% | 242 | 86.36% |
| 20 sessions | 232 | 70.69% | 232 | 80.60% |
| 60 sessions | 192 | 55.73% | 192 | 77.60% |
On short lookbacks OBV and price agree most of the time. That is partly mechanical: if the last five sessions closed higher, those same up closes added their volume, so the two lines nearly have to move together.
The longer the lookback, the weaker the link. At 60 sessions, ES price and OBV pointed the same way only 55.73% of the time, barely better than a coin toss. That is the year's volume drift in action: price trended up while the OBV line leaned down.
So what does a confirmed trend actually tell you? Mostly that recent volume is consistent with recent price, which you can already see on the chart. An unconfirmed trend is the more interesting reading, because it invites a question: is one heavy session pulling the line, or has volume genuinely moved to the other side? Treat it as a reason to look closer, not as a sell signal by itself.
Related lesson: Trend following
OBV Divergence Signals on a Year of Futures Data

An OBV divergence is a disagreement between the swings in price and the swings in OBV. A bearish divergence forms when price makes a higher high but OBV makes a lower high. A bullish divergence forms when price makes a lower low but OBV makes a higher low. Both are read as warnings that the move is running out of volume support, and both are the most quoted OBV setups.
The temptation is to sell the second high the moment the OBV indicator fails to confirm it. Before doing that, it helps to know how often the setup appears and what followed. To count them without hindsight, this audit used a strict rule. A swing high is the highest close within three sessions on each side, and a swing low is the lowest close within three sessions on each side. A divergence compares each swing with the one before it. The outcome is the close 10 sessions after the setup.
Over the year, ES printed 23 swing highs and 25 swing lows, and NQ printed 23 of each. They produced 16 divergences, about one every six weeks per market. These figures are this guide's own calculations from Yahoo Finance daily continuous-contract data for ES and NQ, November 4, 2025 to November 3, 2026.
Clean OBV Divergences and What Followed
Ten of the 16 OBV divergences had no contract roll inside either the swing comparison or the 10-session outcome. These are the setups that measure the indicator rather than the data.
| Clean setup date | Market | Type | Close against prior swing | Change 10 sessions later |
|---|---|---|---|---|
| Feb 5, 2026 | NQ | Bullish | 24,651.00 vs 25,129.25 | +416.50 |
| Feb 23, 2026 | NQ | Bullish | 24,762.75 vs 24,767.75 | +228.25 |
| Jul 6, 2026 | ES | Bearish | 7,591.50 vs 7,541.25 | -107.25 |
| Jul 10, 2026 | ES | Bearish | 7,620.25 vs 7,591.50 | -172.75 |
| Jul 29, 2026 | ES | Bullish | 7,351.25 vs 7,445.00 | +419.25 |
| Aug 4, 2026 | NQ | Bearish | 29,863.50 vs 29,316.00 | -277.50 |
| Aug 13, 2026 | NQ | Bearish | 30,188.50 vs 29,863.50 | -492.75 |
| Sep 3, 2026 | ES | Bearish | 7,754.75 vs 7,742.50 | -97.40 |
| Oct 6, 2026 | ES | Bearish | 7,874.00 vs 7,833.50 | -118.75 |
| Oct 23, 2026 | ES | Bullish | 7,659.75 vs 7,704.25 | Not yet known |
All 9 clean OBV divergences with a known outcome moved the expected way within 10 sessions. That is the strongest result in this audit, and it still needs three cautions before it becomes a rule:
- The sample is tiny. Nine setups in a year across two markets.
- Several setups overlap. The ES pair on July 6 and July 10 and the NQ pair on August 4 and August 13 are closer to two events than four.
- The baseline is not zero. ES closed higher 10 sessions later on 55.41% of all sessions, and NQ on 51.80%, so bullish setups in a rising year had a head start.
OBV Divergences Created by the Contract Roll
Six of the 16 OBV divergences had a quarterly contract roll inside them. On a continuous futures chart, the roll swaps the expiring contract for the next one, and the price jumps by the gap between the two months. That jump can manufacture a higher high in price, as it did on September 21, 2026, when ES moved from 7,657.35 to 7,833.50 on the first session of the December contract.
| Roll-touched setup date | Market | Type | Close against prior swing | Change 10 sessions later | Where the roll fell |
|---|---|---|---|---|---|
| Dec 24, 2025 | ES | Bearish | 6,982.50 vs 6,907.25 | +22.50 | In the comparison |
| Dec 24, 2025 | NQ | Bearish | 25,880.50 vs 25,798.00 | +57.75 | In the comparison |
| Jun 10, 2026 | ES | Bullish | 7,278.50 vs 7,378.00 | +144.75 | In the outcome |
| Jun 10, 2026 | NQ | Bullish | 28,554.00 vs 28,924.25 | +1,170.75 | In the outcome |
| Sep 21, 2026 | ES | Bearish | 7,833.50 vs 7,754.75 | -7.25 | In the comparison |
| Sep 22, 2026 | NQ | Bearish | 31,028.50 vs 29,565.25 | +454.75 | In the comparison |
Only 3 of the 6 roll-touched OBV divergences moved the expected way, and two of those outcomes include the roll jump itself. On a continuous futures chart, check the calendar before trusting a divergence: if a quarterly expiry sits between the two swings, the price comparison is partly an accounting artifact.
What OBV Divergence Is Worth
In this one-year audit, OBV divergence earned attention, not automatic entries. A clean OBV divergence is a reason to tighten a trailing stop, skip a late entry in the trend's direction, or wait for price structure to confirm the turn.
OBV Trading Strategies Tested on ES and NQ
Most OBV trading strategies come in four forms: following the direction of the OBV line, trading crossovers of OBV and its own moving average, using OBV to validate price breakouts, and trading breaks of trendlines drawn on OBV. The first three can be tested mechanically on the same year of ES and NQ data.
Rising OBV as a Direction Filter
The simplest OBV indicator strategy says to favor longs while OBV is rising and shorts while it is falling. To test it, each session was labeled by whether OBV rose or fell over the prior 20 sessions, then checked for whether price was higher 5, 10 and 20 sessions later. The fair comparison is the baseline: how often price was higher across all sessions, signal or not. These figures are this guide's own calculations from Yahoo Finance daily continuous-contract data for ES and NQ, November 4, 2025 to November 3, 2026.
| Market and horizon | Sessions with rising OBV | Higher after rising OBV | Higher after falling OBV | Higher across all sessions |
|---|---|---|---|---|
| ES, 5 sessions | 104 | 60.58% | 44.72% | 51.98% |
| ES, 10 sessions | 103 | 65.05% | 47.06% | 55.41% |
| ES, 20 sessions | 103 | 64.08% | 56.88% | 60.38% |
| NQ, 5 sessions | 110 | 51.82% | 48.72% | 50.22% |
| NQ, 10 sessions | 109 | 55.96% | 47.79% | 51.80% |
| NQ, 20 sessions | 100 | 46.00% | 58.04% | 52.36% |
On ES, a rising OBV line came with a modest tilt over 5 and 10 sessions, roughly 9 to 10 percentage points above the baseline. On NQ the tilt was small at short horizons and reversed at 20 sessions, where a falling OBV was followed by higher prices more often than a rising one.
A rank correlation between the 20-session OBV change and the next 20 sessions of price points the same way: 0.077 on ES and -0.0332 on NQ across 212 sessions. A permutation test with 5,000 reshuffles put the chance of seeing correlations that large by luck at 0.2536 and 0.6318. Neither is distinguishable from zero.
There is also a hidden overlap. Neighboring sessions share most of their 20-session history, so 104 signals are far fewer independent observations than they look.
OBV Moving Average Crossovers
A popular refinement smooths the OBV indicator with a moving average and trades the crossings. With a 20-session simple moving average, ES's OBV line crossed its average 27 times in 233 sessions and NQ's crossed 46 times. That is a crossing roughly every nine sessions on ES and every five on NQ.
On a daily chart that is a lot of turning, and every turn is an exit, an entry and a set of costs. Before trading a crossover rule, count its crossings on your own market. If the count looks like noise, a longer average or a price filter has to earn its place.
Breakout Validation With OBV
The breakout version says to trust a new price high only when OBV makes a new high with it. Each session where ES or NQ closed at a new 20-session closing high was split into two groups: OBV also at its own 20-session high (confirmed), or not (unconfirmed). Then price was checked 10 sessions later. These figures are this guide's own calculations from Yahoo Finance daily continuous-contract data for ES and NQ, November 4, 2025 to November 3, 2026.
| Breakout group | ES breakouts | ES higher 10 sessions later | ES mean change | NQ breakouts | NQ higher 10 sessions later | NQ mean change |
|---|---|---|---|---|---|---|
| OBV confirmed | 20 | 12 | +42.53 points | 23 | 14 | +365.96 points |
| OBV not confirmed | 20 | 12 | +48.74 points | 15 | 10 | +422.42 points |
Confirmation changed nothing useful. On ES both groups rose 12 times out of 20, and the unconfirmed group had the slightly larger average. NQ told the same story. Over this year, waiting for OBV to confirm a breakout would have filtered out as many good breakouts as bad ones.
OBV Trendline and Level Breaks
OBV trendline and level breaks are a setup drawn on the OBV line itself: the trader marks support, resistance or a trendline on OBV and acts when the line breaks it, ideally before price breaks its own matching level. This OBV setup resists a mechanical test, because the result depends on which points you choose to connect. Two rules keep it honest: draw the line before the break, not after, and judge the break on a closing basis, since OBV only changes at the close.
How to Backtest an OBV Rule
Every OBV strategy in this section can be tested on your own market with the same five steps:
- Pick the data and write down its source, the date range and whether it is a continuous contract.
- Clean the data first: flag zero-volume sessions, repeated volume figures and roll sessions.
- Write the rule exactly, including the OBV lookback, the entry condition and the holding period.
- Compare the rule's results with the baseline over the same sessions, not with zero.
- Check the sample size and overlap, and test the rule on a period you did not use to design it.
Related lesson: Backtesting a trading strategy
OBV Limitations and False Signals
The OBV indicator's limitations come from its construction: it ignores the size of each move and it gives every session's volume equal weight. Each produces a familiar false signal. On futures, two more come from the data: the quarterly contract roll and errors in the volume feed.
OBV Ignores the Size of the Move
The OBV indicator gives a session its full volume whether price moved one tick or 150 points. To measure how much that matters, the 128 ES up days were sorted by size, and the smallest 64 were compared with the largest 64.
| ES up-day group | Median gain | Largest gain | Total points gained | Volume credited to OBV |
|---|---|---|---|---|
| Smaller half | 19.52 points | 39.50 points | 1,282.71 points | 89,876,189 |
| Larger half | 57.13 points | 182.50 points | 4,635.91 points | 97,863,964 |
The larger half moved price 3.6 times as far, yet it received only 1.09 times the OBV credit. The line cannot tell a drifting session from a decisive one. That is the most common source of a false OBV signal: a string of small, busy up closes can lift OBV while price goes nowhere.
One Heavy Session Can Flip the Line
Volume spikes around news, index rebalances or quarterly expiry can add or subtract more in one session than a week of ordinary trading. Busy down days were common in this sample: the heaviest ten ES sessions in the year were 9 down days and 1 up day. When the OBV line breaks a level, check whether one session did the work.
The Futures Roll Distorts OBV
The futures roll distorts OBV in a way stocks never do. A continuous futures chart has to switch from the expiring contract to the next one each quarter, and that switch hits the OBV line twice.
First, volume collapses in the expiring contract during roll week, because traders have already moved to the next month. On September 17, 2026, the day before expiry, the continuous ES series showed 285,399 contracts, 0.19 times the median session. OBV on those days is built from a contract most traders have already left.
Second, the switch itself creates a price jump. The first session on the new contract compares its close with the old contract's last close on expiry day, so the gap between the two months is counted as a price move. From November 4, 2025 to November 3, 2026, all four ES roll sessions on Yahoo Finance's daily continuous series were scored as up days, adding +6,126,288 to OBV whether or not the market rose. The September 21, 2026 roll moved ES by 176.15 points, and NQ by 1,171.07 points. For scale, on November 4, 2026 the March 2027 ES contract settled 74.75 points above December.
Rescoring those four roll sessions as unchanged pushes the ES net OBV to -14,134,055 and trims the rising-OBV edge at 20 sessions to 63.27% against the 60.38% baseline. The rising-OBV and correlation results in this guide hold either way, but the roll is a real distortion on any continuous futures chart.
Data Feed Errors Feed Straight Into OBV
The OBV indicator is a running total, so a bad volume figure never washes out. It stays in every later value. A free daily feed of the ES continuous contract, checked over two years, showed:
- Six sessions with zero volume (June 5, June 18, July 3, July 4, August 29 and November 3, 2025), so those days added nothing whatever the close did.
- Repeated figures. October 10 and October 13, 2025 both showed 2,570,043. November 3 and November 4, 2026 both showed 1,645,013.
- A stale latest bar. CME's settlement report put December ES volume at 2,329,405 on November 4, 2026. The feed showed 1,645,013, short by 684,392 contracts. That is why this audit ends on November 3.
- A small, steady gap. Where the feed did update, it ran 3.59% and 4.17% above CME's December contract volume on November 2 and November 3, 2026.
None of this means a free feed is useless. It means the latest bar is the least reliable one, and that is exactly the bar a trader acts on. Before you trust today's OBV reading, check that today's volume is a real, updated figure.
Related lesson: Futures rollover
OBV Indicator Settings and Timeframes
The OBV indicator has no lookback setting in its core formula, which surprises traders used to RSI or MACD. What platforms add are optional extras. TradingView's OBV includes smoothing and calculation inputs, and ChartSchool's example chart overlays a 20-day exponential moving average on the line. Smoothing changes how quickly the line turns, not what it measures.
Why Two Platforms Show Different OBV Numbers
Two charts of the same market can show completely different OBV indicator values, and both can be correct. The value depends on the first bar the platform loaded. Started on November 5, 2024, the ES line ends the study window at +11,621,878. Started on November 3, 2025, it ends at -8,007,767. That constant offset of 19,629,645 is 63.59% of the line's entire range over the year.
On NQ the effect is stronger: +14,290,597 against -149,314, an offset of 129.24% of the year's range. One chart shows a strongly positive OBV and the other shows a slightly negative one for the same contracts on the same day. Compare the shape and the turns, never the number.
Choosing a Timeframe for OBV
Timeframe changes what the OBV indicator counts. On a daily chart, each bar is a full session and the sign comes from the settlement close. On a 5-minute chart, the sign comes from each 5-minute close, so OBV becomes a running tally of intraday bar directions. The busiest bars dominate it, and the session close matters far less.
A practical approach is to read OBV on the timeframe whose close you actually care about. A daily OBV line describes the market's context for the day. An intraday OBV line describes the current session, and it resets in meaning, if not in value, every morning.
OBV in Forex and Tick Volume
The OBV indicator needs real volume, and spot forex trades over the counter rather than on one exchange, so there is no single figure for real traded volume. Forex platforms usually show tick volume instead, a count of price updates during the bar. OBV built on tick volume measures how active quotes were on up bars versus down bars, not how much currency changed hands. If you want exchange-reported volume on currencies, currency futures such as the euro contract publish it.
OBV vs Accumulation Distribution and Other Volume Indicators
OBV and the Accumulation Distribution Line both build a running volume total, but they decide each session's sign in different ways. That difference is why they sometimes point in opposite directions.
| Indicator | How each session is weighted | Uses size of the move | Best suited to |
|---|---|---|---|
| On-balance volume (OBV) | Full volume, signed by close versus prior close | No | Quick read of whether volume favors up or down closes |
| Accumulation Distribution Line | Volume times where the close sits in the session's high-low range | Partly, through the close location | Spotting buying or selling inside a session, even on gap days |
| Price Volume Trend | Volume times the percentage change in close | Yes | Weighting big moves more than small ones |
The Accumulation Distribution Line, developed by Marc Chaikin, multiplies volume by a factor between +1 and -1 based on where the close lands within the high-low range. It ignores the change from the prior close completely. A market can gap down, close well below yesterday, and still add to the A/D line if it closes near its high for the day. OBV would subtract that whole session.
Price Volume Trend keeps OBV's close-to-close logic but scales each session's volume by the percentage change, which addresses the magnitude problem directly. If small, busy up days are distorting your OBV reading, PVT is the natural cross-check.
Neither is better than the OBV indicator in general. When OBV and the A/D line disagree, the market is usually closing strong within weak sessions or weak within strong ones, and that disagreement is information worth having.
Related lesson: Accumulation distribution line
Combining the OBV Indicator With ATR, RSI and MACD
The OBV indicator works best next to tools that cover its blind spots, not tools that repeat it. Three pairings each answer a question OBV cannot:
- Size of the move: ATR or the bar's range. OBV cannot tell a quiet day from a big one. Average true range tells you whether a move was large for this market, so you can discount OBV changes made on small ranges.
- Trend and location: price structure or a moving average on price. OBV's direction means more when price is at a level that matters, such as a prior swing high or a moving average the market has respected.
- Momentum: RSI or MACD. If OBV diverges and RSI or MACD shows the same loss of momentum, two different calculations are pointing the same way. If only OBV diverges, one heavy session may be the cause.
Avoid stacking OBV with other volume-direction tools that use the same inputs. OBV, a smoothed OBV and an OBV oscillator will agree with each other most of the time, and that agreement is not independent confirmation.
Turning an OBV Reading Into a Position Size
An OBV indicator signal still needs a stop and a size, and the size usually decides whether the trade is worth taking. As of the November 3, 2026 close, ES's 14-session average true range was 96.59 points. Using CME contract units of $50 per point for ES and $5 per point for Micro E-mini S&P 500 (MES), a stop one ATR away costs:
| Contract | Stop distance | Risk per contract | Contracts within an illustrative $1,000 risk budget |
|---|---|---|---|
| ES | 96.59 points | $4,829.50 | 0 |
| MES | 96.59 points | $482.95 | 2 ($965.90) |
These figures are before commissions and slippage. A one-ATR stop on a single ES contract is 4.8 times that illustrative budget, so the same OBV signal is untradeable at that size on ES and fits on two MES. The ATR figure changes every session and the stop rule is illustrative, but the order of operations is the point: the signal comes first, the stop second, and the size decides whether you take it.
Related lesson: Average true range ATR
A Five-Step OBV Check Before You Trade
The OBV measurements in this guide turn into a short pre-trade check. Run the steps in order, because each one can end the trade before the next.
- Check today's volume. Confirm the latest bar has a real, updated volume figure and that it is not a roll week or a roll session.
- Find the heavy sessions. Identify the few largest volume bars in your window and ask whether they are doing most of the OBV move.
- Compare with price structure. Decide whether OBV agrees with price over the lookback you trade, and whether any divergence is clean or made by a roll.
- Cross-check with a tool that sees size. Use ATR, PVT or the A/D line to see whether the volume story survives once move size is counted.
- Size it. Turn the stop into dollars per contract, and pass if the trade does not fit your risk budget.
If step 1 or step 5 fails, the OBV reading does not matter.
On our accounts every position has to be closed by 4:45 PM ET, and nothing is held overnight or over a weekend. So a daily OBV indicator reading works as context for the session you are trading, not as a reason to hold a position for days. One side effect connects to the roll problem: because positions are closed every day, a contract roll on our accounts just means switching which contract month you trade in the next session. There is no open position to carry across it, but your chart's OBV line still crosses the roll.
Related lesson: Position sizing futures contracts
OBV Indicator FAQ
What does OBV stand for?
OBV stands for on-balance volume. It is a cumulative line that adds each session's volume when the close is higher than the prior close and subtracts it when the close is lower. Joe Granville introduced it in 1963.
Which indicator shows buy and sell volume?
No standard chart indicator truly splits volume into buys and sells from daily bars. OBV only signs each session's whole volume by the direction of the close. Volume delta and footprint tools come closer, because they classify individual trades by whether they hit the bid or the offer.
What is the 3 5 7 rule in stocks?
The 3-5-7 rule is an informal risk guideline that caps risk at 3% of the account on any single trade and 5% across all open trades, and asks that winners be at least 7% larger than losers. It is not an exchange or regulatory rule. It has nothing to do with OBV, but it answers the sizing question an OBV signal still leaves open.
How do you use the on balance volume indicator?
Use it to check whether volume is favoring up closes or down closes, and compare its slope with price over the same lookback. Treat divergences as reasons to look closer, check for heavy sessions and contract rolls, and confirm with a tool that measures size of move. Then size the trade from the stop, not from the signal.
Is a rising OBV always bullish?
No. In this guide's own test on a year of ES data, a rising OBV line came with a modest short-term tilt, but on NQ a falling line was followed by higher prices more often at 20 sessions. A rising OBV says recent volume favored up closes, not that the next move will be up.
Is OBV a leading or lagging indicator?
Granville designed OBV on the idea that volume leads price, and divergences are its leading use. In practice the line is built from closes that have already happened, so it confirms more often than it predicts. The audit here found its forward correlation with price indistinguishable from zero.
OBV Indicator Risk Note
This guide is educational and is not investment advice. The measurements use historical continuous-contract ES and NQ data, not any account's results, and past indicator behavior does not predict future results. Futures are leveraged, so losses can exceed what you expect, and evaluation and funded prop accounts are simulated, with fills that may not match live market liquidity.


