



TL;DR: Front month and back month contracts are different delivery months of one future, each with its own price, volume and deadlines. The front month is the nearest traded month, but the busiest month can sit one step further out. As of November 4, 2026, November gold traded 17 contracts while December gold traded 232,561. The ES December-to-March gap was 74.75 points, or $3,737.50 per contract. Pick the month by volume, check its last trading day and notice dates, and re-mark stops when you roll.
Every futures product trades as a chain of contract months, and the month you pick decides your price, your fills and the date your position has to end. The front month is the nearest one in that chain. The back months are everything behind it.
It sounds like a definition you read once and forget. It is really a decision you make every time you open an order ticket, and the platform often makes it for you. Get it wrong and you pay for it: a thin fill, a stop at the wrong level, or a contract that stops trading days before you thought it would.
What Front Month and Back Month Contracts Mean
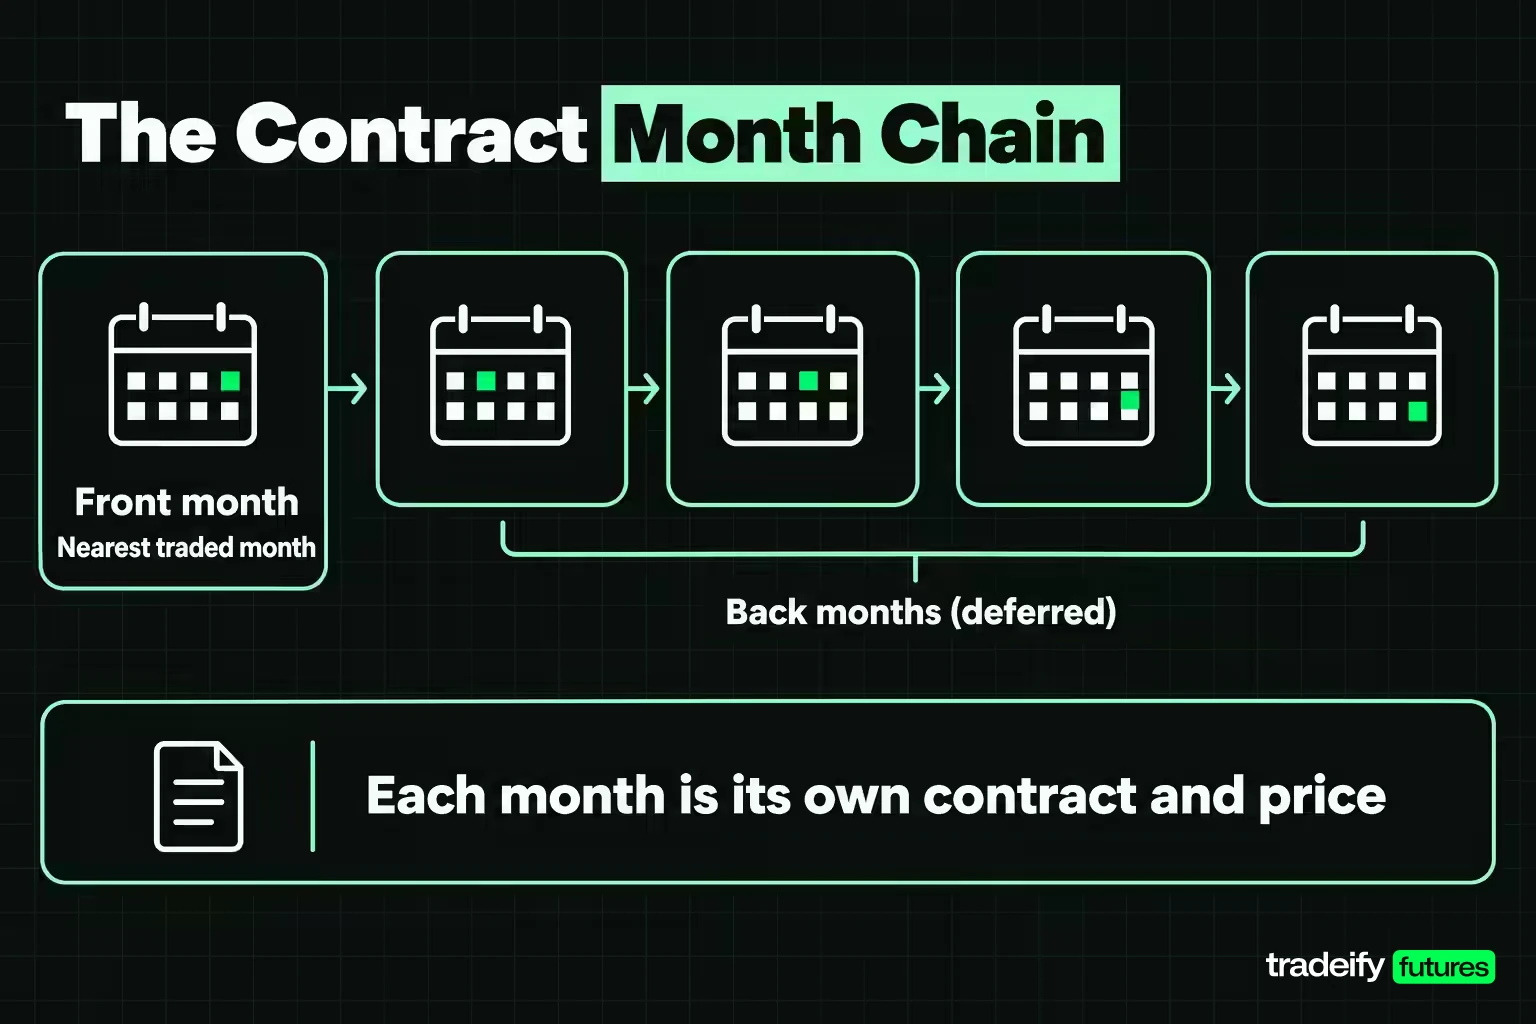
Front month and back month contracts are two positions in the same chain of contract months. The CFTC glossary defines the front month as the spot or nearby delivery month, the nearest traded contract month. It defines back months as every delivery month other than the spot or front month, and it notes they are also called deferred months.
You will see other names for the front month too. The CFTC lists "nearby delivery month" and "lead month" as equivalents, and traders often say "the active month" or "the nearby".
Each month is its own contract with its own price. On November 4, 2026, the December 2026 E-mini S&P 500 (ESZ26) settled at 7,720.50 and the March 2027 contract (ESH27) settled at 7,795.25. Same index, same exchange, same $50 multiplier, and still two different trades at two different prices.
The labels describe a place in the chain, not a fixed month. When the front month expires, the next month in line becomes the new front month, and every back month moves one step closer.
Traders also use the term in a looser, practical way: the front month is wherever the trading actually happens. Usually that is the nearest month. Sometimes it isn't, and that gap between the textbook meaning and the working meaning is where most month mistakes start.
Related lesson: How futures symbols and month codes are built
Why Futures Contracts List Several Months at Once
A futures contract is an agreement for a specific delivery month, so an exchange has to list more than one month to let hedgers and traders lock in prices for different periods. The CFTC defines the delivery month (or contract month) as the month within which a futures contract matures and can be settled by delivery.
Different users need different months. A grain elevator may want to price next March's corn today. A refiner may want crude for January. A day trader in equity index futures only needs whichever month is busiest this week. Listing a chain of months serves all of them at once.
How far out the chain runs depends on the product. CME lists E-mini S&P 500 futures for 21 consecutive quarters. Light sweet crude oil (CL) is listed monthly for the current year and the next 10 calendar years, plus 2 additional months. Most of those far months barely trade, but they exist.
Month codes on a futures contract
Each contract month gets a one-letter code that sits between the root symbol and the year:
| Month | Code | Month | Code |
|---|---|---|---|
| January | F | July | N |
| February | G | August | Q |
| March | H | September | U |
| April | J | October | V |
| May | K | November | X |
| June | M | December | Z |
So ESZ26 is the December 2026 E-mini S&P 500, and CLF27 is January 2027 crude oil. Some platforms print a one-digit year (ESZ6) and some print the full year (ESZ2026). The month letter is what tells you whether you are in the front month or a back month.
Contract Month Cycles by Market
Contract month cycles vary by market, and the cycle decides how often the front month changes. Some products list every calendar month, some only the four quarterly months, and agricultural products follow their crop seasons.
| Market | Product | Listing cycle (CME specs) | How often the front month changes |
|---|---|---|---|
| Equity index | ES, NQ | Quarterly, Mar, Jun, Sep, Dec | Four times a year |
| Energy | CL, NG | Monthly | Every month |
| Metals | GC, SI, HG | Monthly, with extra long-dated months | Every month on paper, less often in practice |
| Currency | 6E | Quarterly, plus serial months | Volume follows the quarterly months |
| Grains | ZC | Mar, May, Jul, Sep, Dec | Five times a year |
| Oilseeds | ZS | Jan, Mar, May, Jul, Aug, Sep, Nov | Seven times a year |
The quarterly cycle (H, M, U, Z) is the one most equity index traders know. On ES and NQ, there is no January or February contract at all. After December comes March.
Monthly cycles look simpler but hide a catch. Gold, silver and copper list every month, yet the trading concentrates in a smaller set of "active" months. According to CME's settlement report for November 4, 2026, December gold carried 86.5% of all gold futures volume, and the next busiest month was February at 8.5%, not January.
Grain cycles follow the crop. Corn has no January contract, and soybeans skip from November straight to January. A soybean trader's "next month" after November is January by design.
Related lesson: The full calendar of upcoming futures expirations
Contract Specifications That Stay the Same Across Months
Contract specifications are the same for the front month and every back month of a product. Only the delivery month, and everything that follows from it, changes.
Here is what stays fixed, using CME's published specs:
| Product | Contract unit | Minimum tick | Tick value | Settlement method |
|---|---|---|---|---|
| ES (E-mini S&P 500) | $50 x S&P 500 Index | 0.25 index points | $12.50 | Financially settled |
| NQ (E-mini Nasdaq-100) | $20 x Nasdaq-100 Index | 0.25 index points | $5.00 | Financially settled |
| CL (Crude oil) | 1,000 barrels | $0.01 per barrel | $10.00 | Deliverable |
| NG (Natural gas) | 10,000 MMBtu | $0.001 per MMBtu | $10.00 | Deliverable |
| GC (Gold) | 100 troy ounces | $0.10 per ounce | $10.00 | Deliverable |
| ZC (Corn) | 5,000 bushels | 1/4 cent per bushel | $12.50 | Deliverable |
And here is what changes from one month to the next:
- Price. Each month settles at its own price every day.
- Volume and open interest. Liquidity can be heavy in one month and almost absent in the next.
- Last trading day and notice dates. Every month has its own deadlines.
- Daily range. Two months can trade slightly different ranges, so a stop sized on one month is not automatically right on another.
One spec detail is worth knowing if you ever trade the gap between two months. ES outrights trade in 0.25-point ticks, but CME lists the ES calendar spread with a 0.05-point tick worth $2.50. The spread between months is its own instrument with its own tick.
Which Month Is the Front Month Right Now
The front month is usually the nearest month, but the month that holds the volume can sit one step further out. The fastest way to see this is to look at real settlement data across several markets on the same day.
The table below uses CME's final settlement report for the session of November 4, 2026. It compares the nearest listed month with the month that carried the most volume. These are dated figures; the same check on a different day can give a different answer.
| Product | Nearest listed month | Its volume | Busiest month | Its volume | Busiest month share of all volume |
|---|---|---|---|---|---|
| ES | Dec 2026 | 2,329,405 | Dec 2026 | 2,329,405 | 99.7% |
| NQ | Dec 2026 | 980,905 | Dec 2026 | 980,905 | 99.7% |
| CL | Dec 2026 | 454,113 | Dec 2026 | 454,113 | 34.8% |
| NG | Dec 2026 | 171,175 | Dec 2026 | 171,175 | 40.6% |
| GC | Nov 2026 | 17 | Dec 2026 | 232,561 | 86.5% |
| SI | Nov 2026 | 4 | Dec 2026 | 64,215 | 82.4% |
| HG | Nov 2026 | 1,574 | Dec 2026 | 84,119 | 79.1% |
| 6E | Nov 2026 | 1,918 | Dec 2026 | 252,333 | 97.7% |
| ZC | Dec 2026 | 191,398 | Dec 2026 | 191,398 | 45.9% |
| ZS | Nov 2026 | 1,242 | Jan 2027 | 151,307 | 46.5% |
In five of the ten products, the nearest listed month was the busiest. In the other five, the nearest month was close to empty. November gold traded 17 contracts that day while December traded 232,561. Pick "the nearest month" from a dropdown in gold, silver, copper, euro FX or soybeans that day and you would have landed in a contract with almost no one on the other side. Nothing on the order ticket warns you.
The share column tells a second story. Equity index volume sits almost entirely in one month: December ES traded about 338 times the volume of March. Crude, natural gas and the grains spread their volume across several months. In crude, the January contract already carried 219,870 contracts, roughly a third of the December plus January total, with December's last trading day 16 days away.
Volume versus open interest across contract months
Volume and open interest usually point at the same month, but not always. Natural gas is the exception in this data: December led on volume (171,175 contracts against 84,401 for January), while January carried more open interest (282,386 against 268,451).
Neither number is wrong. Volume counts what traded during the session. Open interest counts contracts still open, and CME's settlement page shows the previous session's open interest. When the two disagree, positions are migrating, and volume tends to move first.
Expiration and the Last Trading Day of Each Contract Month
Every contract month has a last trading day, and after it that month no longer exists as a tradable contract. CME's own course describes the expiration date as the last day you can trade a contract and notes it is typically the third Friday of the expiration month, but varies by contract. That "varies" is the part that catches people.
Here are the actual rules and the December 2026 dates, from CME's contract specs and product calendars:
| Contract | Last trading day rule | December 2026 contract last trade |
|---|---|---|
| ES and NQ | 9:30 AM ET on the third Friday of the contract month | December 18, 2026 |
| CL | 3 business days before the 25th of the month before the contract month | November 20, 2026 |
| NG | 3rd last business day of the month before the contract month | November 25, 2026 |
| GC | 12:30 PM CT on the third last business day of the contract month | December 29, 2026 |
| 6E | 9:16 AM CT, 2 business days before the third Wednesday | December 14, 2026 |
| ZC | Business day before the 15th of the contract month | December 14, 2026 |
Look at the energy rows. December crude oil stops trading on November 20, and December natural gas on November 25. The month letter says December, but the contract ends in November. The equity index pattern does not carry over to energy.
What happens to an open position at expiry
Before a contract month expires, a trader has three choices, as CME frames it: offset the position, roll it to a later month, or let it go to settlement. Offsetting means taking an equal and opposite trade in the same month. Rolling means closing the expiring month and opening the same position in a later one.
If you do neither, the position goes to final settlement. For a financially settled contract like ES, that means a cash adjustment to a final settlement price; under CME Rule 35803 that price is a special opening quotation of the S&P 500 on the third Friday. For a deliverable contract like crude oil, the delivery process starts, and the delivery month section covers what that involves.
Related lesson: First notice day and last trading day explained
The Delivery Month and How Front Month Contracts Settle
The delivery month is the month in which a front month contract matures and can be settled, and how it settles depends on the product. Some futures end in cash. Others end with an actual commodity changing hands.
- Cash settlement. The CFTC describes cash (or financial) settlement as the seller paying the buyer the cash value of the underlying or an amount based on an index. ES, NQ and the micro equity index contracts settle this way. There is no barrel or bushel to deliver.
- Physical delivery. CL, NG, GC, SI, HG, 6E, ZC and ZS are listed as deliverable. Crude oil, for example, is delivered at Cushing, Oklahoma under CME's rules.
For deliverable contracts, the date that matters is often not the last trading day but the first notice day. The CFTC defines it as the first day on which notices of intent to deliver can be received. For December 2026 gold, first notice day is November 30 while the last trading day is December 29.
That gap explains a pattern in the November 4 settlement data. November 2026 gold passed its first notice day on October 30, yet it still trades until November 25. It is the nearest listed month, technically, but it is already in its delivery period, and only participants who want delivery have any reason to be there. That is why it traded 17 contracts while December traded 232,561.
Most retail traders never take delivery, and many brokers do not allow it. Charles Schwab's futures arm, for example, says it does not let clients take physical delivery and advises rolling ahead of first notice day and the last trading day. If you trade a deliverable contract, check your broker's cutoff, which can come before the exchange's.
Related lesson: How cash and physical settlement differ
Rolling From the Front Month to a Back Month
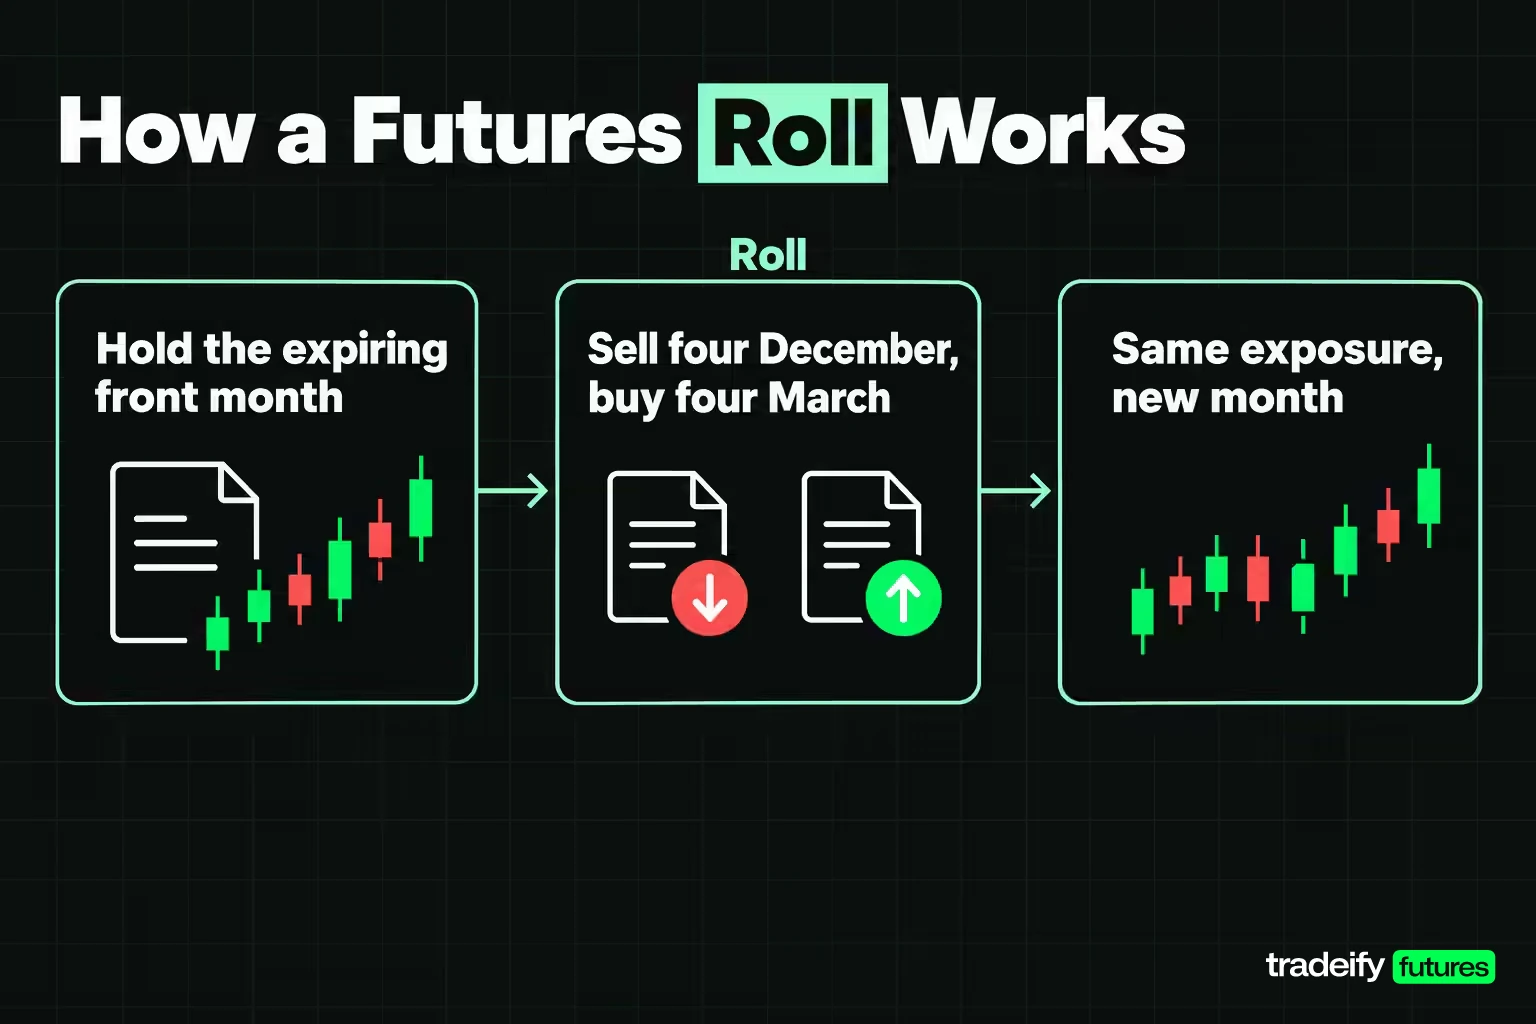
Rolling means closing your position in the expiring front month and opening the same position in a back month. The CFTC glossary calls it lifting a near futures position and re-establishing it in a more deferred delivery month. If you hold four long December ES and want to keep the exposure, you sell four December and buy four March.
When to roll a front month contract
CME's course says traders decide when to roll by watching the volume of the expiring month and the next month, switching when volume in the new month reaches a level they are comfortable with. There is no single correct day.
For equity index futures, CME publishes a roll date: the Monday before the third Friday of the expiration month. For December 2026, that is December 14, four days before the December 18 expiration. After the roll date, the next month is customarily treated as the lead month.
In monthly markets the shift starts earlier and happens more gradually. On November 4, January crude already carried about a third of the December plus January volume, 16 days before December's last trading day. A crude trader waiting for a fixed "roll day" would be watching liquidity drain while they wait.
What changes when you roll to a back month
The position size and the contract stay the same. The price does not, and that affects every level you carried over.
Imagine a trader long December ES at an illustrative 7,700.00 with a stop at 7,680.00, a 20.00-point risk worth $1,000 per contract. Now suppose March trades 75.00 points above December. If the trader opens the March position at 7,775.00, the equivalent stop is 7,755.00. Leaving the old 7,680.00 stop on the March contract would put it 95.00 points away, $4,750 of risk instead of $1,000.
It is an easy mistake to make when you are rolling in a hurry. The rule that prevents it: when you change months, re-mark every level (entries, stops, targets, alerts) on the new month's prices. Never copy them across.
A roll also means two trades, so a two-contract roll is four contract sides of commission and possible slippage. Some traders use the exchange-listed calendar spread to roll both legs in one order, which removes the risk of the gap moving between two separate fills.
Related lesson: A step-by-step guide to the futures rollover
Price Gaps Between Front Month and Back Month Contracts
Front month and back month contracts of the same product almost never trade at the same price, and the gap can be large in dollar terms. Part of it is the cost of carry, which the CFTC describes as the cost of storing a commodity or holding a financial instrument over time, including insurance, storage and interest. The rest reflects what the market expects supply and demand to look like in each period.
Here is the gap between the busiest month and the next actively traded month for each product, using CME settlement prices from November 4, 2026. The dollar figure is the gap times the contract multiplier.
| Product | Busiest month settle | Next active month settle | Gap per contract | Shape |
|---|---|---|---|---|
| ES | Dec 7,720.50 | Mar 7,795.25 | +74.75 points, $3,737.50 | Back month higher |
| NQ | Dec 28,566.75 | Mar 28,884.75 | +318.00 points, $6,360 | Back month higher |
| CL | Dec $88.12 | Jan $87.10 | -$1.02, -$1,020 | Back month lower |
| NG | Dec $2.959 | Jan $3.432 | +$0.473, $4,730 | Winter month higher |
| GC | Dec $4,073.00 | Feb $4,106.80 | +$33.80, $3,380 | Back month higher |
| SI | Dec $52.282 | Mar $52.936 | +$0.654, $3,270 | Back month higher |
| HG | Dec $6.4290 | Mar $6.5310 | +$0.1020, $2,550 | Back month higher |
| 6E | Dec 1.124150 | Mar 1.128500 | +0.004350, $543.75 | Back month higher |
| ZC | Dec 444.25 cents | Mar 458.25 cents | +14 cents, $700 | Back month higher |
| ZS | Jan 1,202.25 cents | Mar 1,210.25 cents | +8 cents, $400 | Back month higher |
On ES, 74.75 points is 299 ticks at $12.50, which matches the $3,737.50 from the multiplier route. On a Micro E-mini with its $5 multiplier, the same gap is $373.75.
Contango, backwardation and seasonal curves
When later months of a futures contract trade progressively higher than the nearest month, the CFTC calls that contango. When distant months trade progressively lower, that is backwardation. In CME settlement prices as of November 4, 2026, ES, NQ, gold, silver, copper, euro FX, corn and soybeans all had the later month priced higher. Crude oil showed the opposite shape: January was $1.02 below December, and February and March sat lower still at $85.76 and $84.27.
Natural gas fits neither label cleanly. As of November 4, 2026, January natural gas was 16% above December, but February ($3.082) and March ($2.443) fell back below it. That hump lines up with winter: the EIA notes that cold weather drives heating demand for gas and that storage is typically drawn down from November through March.
Why the gap matters for your trade
The price gap between a front month and a back month contract is not a fee and it is not a loss. It is the difference between two separate contracts on the same underlying. But it decides three things: where your levels belong after a roll, why a continuous chart jumps, and what a calendar spread trader is actually trading.
The CFTC defines a calendar spread as buying one delivery month and selling a different delivery month of the same contract. A calendar spread trader is not betting on the market's direction. They are betting on the gap between the two months widening or narrowing.
Each contract month is also marked to market separately. The CFTC's definition of the settlement price is the daily price at which the clearing organization settles accounts for each contract month, and CME's mark-to-market course explains that losers pay winners every day at that price. If you hold December and March at once, each leg settles at its own price.
Continuous Futures Charts and Mixed Contract Months
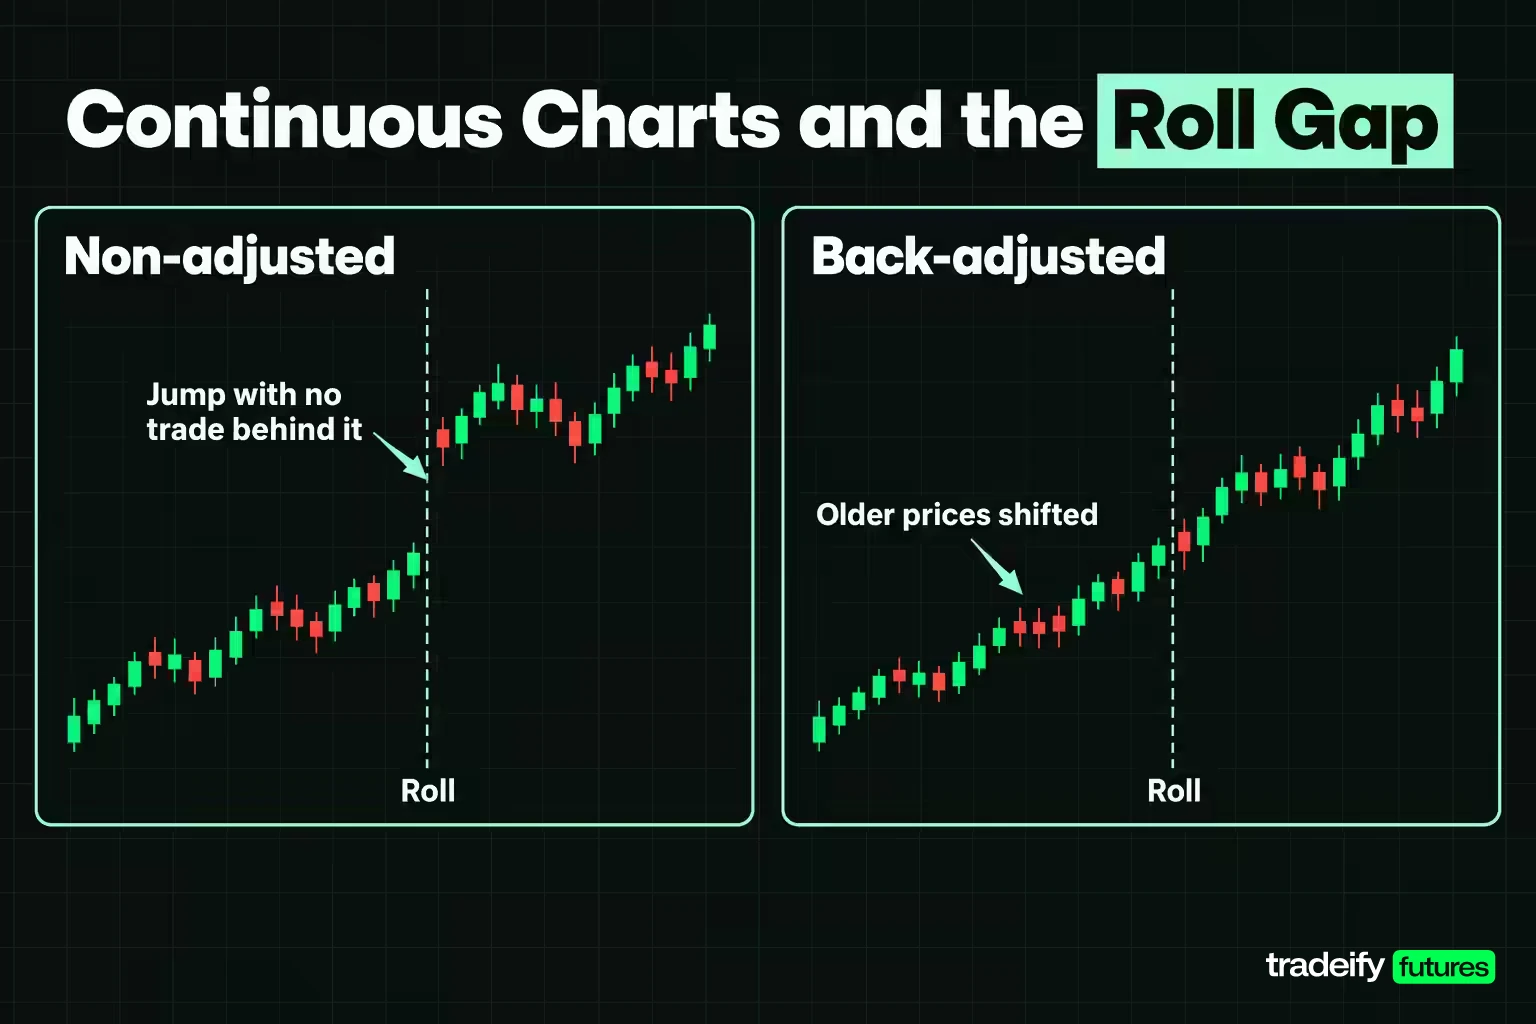
A continuous futures chart stitches several contract months into one long series, switching from the front month to the next month at each roll. It is useful for long-term chart history. It is also the most common reason traders get confused about which month they are looking at.
The problem is the gap. If the next month trades 75.00 points above the old one, a non-adjusted continuous chart prints a 75.00-point jump at the switch, with no trade behind it. Indicators, support levels and backtests built across that jump are measuring the roll, not the market.
Back-adjustment fixes the jump by shifting older prices. TradingView, for example, adjusts all previous contracts by the difference between the closes of the new and old contracts on the daily bar nearest the switch. Its back-adjustment is off by default and is turned on with the B-ADJ button or the "Adjust for contracts changes" setting.
Back-adjusted charts solve one problem and create another: the older prices no longer match what actually traded. A practical approach is to use a continuous chart for long-term context and the dated contract (ESZ26, CLF27) for every level you trade, every stop you place and every order you send.
Related lesson: How continuous futures contracts are built
How to Find the Front Month Before You Trade
Finding the front month takes a few minutes and four checks. Here they are, worked through on crude oil and gold using the November 4, 2026 data.
- Pull up every listed month and sort by volume. For crude, December traded 454,113 contracts and January 219,870. For gold, December traded 232,561, February 22,896 and November 17.
- Check the last trading day of the busiest month. December crude stops trading on November 20, 16 days out. December gold runs to December 29, 55 days out.
- Check notice dates on deliverable contracts. December crude's first notice day is November 24. December gold's is November 30. If your broker closes positions ahead of first notice, that earlier date is your real deadline.
- Price the gap to the next month. January crude was $1.02 below December, $1,020 per contract. February gold was $33.80 above December, $3,380 per contract.
Reading the crude oil and gold results
The crude oil and gold checks came out differently. For gold, December was clearly the front month on November 4, with weeks of runway before first notice. Crude was less clear-cut: December still led on volume, but January was already taking a third of the activity and December's last trading day was close. A crude trader starting a new position that week had a real choice, and the volume trend said the market was moving toward January. If January's share kept climbing over the next few sessions, that would confirm it; if it stalled, December still had room.
Common Mistakes With Front and Back Month Futures
Month mistakes are rarely about skill. They come from skipping a check that takes a minute, usually because the platform default looked fine. These are the common ones.
- Taking the nearest month by default. In five of ten CME products as of November 4, 2026, the nearest listed month was close to empty. November gold traded 17 contracts.
- Carrying stops across months. After a roll, old levels sit at the wrong distance. On ES, a 74.75-point gap is $3,737.50 per contract of misplaced risk.
- Treating a continuous chart as a price. A stitched series can show a level no dated contract ever traded.
- Reading the month letter as the deadline. December crude ends on November 20. December gold's first notice day comes a month before its last trade.
- Trading a thin back month for no reason. As of November 4, 2026, March ES traded 6,882 contracts in a session against 2,329,405 for December. Wider spreads and thinner books come with that difference.
The fix for all five is the same habit: before each session, write down which month you are trading, why, and when it ends.
Front Month and Back Month FAQ
What is the difference between front month and back month futures?
The front month is the nearest traded contract month of a futures product. Back months are all the later months, also called deferred months. Each is a separate contract with its own price, volume and last trading day.
Is the front month always the most liquid?
Not always. On November 4, 2026, the nearest listed month of gold, silver, copper, euro FX and soybeans traded almost nothing, while the next month carried most of the volume. Check volume rather than assuming.
Can you trade back month futures?
Yes. Any listed month can be traded, and hedgers often use back months on purpose. For short-term trading, though, back months usually have less volume and wider spreads than the active month.
Why is the back month price higher than the front month?
Often because of carrying costs such as financing and storage, which push later months higher (contango). It is not always higher: crude oil's January contract settled below December on November 4, 2026, which is backwardation.
What happens if you hold a front month contract until it expires?
It goes to final settlement. A cash-settled contract like ES is settled in cash at the final settlement price. A deliverable contract like crude oil enters the delivery process, which most brokers do not allow retail clients to reach.
Front Month Choice on Intraday Accounts
Front month choice gets simpler on an intraday account where no position survives the session. A day trader who is flat every evening never has to roll a position; the only decision is which contract month to trade when the next session opens. The core habits still apply: trade the month that carries the volume, know that month's last trading day, and re-mark your levels whenever you switch months.
On our accounts, every position has to be closed by 4:45 PM ET and nothing is held overnight, so a roll for you just means switching which contract month you trade next session. Our Help Center suggests trading the contract shown as the current Globex code on the CME calendar, rolling forward and never backward, and avoiding contracts within about two weeks of expiry. Tradovate, Rithmic, WealthCharts and NinjaTrader show a one-digit year (ESH7), TradingView and Tradesea the full year (ESH2027), and TradingView's "1!" continuous symbols are for charts only and can't be traded.
Futures trading involves substantial risk of loss and is not suitable for every investor. Leverage means losses can exceed what you expected, and rolling or switching contract months changes the price your levels are measured against. Prices, volumes and dates in this article come from CME data as of November 4, 2026 and are shown for education only. Results on simulated or funded evaluation accounts are simulated and do not reflect live trading. Nothing here is investment advice.


