



TL;DR: Futures price limits cap how far a contract can trade from the prior settlement in one session, and the limit type sets your exposure. Grains use fixed amounts, such as corn's $0.35 a bushel, while stock index futures use 7%, 13% and 20% bands. Energy, metals and Treasury futures use dynamic circuit breakers that pause trading rather than cap the day. A stop is not an exit in a locked market, so size against the limit band as well as your stop.
Futures price limits are the exchange rules that decide how far a contract may move before trading stops, pauses or freezes at a fixed price. Most days they never come into play. On the days they do, they decide whether your stop fills, how much margin a single session can consume, and whether you can get out at all.
The catch is that there is no single rule. Corn, the E-mini S&P 500 and crude oil each use a different mechanism, and the rule you learned on one contract can be badly wrong on the next.
What Futures Price Limits Are and Why Exchanges Use Them
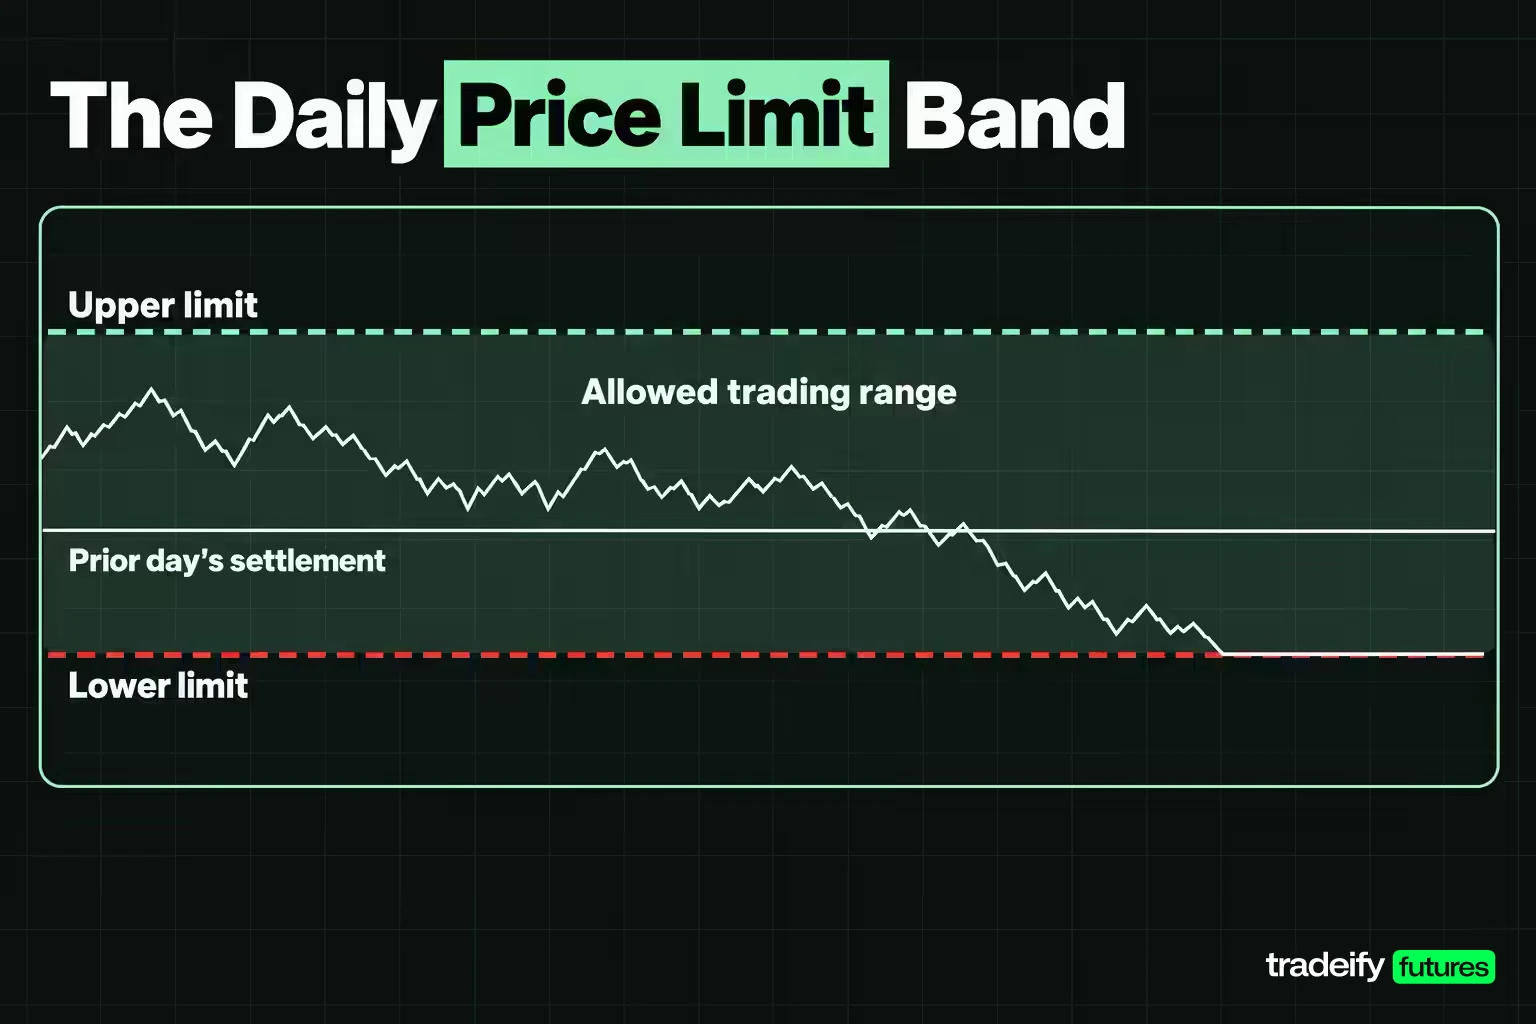
A futures price limit is the maximum price range a contract is allowed to trade in one session. CME Group defines it exactly that way, and the CFTC glossary adds the anchor: the limit is measured as an advance or decline from the previous day's settlement price, as fixed by exchange rules.
The purpose is orderly trading. CME's grain FAQ says price fluctuation limits help restrict a market from moving too far or too fast in a specific period of time. A limit gives the market a forced pause to absorb news, gives clearing firms time to collect margin, and stops a thin order book from printing prices nobody really meant.
Exchanges use three broad kinds of limit, and the kind matters more than the number.
- Fixed amount per unit. Grains and livestock carry a set amount above and below the prior settlement, such as $0.35 per bushel on corn. The dollar risk per contract stays constant while the limit is in force.
- Percentage of a reference price. U.S. stock index futures use 7%, 13% and 20% downside levels during the day and a 7% band overnight, so the point and dollar distance moves with the index.
- Dynamic circuit breakers. Energy, metals, Treasury and crypto futures on CME use a rolling window. A fast move triggers a short pause instead of a hard ceiling for the whole day.
CME's own course notes that agricultural futures go limit up or limit down most often, while equity index futures very rarely if ever do. Rare is not never. A rule that bites once a year still decides what that one session costs you, so the limit belongs in the trade plan.
Related lesson: How limit moves play out on the order book
Who Sets and Oversees Futures Price Limits
Futures price limits are set by the exchange that lists the contract, inside a regulatory framework run by the Commodity Futures Trading Commission (CFTC). The split of responsibilities explains why limits differ so much from product to product.
The CFTC sets the obligation, not the number. Under 17 CFR 38.250 (Core Principle 4), a designated contract market must be able to prevent manipulation, price distortion and disruptions of the delivery or cash-settlement process through surveillance, compliance and enforcement, including real-time monitoring of trading. Under 17 CFR 38.255, it must establish and maintain risk controls that reduce the risk of price distortions and market disruptions, including market restrictions that pause or halt trading in conditions the exchange prescribes.
The exchange writes the actual rule. CME Group operates four designated contract markets (CME, CBOT, NYMEX and COMEX), and each product's limit lives in its rulebook chapter. When limits change, the exchange publishes a Special Executive Report (SER). For grains, CME issues one each April and October ahead of the May and November resets. The latest, SER-9852, raised the corn limit from $0.30 to $0.35 per bushel effective trade date November 2, 2026.
Stock index futures add a third party. CME states that its equity index price limits are designed to coordinate with the circuit breaker provisions applied by the New York Stock Exchange, so the futures and the cash market stop together on a large decline.
Position limits are a separate CFTC tool and are often confused with price limits. The CFTC's position limits cap how many contracts a speculator may hold, and the 2020 rulemaking applies federal speculative position limits to 25 physically settled core referenced contracts, including CBOT corn, NYMEX light sweet crude oil and COMEX gold. A price limit caps how far the price can move. A position limit caps how big your position can be.
How Price Limits Are Calculated
How futures price limits are calculated depends on whether a contract uses a fixed amount, a percentage of a reference price or a dynamic circuit breaker. Each method starts from a settlement price, then applies a different formula.
Fixed price limits on grains and livestock
Grain and oilseed limits are recalculated twice a year. CME collects daily settlement prices over a 45-day period, averages them and multiplies the average by a product percentage. Corn uses 7%, and CME says the percentages were chosen to capture daily price moves 99% of the time. The result is a fixed amount per bushel that stays in force for six months, resetting for the first trade date in May and November.
After the November 2, 2026 reset the corn limit is $0.35 per bushel. One corn contract is 5,000 bushels with a quarter-cent tick worth $12.50, so the limit converts like this.
- $0.35 x 5,000 bushels = $1,750 per contract, or 140 ticks
- Expanded limit of $0.55 = $2,750 per contract
With an illustrative settlement of $4.40, the next session can trade between $4.05 and $4.75 and nowhere else. Mini-sized grain contracts carry the same per-bushel limits as the standard contracts, per SER-9852.
Live cattle works the same way in cents per pound. The current limit is $0.0850 per pound, which on a 40,000-pound contract is $3,400, expanding to $0.1275 and $5,100.
Percentage price limits on stock index futures
Stock index futures use percentages of a reference price instead of a fixed amount. For the E-mini S&P 500 (ES) and Micro E-mini S&P 500 (MES), the reference price is the volume-weighted average price of the lead-month ES between 2:59:30 PM and 3:00 PM CT on the prior trading day.
Which limit applies depends on the clock (CME times in Central, Eastern in brackets).
| Time window CT | Time window ET | Limit in force |
|---|---|---|
| 8:30 AM to 2:25 PM | 9:30 AM to 3:25 PM | Downside only at 7%, 13% and 20% |
| 2:25 PM to 3:00 PM | 3:25 PM to 4:00 PM | Downside only at 20% |
| 3:00 PM to 4:00 PM | 4:00 PM to 5:00 PM | 7% up and down from the 3:00 PM reference |
| 5:00 PM to 8:30 AM | 6:00 PM to 9:30 AM | 7% up and down, plus 3.5% dynamic circuit breakers |
There is no upside limit during U.S. cash hours. The daytime levels exist to slow a crash, not a rally, so a short position in a sharp squeeze has no daytime ceiling working for it.
Here is how those percentages convert at an illustrative reference price of 6,000 on the S&P 500 futures.
| Level | Points from 6,000 | Limit price | Per ES contract | Per MES contract |
|---|---|---|---|---|
| 3.5% dynamic, overnight | 210 | Rolling | $10,500 | $1,050 |
| 7% | 420 | 5,580 | $21,000 | $2,100 |
| 13% | 780 | 5,220 | $39,000 | $3,900 |
| 20% | 1,200 | 4,800 | $60,000 | $6,000 |
The Nasdaq-100 futures use the same percentages on a much higher index level. At an illustrative 21,000, a 7% move is 1,470 points, or $29,400 on one NQ contract at $20 per point and $2,940 on one MNQ.
Dynamic circuit breakers on energy, metals and Treasuries
Crude oil, natural gas, gold, Treasury futures and CME's crypto futures do not have a fixed daily ceiling. CME's price limits page says these products use Dynamic Circuit Breakers (DCBs), with limits that update using a variant derived from the prior day's settlement.
The DCB formula has two parts.
- The variant is the previous settlement multiplied by the product's DCB percentage, rounded down to a tradable tick.
- During the session, a rolling 60-minute look-back window takes the high and the low, then adds and subtracts the variant to set the upper and lower trigger levels.
An illustrative crude oil example uses a prior settlement of $80.00 and a 10% variant, which is $8.00, or $8,000 on a 1,000-barrel contract. If the past hour's high is $81.50 and its low is $79.00, the trigger levels sit at $89.50 and $71.00. As the window rolls forward, those levels move with it.
Treasury futures use a fixed variant in points rather than a percentage. CME lists 2.00 points for the 10-Year T-Note, which is $2,000 per contract on a $100,000 face value, and 8.00 points for the Ultra-Bond. Short-term rate futures such as SOFR and fed funds use 50 bps.
What Happens When a Futures Contract Hits Its Price Limit
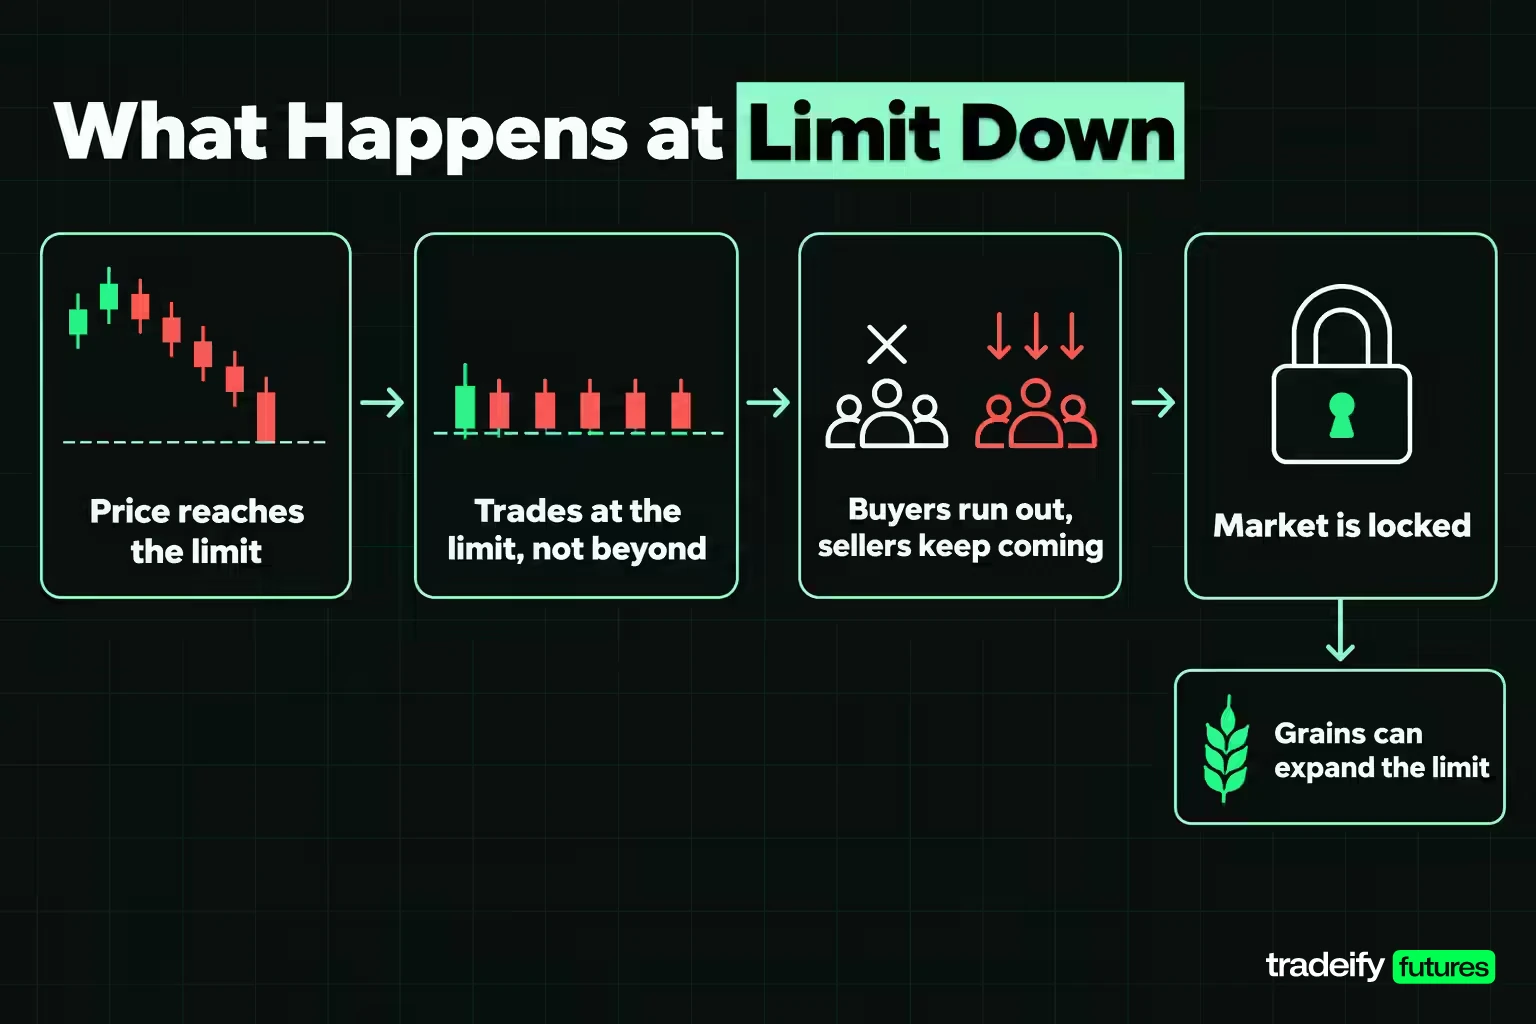
When a futures contract hits its price limit, trading does not simply stop. What happens next depends on the regime, and getting this wrong is how traders end up surprised by their own fills.
A market at its upper limit is "limit up," and one at its lower limit is "limit down." Trading can continue at the limit price but never beyond it. If buyers at the down limit run out while sellers keep coming, the market is "locked": it sits at one price with orders stacked on one side and few or no trades.
Grain limit expansion
Grains move to expanded limits when the market keeps settling at the limit. CME's grain FAQ says expanded limits are triggered when any of the first five to eight listed non-spot contract months settles at limit, are approximately 50% higher than the normal limit, and stay in place until no contract settles at limit. For corn that means $0.55 instead of $0.35. Expansion is linked across related products. The soybean complex (soybeans, meal and oil) expands together, as do Chicago and KC wheat.
Two exceptions matter near expiry. The spot month is not subject to limits, and grain limits are removed on the business day before first notice day. CME's course explains why: in physically delivered markets, limits are lifted before expiration so the futures price can converge on the cash commodity.
Stock index futures halts and limit expansion
E-mini S&P 500 futures follow a stricter rule than many traders assume. CME's S&P 500 FAQ says ES and MES halt if, and only if, an NYSE Rule 7.12 market-wide halt is triggered in the cash market. A 7% drop in the futures alone does not halt trading or expand the limit. The futures keep trading at or above the limit, and an offer entered below the prevailing down limit is rejected.
If the cash S&P 500 falls 7% or 13% before 2:25 PM CT, the cash market and the futures both halt. Futures resume 10 minutes after the halt began, with the limit expanded to the next level. A 20% decline ends trading for the day, and futures reopen at 5:00 PM CT that evening for the next trading day.
Dynamic circuit breaker pauses in energy and metals futures
A DCB trigger in the lead month puts every associated contract month into a two-minute pre-open state with no monitoring period. The 60-minute look-back window then restarts from the reopen. In the last five minutes of trading, and in the five minutes before daily settlement, the pause shortens to 5 seconds so the market can still settle.
Orders resting outside the limit
CME notes that traders can still place good-til-canceled or good-til-date orders outside the daily price limits. Those orders wait and become executable once the limits or bands move to include their price.
Price Limits by Futures Contract
Price limits by futures contract vary in type, size and how often they change. This table pulls together common CME Group contracts (grain and livestock limits as published for trade date November 5, 2026; Treasury variants as listed on the same date).
| Contract | Limit type | Current limit | Value per contract | How it changes |
|---|---|---|---|---|
| Corn (ZC) | Fixed per bushel | $0.35, expanded $0.55 | $1,750, expanded $2,750 | Reset each May and November |
| Soybeans (ZS) | Fixed per bushel | $0.90, expanded $1.35 | $4,500, expanded $6,750 | Reset each May and November |
| Chicago wheat (ZW) | Fixed per bushel | $0.55, expanded $0.85 | $2,750, expanded $4,250 | Reset each May and November |
| Live cattle (LE) | Fixed per pound | $0.0850, expanded $0.1275 | $3,400, expanded $5,100 | Set by exchange rule |
| E-mini S&P 500 (ES) | Percentage of reference | 7%, 13%, 20% down; 7% overnight | $21,000 at 7% on an illustrative 6,000 | Recalculated daily |
| Crude oil (CL) | Dynamic circuit breaker | Variant from prior settle | $8,000 at an illustrative $8.00 variant | Recalculated daily, 60-minute window |
| 10-Year T-Note | Dynamic circuit breaker | 2.00 points | $2,000 | Listed variant |
How fixed limits drift as prices change
A fixed limit stays the same in dollars but changes as a share of price. Run corn's $0.35 limit against three illustrative prices.
| Corn price | Contract value | Limit as share of price |
|---|---|---|
| $3.50 | $17,500 | 10.00% |
| $4.40 | $22,000 | 7.95% |
| $5.50 | $27,500 | 6.36% |
Cheap corn can make the limit feel wide in percentage terms, and expensive corn can make it feel tight. The six-month reset exists to pull the limit back into line, because the next 45-day average will reflect the new price level.
Related lesson: Where each product's limit, tick and multiplier are published
Price Limits Versus Circuit Breakers and Position Limits
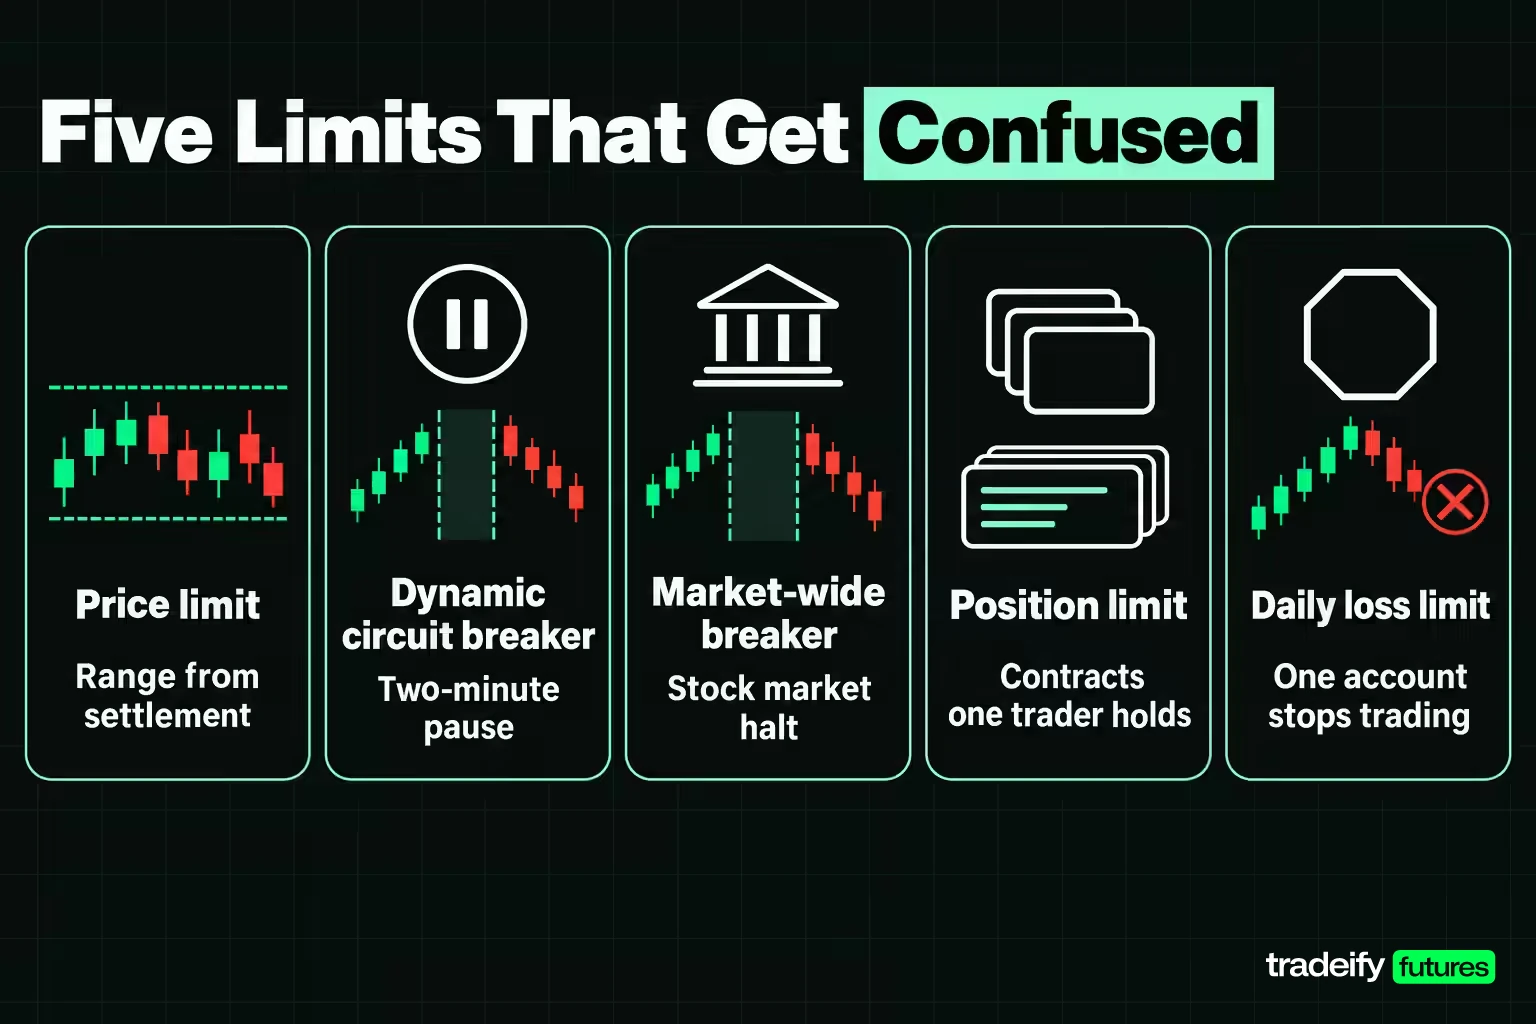
Price limits, circuit breakers and position limits all sound like "trading limits," but they answer different questions. Mixing them up leads to wrong assumptions about when you can trade.
| Rule | What it caps | Who it applies to | What happens |
|---|---|---|---|
| Futures price limit | How far one contract trades from settlement | Everyone in that contract | Trades only within the band, may lock or expand |
| Dynamic circuit breaker | How far a contract moves inside a rolling window | Everyone in that contract | Two-minute pause, then trading resumes |
| Market-wide circuit breaker | S&P 500 decline of 7%, 13% or 20% | All U.S. stocks plus linked index futures | 15-minute stock halt, or the rest of the day at 20% |
| CFTC position limit | How many contracts one trader holds | Speculators in covered contracts | Position cannot exceed the cap |
| Daily loss limit | How much one account loses in a day | One trader or account | Trading stops for that account |
Market-wide circuit breakers belong to the stock market. Investor.gov describes them as halts at 7% (Level 1), 13% (Level 2) and 20% (Level 3) declines in the S&P 500 from the prior day's close, with a Level 1 or 2 halt before 3:25 PM ET lasting 15 minutes. The stock index futures limits use the same percentages so both markets move in step, but S&P 500 futures reopen after 10 minutes, ahead of the stocks.
When someone asks what a "trading limit" means, the answer depends on context. On an exchange it usually means the daily price limit. At a regulator it may mean a position limit. At a broker or prop firm it usually means a loss limit on the account.
Related lesson: How market-wide halts work for stocks and futures
How Price Limits Relate to Margin and Leverage
Price limits relate to margin because one limit move can be larger than the money posted to hold the position. That is the leverage problem in plain numbers.
The CFTC says futures margin is typically between 2% and 10% of the contract's value. Margin is a performance bond, and brokers often require more than the exchange minimum. Now compare that range with the limit.
At an illustrative $4.40, one corn contract is worth $22,000 and its $1,750 limit is 7.95% of that value. Depending on where margin sits inside the 2% to 10% range, a single limit-down day can eat most of the margin or all of it, and a second day at the expanded $0.55 limit goes past it.
Stock index futures make the same point with bigger numbers. Against an illustrative $50,000 account, the 7% distance on one ES at 6,000 is $21,000, or 42% of the account. The 13% distance is $39,000, or 78%, and the 20% distance is $60,000, or 120%. One MES carries a 7% distance of $2,100, which is 4.2% of the same account.
This is why the question of how much money you need to trade futures has no single number. The exchange margin is the minimum to open a position. The amount you need to survive a bad session depends on the contract size you pick and how far that contract can move before you can act.
How Futures Price Limits Affect Trading Decisions
Futures price limits affect trading decisions mainly through exit risk. A stop-loss order is an instruction, not a guarantee, and a locked market can leave that instruction waiting for a buyer that does not show up.
A worked limit-down example in corn
Take an illustrative trader long 2 corn contracts at an illustrative $4.40 with a sell stop at $4.30. The planned risk is $0.10 per bushel, or $500 per contract and $1,000 on both.
- Overnight news hits. Corn opens at limit down at $4.05 and stays locked all session. The stop is triggered but there are no buyers, so it does not fill. The position is marked down $0.35, which is $1,750 per contract and $3,500 on two.
- Corn settled at the limit, so expanded limits apply the next day. The band is now $0.55 either side of $4.05, which runs from $3.50 to $4.60.
- The market trades off the limit and the stop finally fills at $3.70. The loss is $0.70 per bushel, or $3,500 per contract and $7,000 on two.
The trader planned to lose $1,000 and lost $7,000, which is 7 times the plan. Nothing was wrong with the order. The limit removed the other side of the trade, and the stop could only act once buyers came back.
Trading habits around futures price limits
- Size against the band, not only the stop. Ask what the position costs if the market locks at the limit, then check that the number fits the account.
- Know when your contract is exposed. Grain limits apply in every session, and stock index futures switch to the overnight 7% band while the cash market is closed.
- Expect order rejections near the limit. An offer below the prevailing down limit in ES is rejected, so plan where you would rest a limit order instead.
- Resist adding to a position pinned at the limit. A locked market can look like a bargain, and that is the temptation. The next session may open at an expanded limit in the same direction.
Related lesson: Sizing a position so the limit band fits the account
Historical Limit Moves and What They Showed
Historical limit moves show how the rules behave under real pressure, and why exchanges sometimes change them afterward.
March 2020 stock index futures
In March 2020, the E-mini S&P 500 futures hit their overnight limit-down several times. The NYSE's Market-Wide Circuit Breaker Working Group report records that the futures reached their limit-down state, which was a 5% decline at that time, overnight before March 9, 2020. That morning the S&P 500 crossed its 7% Level 1 threshold at 9:34:13 AM and closed down 7.6%.
The pattern repeated. On March 12 the Level 1 halt came at 9:35:44 AM and the index closed down 9.5%. On March 16 the futures were again limit down overnight, and the cash market crossed 7% at 9:30:01 AM, one second after the open, closing down 12%.
The report's review led to a rule change. Effective October 12, 2020, CME widened the overnight equity index limit from 5% to 7%, with 3.5% dynamic limits overnight. The 7% overnight band traders see today comes directly from that episode.
April 2020 crude oil
Crude oil shows what happens in a market with dynamic circuit breakers rather than a fixed daily ceiling. The CFTC's interim staff report found that the May 2020 WTI contract fell from $17.73 per barrel to settle at -$37.63 on April 20, 2020, the day before expiry. It was the first negative price in the contract's 37 years.
The CFTC noted that the speed and size of the moves between 1:00 PM and the 2:30 PM ET settlement were exceptional despite exchange control mechanisms designed to impose pauses. Pauses slow a market down. They do not set a floor.
Related lesson: How the daily settlement price sets the next session's limit
A Price Limit Check Before You Trade
A price limit check takes a few minutes and is worth doing for any contract you do not trade every day. Do it before the session, because a locked market is the worst time to start reading rulebooks.
- Identify the regime. Is the contract on a fixed limit, a percentage limit or a dynamic circuit breaker? The exchange's price limits page and the product's contract specifications say which.
- Read the current limit for the session. Grain limits change in May and November, stock index levels move with each day's reference price, and DCB levels roll every hour.
- Convert the limit to dollars per contract. Multiply the limit in price units by the contract size, as in $0.35 x 5,000 bushels = $1,750 for corn.
- Compare the dollars with your account and daily loss limit. If a single limit move is a large share of the account, that is the real ceiling on position size, whatever your stop says.
- Decide how you would exit. Know whether your platform holds stops on the exchange or on a server, whether a stop-limit could be left unfilled, and where a resting order would sit if the market locks.
Price limits and prop firm session rules
On our accounts, every position has to be closed by 4:45 PM ET and nothing is held overnight, so open positions are closed automatically at the market close and may get slippage. CME halts stop trading on every platform, and we don't compensate losses during CME halts because they affect all market participants equally. Our supported list includes limit-bound grains and livestock such as ZC, ZS, ZW and LE alongside ES, NQ, CL and GC, so knowing each product's price limit matters for the contracts you can trade with us.
Futures Price Limits FAQ
What does "trading limit" mean?
On an exchange, a trading limit usually means the daily price limit, the furthest a contract may trade from the prior settlement in one session. A regulator may use the term for position limits on how many contracts a trader holds. Brokers and prop firms often mean a daily loss limit on the account.
Do all futures contracts have daily price limits?
No. Grains, livestock and U.S. stock index futures have published daily limits. Crude oil, gold, Treasury and crypto futures on CME use dynamic circuit breakers that pause trading rather than capping the day.
Can you exit a position when the market is limit down?
You can send the order, but it fills only if a buyer is willing to trade at or above the limit price. In a locked market the order may wait until the next session, when an expanded limit can produce a much worse fill.
Do price limits protect you from large losses?
No. A price limit caps how far price can move in one session, not how much you can lose. It can prevent you from exiting, and the move can continue in the next session.
How much money should you have to trade futures?
The money you need to trade futures depends on the contract's margin and how far it can move against you, so there is no fixed figure. The exchange sets a minimum margin per contract, and brokers often require more. A sensible amount is one that can absorb a full limit move on your chosen contract size without ending the account.
Know the Price Limit Before You Enter
Before your next trade in a product you do not trade daily, pick the contract, look up its current limit and convert it to dollars per contract. Then compare that number with your account balance and your daily loss limit. If one limit move would break either, trade a smaller size, such as a micro contract where one exists, or skip the trade.
Related lesson: How a full-size and a micro contract differ in sizing
Futures trading involves substantial risk, and leveraged positions can lose more than the amount deposited. Price limits, circuit breakers and contract specifications change, so confirm the current rules with the exchange before trading. All prices and positions in this guide are illustrative, funded and evaluation accounts operate in a simulated setting, and nothing here is investment advice.


