



TL;DR: Position sizing futures contracts starts with the dollars you will lose at the stop, not the margin the broker asks for. Divide your risk budget by the stop distance in ticks times the tick value, then round down. On a $50,000 account at 1%, a 5-point E-mini S&P 500 stop allows 2 contracts and a 20-point stop allows 0. When the full-size contract does not fit, the micro often does, and zero is a valid answer.
You have a setup, a stop level and an account balance. The question is how many contracts to put on, and it is the one decision in the trade you can get exactly right before the market moves.
A lot of futures sizing mistakes start with answering the wrong question. "How many contracts can I afford?" is a margin question. "How many contracts can I lose on without breaking my plan?" is a risk question. Only the second one keeps a futures position size tied to what the account can absorb.
The math is short. The judgment around it is where trades go wrong, so this guide spends most of its time there: the inputs, a worked ladder, what rounding to whole contracts really costs, and how volatility, correlation, scaling and account rules move the number.
Why Margin Is the Wrong Input for Futures Position Sizing
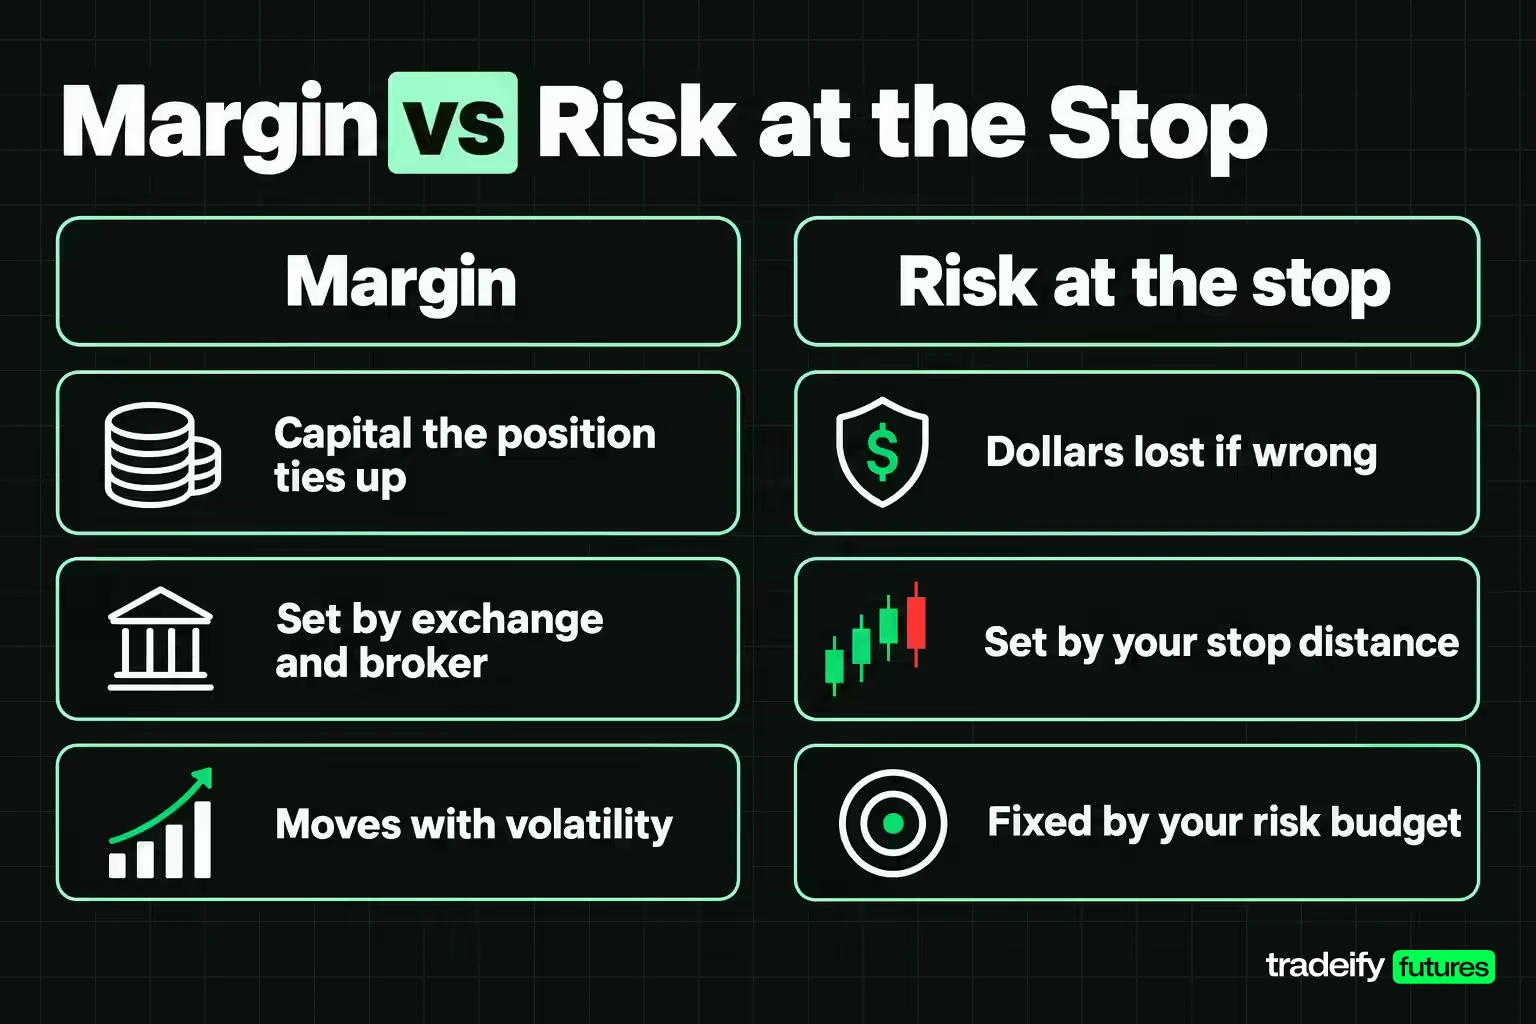
Margin is the good-faith deposit an exchange and broker require to open and hold a futures position. CME Group's education material puts futures margin at typically 3% to 12% of a contract's notional value, and CME Clearing raises margins when volatility rises and lowers them when it falls. Brokers can also require more than the exchange minimum.
That makes margin a capital number, not a loss number. It tells you how much of the account the position ties up. It says nothing about how much leaves the account if the trade is wrong.
Here is the gap in plain arithmetic. The E-mini S&P 500 (ES) is worth $50 times the index. At an illustrative index level of 6,000, one contract controls $300,000 of exposure. A margin of 3% to 12% of that is $9,000 to $36,000, a small slice of the exposure.
Size from that slice and a $50,000 account looks like it can hold several contracts. Size from the stop and it may hold one, or none. Margin answers whether the broker will let you open the trade. Risk answers whether you should.
How Leverage Changes Position Size in Futures
Leverage in futures is the ratio between the notional value you control and the equity in the account. It is not a setting you choose. It is the result of how many contracts you hold.
Using the same illustrative 6,000 index level, one ES contract is $300,000 of exposure. On a $50,000 account that is 6 times the account on a single contract. Two contracts is 12 times.
The consequence shows up in small moves. A 1% loss on a $50,000 account is $500, and $500 on one ES contract is just 10 index points. Ten points on a 6,000 index is a 0.17% move, the kind of move that can happen in minutes on an ordinary session.
So the way to manage leverage is not to watch the margin balance. It is to control the two things that set dollar risk: the number of contracts and the distance to the stop. When those are sized from a risk budget, the leverage takes care of itself, because the position can only be as large as the stop and the budget allow.
Contract Specifications That Drive Position Size
Every futures contract has a tick size (the smallest price step the exchange allows) and a tick value (what one tick is worth in dollars on one contract). Those two published numbers turn a stop distance on the chart into dollars at risk, which is why futures position sizing can be checked exactly.
The same chart distance costs very different amounts depending on the contract. These are the CME specifications for ten common contracts:
| Contract | Tick size | Tick value | Value of a full point or $1.00 move | Cost of a 10-tick stop |
|---|---|---|---|---|
| ES (E-mini S&P 500) | 0.25 index points | $12.50 | $50 per point | $125 |
| MES (Micro E-mini S&P 500) | 0.25 index points | $1.25 | $5 per point | $12.50 |
| NQ (E-mini Nasdaq-100) | 0.25 index points | $5.00 | $20 per point | $50 |
| MNQ (Micro E-mini Nasdaq-100) | 0.25 index points | $0.50 | $2 per point | $5 |
| RTY (E-mini Russell 2000) | 0.10 index points | $5.00 | $50 per point | $50 |
| M2K (Micro E-mini Russell 2000) | 0.10 index points | $0.50 | $5 per point | $5 |
| CL (Crude Oil) | $0.01 per barrel | $10.00 | $1,000 per $1.00 | $100 |
| MCL (Micro WTI Crude Oil) | $0.01 per barrel | $1.00 | $100 per $1.00 | $10 |
| GC (Gold) | $0.10 per troy ounce | $10.00 | $100 per $1.00 | $100 |
| MGC (Micro Gold) | $0.10 per troy ounce | $1.00 | $10 per $1.00 | $10 |
Two details matter for sizing. First, each micro is one tenth of its full-size contract, so ten MES carry the same dollar risk per tick as one ES. Second, "points" mean different things across contracts. A 10-point stop on RTY is 100 ticks and $500, while a 10-point stop on ES is 40 ticks and $500 too, but a 10-point stop on NQ is only $200. Always convert to ticks and dollars before comparing.
Related lesson: The tick and point values behind every contract
Risk-Based Position Sizing for Futures Contracts
Risk-based sizing starts with a budget: the most you are willing to lose if this trade hits its stop. There are two common ways to set it.
- Percent of equity (fixed fractional). Risk a fixed share of the current balance, often 1% to 2%. The dollar budget shrinks after losses and grows after gains, which slows the damage in a losing run.
- Fixed dollar amount. Risk the same dollars on every trade, such as $250. It is simpler to track and suits accounts with a hard loss ceiling, but it does not shrink when the balance does.
The percentage is the only input in the whole calculation that is a personal choice. The tick value is a market fact and the stop should come from the chart. That makes the percentage worth choosing on purpose, by looking at what it means across a losing streak rather than across one trade.
What Each Risk Percentage Means Over a Losing Streak
On a $50,000 account using a percent-of-equity budget, here is what ten straight losses do, and how many straight losses it would take to cut the account in half:
| Risk per trade | Budget on $50,000 | Balance after 10 straight losses | Drawdown after 10 losses | Straight losses to halve the account |
|---|---|---|---|---|
| 0.5% | $250 | $47,555.51 | 4.89% | 139 |
| 1% | $500 | $45,219.10 | 9.56% | 69 |
| 2% | $1,000 | $40,853.64 | 18.29% | 35 |
| 3% | $1,500 | $36,871.21 | 26.26% | 23 |
| 5% | $2,500 | $29,936.85 | 40.13% | 14 |
Ten losses in a row sounds rare. It is less rare than it feels. For a strategy that wins 45% of its trades, with each trade independent, the chance of at least one run of ten straight losses is about 10.1% over 100 trades and about 24.4% over 250 trades.
That is why many traders settle between 1% and 2%. At 1%, a bad streak is painful but survivable. At 5%, the same streak removes about 40% of the account and leaves you needing a much larger gain just to get back to the start.
Related lesson: How to choose the per-trade cap
How to Calculate Position Size for Futures Contracts
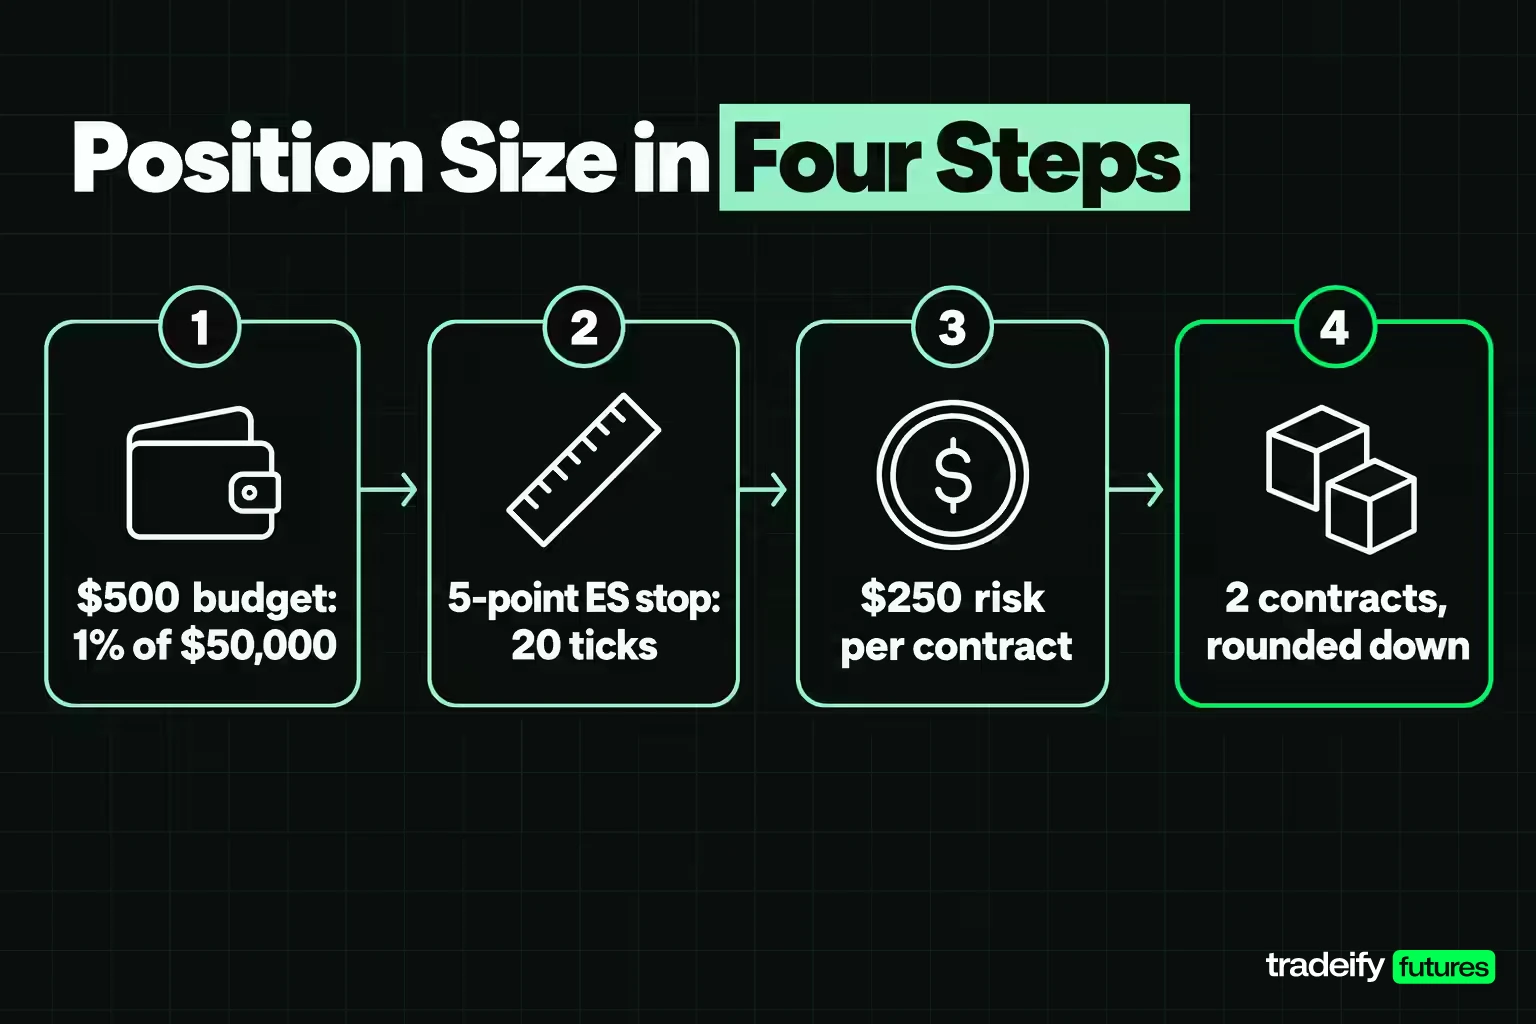
The formula has two steps:
- Risk per contract = stop distance in ticks × tick value.
- Contracts = risk budget ÷ risk per contract, rounded down to a whole number.
Take a $50,000 account risking 1%. The budget is $500. A 5-point stop on ES is 20 ticks, and 20 × $12.50 = $250 per contract. $500 ÷ $250 = 2 contracts.
The budget stays fixed while the stop changes the answer. This ladder holds the $500 budget constant and walks the stop wider on ES and MES:
| Stop in ES points | Stop in ticks | Risk per ES | ES contracts and dollars at risk | Risk per MES | MES contracts and dollars at risk |
|---|---|---|---|---|---|
| 4 | 16 | $200 | 2 ($400) | $20 | 25 ($500) |
| 5 | 20 | $250 | 2 ($500) | $25 | 20 ($500) |
| 8 | 32 | $400 | 1 ($400) | $40 | 12 ($480) |
| 10 | 40 | $500 | 1 ($500) | $50 | 10 ($500) |
| 15 | 60 | $750 | 0 | $75 | 6 ($450) |
| 20 | 80 | $1,000 | 0 | $100 | 5 ($500) |
| 30 | 120 | $1,500 | 0 | $150 | 3 ($450) |
When the Position Size Comes Out to Zero
On a $50,000 account risking 1% ($500), a 15, 20 or 30-point ES stop costs $750, $1,000 or $1,500 per contract. One ES contract would risk more than the whole budget, so the honest ES answer is zero contracts.
That answer is where traders get caught. The setup looks clean, the stop sits exactly where it should, and the formula still says no. The temptation is to tighten the stop until one contract fits, or to quietly raise the risk percentage for this one trade. Both change the trade to suit the size, which is backwards.
The better responses are to trade the micro, where 15 to 30-point stops still fit (6, 5 and 3 MES), or to accept that this setup does not fit the account today.
Putting Costs and Slippage Inside the Risk per Contract
The basic position size formula, budget divided by stop ticks times tick value, assumes the stop fills exactly at its price and trading costs nothing. Neither is true. A stop order becomes a market order once its price is reached, and the fill can come at a worse price in a fast market.
Add an allowance for both. On a $500 budget, using an illustrative one tick of stop slippage and an illustrative $5 round-trip commission, a 5-point ES stop costs $250 + $12.50 + $5 = $267.50 per contract. $500 ÷ $267.50 is 1.87, which rounds down to 1 contract, not 2. Two contracts would really risk $535, over the budget.
On MES with an illustrative $1.50 round trip, risk per contract becomes $25 + $1.25 + $1.50 = $27.75, and $500 ÷ $27.75 rounds down to 18 contracts instead of 20. Use your own broker's commission and a slippage allowance that matches how the contract trades at your entry time.
What Rounding to Whole Contracts Does to Position Size
You cannot trade 1.87 contracts. Rounding down is the only safe direction, but it means the dollars you actually risk are usually below the budget you set. A simple audit shows how far below.
Method: for a $500 budget, the audit takes ten CME contracts and tests every whole-tick stop from 1 tick up to the widest stop at which a single contract still fits inside $500. At each stop it computes the contracts after rounding down and the share of the $500 left unspent. The figures below are original arithmetic for this guide on the published CME tick values, computed November 5, 2026, and they ignore commissions and slippage.
| Contract | Tick value | Widest one-contract stop on $500 | Average budget left unspent | Share of stops that round down | Worst case left unspent |
|---|---|---|---|---|---|
| ES | $12.50 | 40 ticks (10 points) | 16.1% | 80.0% | 47.5% at 21 ticks |
| MES | $1.25 | 400 ticks (100 points) | 17.5% | 96.2% | 49.8% at 201 ticks |
| NQ | $5.00 | 100 ticks (25 points) | 17.0% | 91.0% | 49.0% at 51 ticks |
| MNQ | $0.50 | 1,000 ticks (250 points) | 17.7% | 98.4% | 49.9% at 501 ticks |
| RTY | $5.00 | 100 ticks (10 points) | 17.0% | 91.0% | 49.0% at 51 ticks |
| M2K | $0.50 | 1,000 ticks (100 points) | 17.7% | 98.4% | 49.9% at 501 ticks |
| CL | $10.00 | 50 ticks ($0.50) | 16.8% | 88.0% | 48.0% at 26 ticks |
| MCL | $1.00 | 500 ticks ($5.00) | 17.6% | 97.6% | 49.8% at 251 ticks |
| GC | $10.00 | 50 ticks ($5.00) | 16.8% | 88.0% | 48.0% at 26 ticks |
| MGC | $1.00 | 500 ticks ($50.00) | 17.6% | 97.6% | 49.8% at 251 ticks |
What the Rounding Audit Shows
Three findings stand out.
The average gap is real. In this guide's rounding audit of ten CME contracts on a $500 budget, rounding leaves 16.1% to 17.7% of the budget unspent on average. A trader who thinks they risk 1% per trade is often risking closer to 0.83%. The rule is followed, but the exposure is not what the trader believes.
The worst cases sit one tick past a clean fit. On ES, a 20-tick stop fits 2 contracts and spends exactly $500. At 21 ticks, risk per contract is $262.50, only one contract fits, and $237.50 sits idle. A single tick moved the real risk from 1% of the account to about 0.53%.
Finer tick values do not fix it. MNQ rounds down on 98.4% of its usable stops and leaves 17.7% unspent on average, slightly more than ES. Micros give you finer control over exposure, not a fuller use of the budget.
Rounding up is not the fix, because it breaks the budget on every trade. The fix is to record the real risk, contracts times risk per contract, in your journal instead of the intended percentage. That is the number that explains your results later.
Related lesson: Recording the real risk per trade
Stop Placement Comes Before Position Size
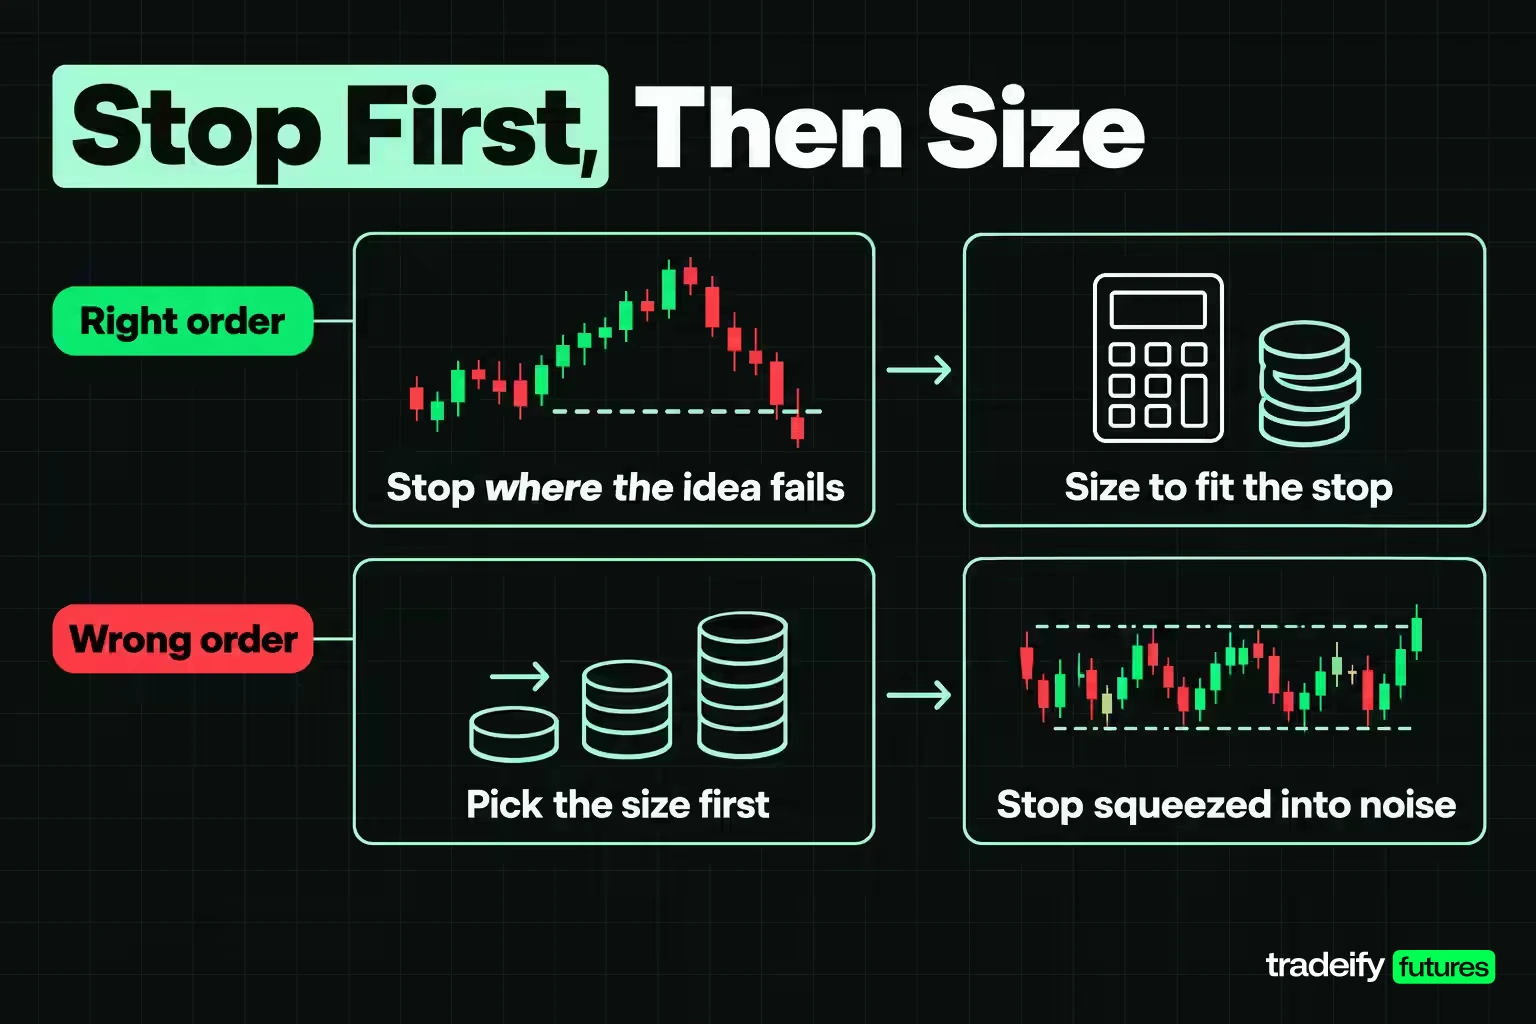
The stop belongs to the trade idea, and the size belongs to the stop. Set the stop at the price that proves the idea wrong, such as beyond the level that should hold if the setup is valid. Then size the position so that stop costs no more than the budget.
The common failure runs the other way. A trader decides on 3 contracts first, then places the stop wherever 3 contracts fit the budget. The stop ends up inside normal noise, the trade gets stopped out on an ordinary wiggle, and the size was "correct" on paper the whole time. The trade was bent to fit the size, when the size should have been fitted to the trade.
A few rules keep the order right:
- Measure the stop in ticks from the invalidation level, then run the formula.
- If the stop is too wide for even one contract, step down to the micro or skip the trade. Do not move the stop to make the size work.
- Never widen a stop after entry. That raises the risk past the budget you sized for.
- Remember that a stop order becomes a market order when triggered, so a fast market or a gap can fill it beyond the stop price.
Related lesson: How to place the stop this formula needs
Where the Profit Target Fits in Position Sizing
The target does not change the contract count. The stop and budget do that. But the target decides whether the position is worth taking at all.
Measure the target in units of risk (R), where 1R is the dollar loss at the stop. With an illustrative 45% win rate and a target of 1.5R, expectancy is 0.45 × 1.5 minus 0.55 × 1 = 0.125R per trade, before costs. At a $500 budget that is $62.50 per trade on average over a large sample. The breakeven win rate for a 1.5R target is 1 ÷ 2.5 = 40%, so if the strategy's real win rate drifts below that, no position size makes it profitable.
Six Position Sizing Strategies for Futures Compared
Every method below still runs through the same formula. What differs is how the risk budget is set and how it changes over time.
| Method | How the contract count is set | Where it fits | Failure mode |
|---|---|---|---|
| Fixed contracts | Same number of contracts every trade | Very early practice with one micro | Dollar risk swings with every stop distance |
| Fixed dollar risk | Same dollar budget, contracts vary with the stop | Accounts with a hard loss ceiling | Does not shrink in a drawdown |
| Fixed fractional | Set percentage of current equity | Most discretionary and systematic traders | Recovery is slow because size shrinks after losses |
| Fixed ratio | Add one contract each time profit grows by a set delta | Traders who want slower growth in size | Depends on the delta chosen; ignores stop distance unless combined with a cap |
| Kelly or optimal f | Fraction derived from win rate and payoff | Research and upper-bound checks | Extremely sensitive to estimation error |
| Volatility scaled | Stop set from ATR, contracts cut as volatility rises | Trend and swing systems across many markets | ATR lags sudden shifts in volatility |
Fixed Ratio Position Sizing
Ryan Jones introduced fixed ratio sizing in his book The Trading Game. The key input is the delta, the profit per contract needed to add one more contract. With a $5,000 delta and a start of one contract, the trader moves to two contracts after $5,000 of profit and to three after $15,000 of total profit. Size grows more slowly than fixed fractional at higher equity, which some traders prefer and others find too slow.
Kelly Criterion Position Sizing
The Kelly criterion, from John Kelly's 1956 paper at Bell Labs, sets the fraction of capital that maximizes long-run growth. For a strategy that loses 1R or wins a fixed multiple R of its risk, the fraction is the win rate minus the loss rate divided by R.
With an illustrative 45% win rate and a 1.5R payoff, Kelly is 0.45 minus 0.55 ÷ 1.5 = 8.33% of the account per trade. Half Kelly is about 4.17%. Both are far above the 1% to 2% range common in risk guidance.
Here is the catch. If the true win rate is 40% instead of 45%, Kelly drops to 0%, because the strategy has no edge. A five-point error in an estimated win rate turns a large bet into no bet. That is why Kelly works better as a ceiling check than as a sizing rule. Ralph Vince's optimal f has the same sensitivity.
Related lesson: How fixed-fractional sizing compounds
Volatility-Adjusted Position Sizing With ATR
Volatility-adjusted sizing keeps the dollar risk constant while the market's movement changes. The usual tool is the Average True Range (ATR), introduced by J. Welles Wilder in his 1978 book New Concepts in Technical Trading Systems. True range is the largest of the bar's high minus low, the high minus the previous close, or the previous close minus the low. ATR averages it, typically over 14 periods.
The method is simple. Set the stop as a multiple of ATR on the timeframe you trade, so a quiet market gets a tight stop and a busy one gets a wide stop. Then size from that stop.
Using the same $500 budget and a stop of 1 × ATR, with illustrative ATR values:
- ATR of 6 ES points: stop costs $300 per ES or $30 per MES. That is 1 ES ($300 at risk) or 16 MES ($480 at risk).
- ATR of 12 ES points: stop costs $600 per ES or $60 per MES. That is 0 ES or 8 MES ($480 at risk).
Volatility doubled and the contract count halved. The dollars at risk stayed at the budget. That is the whole point: a fixed contract count in a volatile market quietly doubles your risk, while ATR sizing makes you smaller exactly when the market is hardest to read.
The limit is that ATR looks backward. A sudden jump in volatility, such as a surprise news release, can outrun an ATR built from calmer bars, so the stop can still be too tight for the next few minutes of trading.
Related lesson: More on sizing by volatility
Scaling In and Out of a Futures Position Size
Scaling means entering or exiting a position in pieces. It can be done inside a risk budget, but only if the total risk of every piece is counted against the same budget.
Scaling Into a Position
Say the plan allows a maximum of 2 ES with a 5-point stop and a $500 budget. Using illustrative prices, the trader buys 1 ES at 6,000.00 with a stop at 5,995.00, risking $250. Price moves to 6,005.00 and the trader adds a second contract there, moving the stop on both to 6,000.00.
Now the first contract risks nothing at the stop and the second risks 5 points, or $250. Total risk is $250, inside the budget, even though the position is now 2 contracts.
The rule that makes this work is to calculate total risk from the combined stop after every add. Adding to a losing position (averaging down) does the opposite: it raises total risk while the trade is proving you wrong, and it is how a sized trade turns into an unsized one.
Scaling Out of a Position
Scaling out reduces size as the trade works. With 2 ES at 6,000.00 and a stop at 5,995.00 ($500 risk), a trader might exit 1 contract at 6,007.50, a gain of 1.5R on that contract, or $375, then move the stop on the remaining contract to 6,000.00.
The remaining contract can still run, and the worst case on it is now roughly a flat exit before slippage. The cost of scaling out is that the full 2-contract position never captures the whole move, so the expectancy math should use the blended result, not the best case.
Sizing Correlated Futures Positions Together
Sizing one trade at 1% is only half the job when several positions are open. Correlated contracts tend to win and lose together, so their risks add up.
A long ES and a long NQ are both bets on US equity index futures rising. On a broad selloff they can lose at the same time. Two positions at 1% each behave more like one 2% position than two independent 1% bets. The same goes for crude oil and its refined products, or gold and silver.
The fix is a total risk ceiling for each group of related markets:
- Set a ceiling for the group, for example 2% of the account across all equity index futures.
- Divide it across the positions you plan to hold. Two positions get 1% each; three get about 0.67% each.
- Add up the real dollars at risk across every open position in the group before entering a new one.
Four unrelated positions at 1% each still add up to 4% of the account at risk at once. Tracking that total, sometimes called portfolio heat, stops a series of small, well-sized trades from becoming one oversized bet.
Related lesson: Total exposure across open positions
Sizing Futures Positions for Overnight Gaps and Contract Rolls
Two time-based situations change what a stop can protect: holding through a session break and trading near expiration.
Overnight and Weekend Gap Risk
CME Globex equity index futures trade nearly around the clock, Sunday 6:00 PM to Friday 5:00 PM ET, with a daily maintenance break from 5:00 PM to 6:00 PM ET. Prices can reopen well away from the last trade after that break or after a weekend.
A stop cannot cap a gap. If price opens beyond the stop, the stop becomes a market order at the first available price. With an illustrative 5-point stop on 1 ES, the planned loss is $250. If the market reopens 30 points against the position, the loss is about $1,500 before slippage, six times the budget.
So a position held through a break should be sized from a plausible gap, not from the stop. In practice that usually means fewer contracts, micros instead of minis, or closing before the break.
Contract Expiration and Rolls
Tick value does not change from one contract month to the next. One ES contract is worth $12.50 per tick in every month. What changes is liquidity.
ES, NQ, RTY and their micros are quarterly contracts (March, June, September, December), and ES trading ends at 9:30 AM ET on the third Friday of the contract month. As expiration nears, volume moves to the next contract and the expiring one thins out. A thinner market means wider spreads and more slippage on stops, which raises the real risk per contract. When sizing near a roll, trade the contract where volume has moved, and widen the slippage allowance rather than the size.
Position Sizing on Funded and Simulated Accounts
The formula is the same on an evaluation or funded account. What changes is that the account carries its own loss limits, and those limits form a second budget that is often tighter than your personal one.
Typical rules include a maximum drawdown (sometimes trailing, which moves up as the account grows) and sometimes a daily loss limit. Convert each one into full stops before you trade. With an illustrative $3,000 maximum drawdown and a $1,000 daily loss limit, a $500 risk per trade means six full stops before the drawdown is hit and only two full stops before the daily limit.
That second number changes the plan. Two losses would end the day, so a trader who wants room for three attempts in a session needs to risk about $333 or less per trade, not $500. Size against the tightest limit in force, not the most comfortable one. Results on evaluation and funded accounts are simulated, and simulated fills do not reproduce all of the slippage a live market can produce.
On our accounts, size is capped by contract limits rather than by margin: a 50K account can hold up to 4 minis or 40 micros, with 10 micros counting as one mini, and a Growth 50K evaluation has a $1,250 daily loss limit. Every position must be closed by 4:45 PM ET, so overnight gap risk never enters the sizing math. Our Help Center also notes that 10 MES cost $18.20 round trip against $5.76 for one ES, so once a position reaches a multiple of 10 micros, the mini is the cheaper way to hold it.
Keeping Position Size Consistent After Wins and Losses
The formula is easy. Applying it the same way after a big win or a painful loss is where most sizing plans break.
After a loss, the urge is to size up and win it back. After a run of wins, the urge is to size up because it feels like the strategy is "working." Both are the same mistake: letting the last outcome decide the next risk. One rough week is one line in the sample, not a reason to change the budget.
Two habits help. Write the dollar budget down before you look at the chart, so the number is set before the setup can argue with it. And change the risk percentage only on a schedule you decided in advance, such as after a set number of trades, never in the middle of a session.
Position Sizing Futures Contracts FAQ
What is the formula for position sizing futures contracts?
Contracts equal the risk budget divided by risk per contract, rounded down. Risk per contract is the stop distance in ticks times the contract's tick value. On a $50,000 account at 1% with a 5-point ES stop, that is $500 ÷ (20 × $12.50) = 2 contracts.
How many futures contracts should a beginner trade?
Start with the number the position sizing formula returns (risk budget divided by stop ticks times tick value, rounded down), which on a small account is often zero full-size contracts and a few micros. Starting with a single micro keeps each tick cheap while you learn execution. The point is to let the stop and budget decide, not a round number that feels right.
Is it better to trade one mini or ten micros?
Neither is safer, because ten micros and one mini carry the same dollar risk per tick. Micros let you size between whole minis, for example 15 micros, and scale out in smaller pieces. Fees are usually charged per contract, so ten micros can cost more to trade than one mini; check your broker's fee schedule once your size reaches a multiple of ten.
Why does my position size say zero contracts?
Because one contract at your stop distance would lose more than your budget. A 20-point ES stop risks $1,000 per contract, double a $500 budget. Use the micro, find a setup with a tighter valid stop, or pass on the trade.
Should I size futures positions from margin or from risk?
From risk. Margin is the deposit needed to hold the position and it changes with volatility. Risk is what you lose at the stop, and it is the only number that ties the position to what the account can absorb.
A Pre-Trade Position Sizing Checklist
Run these steps in order before every order. If one fails, the trade does not get resized to pass it.
- Write the risk budget in dollars: equity times your risk percentage, or your fixed dollar amount.
- Check any account loss limits and use the smaller budget if they bind first.
- Set the stop at the level that invalidates the idea and measure it in ticks.
- Calculate risk per contract: stop ticks times tick value, plus commission and a slippage allowance.
- Divide the budget by risk per contract and round down. If the answer is zero, step down to the micro or skip the trade.
- Multiply contracts by risk per contract to get the real dollars at risk, and record that figure.
- Add the real risk to every open position in the same correlated group and check it against your group ceiling.
The number this produces is a ceiling, not a target. If it returns more contracts than you are comfortable holding, the stop is tight, not the risk small, and trading fewer is always allowed.
Related lesson: The wider risk controls this checklist belongs to
Futures trading involves substantial risk of loss and is not suitable for everyone. Futures are leveraged, so a small price move can produce a loss larger than expected, and a stop order does not guarantee the exit price. Sizing rules limit the size of a single loss but cannot prevent losing streaks. Evaluation and funded accounts are simulated. This article is educational and is not individual financial advice; check current contract specifications, margins and account rules before trading.


