



TL;DR: Handling trading losses means running your rule on the trades after a loss, not waiting for the bad feeling to pass. In a 20-year E-mini study, the next winner came a median 3 trades after a loss. Getting back to the pre-loss equity peak took a median 54.5 trades. Size every loss in R, set a session stop while calm, and treat a break as exposure control.
Your stop just filled. The chart still looks like it should have worked, and the next setup is already forming. Whatever you do in the next ten minutes matters more than the loss you just took.
Traders who last and traders who blow up both take trading losses. The difference is rarely the size of one loss. It is the next hour, the next five trades and the next bad month. This guide covers why losses happen, what they do to your judgement, and an illustrative 20-year E-mini S&P 500 study that puts numbers on the gap between feeling better and actually being back. It ends with a routine for the hour after a loss, an honest test of the "take a break" advice, and a way to rebuild confidence without pretending the loss never happened.
What Handling Trading Losses Means
Handling a loss is not a mood. It is the rate at which you follow your own rules on the trades that come after one.
That definition matters because most loss advice is a list of feelings to avoid. Do not panic, do not revenge trade, do not let it get to you. All true, and none of it helps when a position just stopped out and your pulse is up.
Accepting a Loss Versus Excusing It
Every trading guide tells you to accept losses. That advice is right, but it needs a boundary. A loss your plan expected is a cost of doing business. A loss your plan did not expect is information.
- A planned loss: the setup met your rules, the stop sat where the plan put it, and the fill came at or near that level. Accept it fully and move on.
- A process loss: you entered off-plan, moved the stop, sized up, or held through an exit. Accepting this one without a note teaches your brain that the rule is optional.
Most traders blur the two. "Losses are part of trading" becomes a blanket excuse, and that is how a trader loses the ability to tell whether the strategy or the execution is failing.
The practical test takes ten seconds. Before you call a loss "part of the plan," ask whether the plan would actually have produced it.
Common Causes of Trading Losses
Trading losses come from a handful of sources. Some are the price of having an edge at all. Others are self-inflicted and fixable.
| Cause of the loss | What it looks like | What addresses it |
|---|---|---|
| Normal edge variance | A valid setup that simply did not work | Nothing, beyond correct sizing |
| Oversizing | One loss takes a large share of the day or account | Fixed risk per trade in R |
| Correlated stacking | Several positions lose on the same move | Count total open risk, not trades |
| Volatility shift | Stops that used to be safe now get hit by noise | Stop and size scaled to current range |
| Execution error | Wrong contract, wrong size, slippage past the stop | Pre-trade checklist, limit orders where sensible |
| Emotional decision | Chasing, revenge entries, moving a stop | Precommitted session rules |
Two causes deserve more than a table row, because they are invisible from inside a single trade.
Correlated Losses and Volatility Shifts
The first is correlation. In this guide's 20-year E-mini breakout study, 391 of 591 consecutive signal pairs arrived while the previous trade was still open. On a busy chart, several "independent" trades are often the same bet on the same move. When that move fails, the losses arrive together.
The second is volatility. A fixed stop in points means very different things in a quiet market and a fast one. In the same E-mini study, one risk unit (one average true range) ran from 12.62 index points at the 5th percentile to 92.43 at the 95th, about 7 times wider. A trader who sizes the same in both markets is taking a much larger loss in the fast one without changing anything on purpose.
The Psychological Impact of Trading Losses
A trading loss changes the next decision, not just the mood. Three bodies of research explain why.
Loss aversion. In their 1979 Prospect Theory paper, Kahneman and Tversky wrote that "losses loom larger than gains." Their value function is steeper for losses and convex in the loss domain. In plain terms, people facing a sure loss tend to prefer a gamble that might erase it, even when the gamble has a worse expected value. That is the shape of "I'll make it back."
Stress chemistry. Coates and Herbert sampled hormones from traders on a London trading floor and found that a trader's cortisol rises with both the variance of his trading results and the volatility of the market (PNAS, 2008). They noted that elevated steroids may shift risk preferences. A losing stretch is not only a number on the screen. It is a physical state you then make decisions inside.
Traders take more risk after losing. Coval and Shumway studied 426 local traders in the CBOT Treasury bond futures pit (Journal of Finance, 2005). A trader with morning losses had a 31.2% chance of taking above-average risk in the afternoon, against 27.0% after a profitable morning. That makes a losing trader about 15.5% more likely to press. These were professionals on the floor, not beginners.
Put together, the pattern is consistent. After a loss you feel it more than an equal gain, your body is running a stress response, and you are more likely to take extra risk to get back to even. Knowing this will not switch it off. It does tell you where the guard rails need to go: on the next entry, not on the feeling.
A 20-Year E-mini Study of Trading Losses
Advice about losses is easier to judge with numbers. This illustrative study uses front-month continuous E-mini S&P 500 futures daily bars from Yahoo Finance: 5,067 completed sessions from 18 September 2006 to 4 November 2026, with 9 rows that had no price removed.
The rule is deliberately plain:
- Signal: a daily close above the highest high of the prior 20 sessions.
- Entry: long at the next session's open, one unit.
- Stop and target: 1.0 and 2.0 times the 14-session Wilder average true range, measured at the signal bar.
- Time cap: exit at the close of the 20th session if neither level is hit.
- Fills: a gap through the stop fills at that bar's open; otherwise the stop is checked before the target.
- Cost: 0.5 index points per round turn, about 1.31% of the average risk unit.
This is a daily-bar swing rule, used here because it gives a long, clean record of losses. It is an illustration of how loss sequences behave, not a strategy recommendation.
What a Rule-Based Trading Loss Looks Like
In this guide's 20-year E-mini breakout study, the rule produced 592 signals. It won 40.20% of the time, averaged 0.13R per trade and totaled 77.02R. A bootstrap interval for the average runs from 0.01R to 0.24R, so the edge is small and only just clears zero.
The study recorded 354 losses, 59.80% of all trades. The average loss was 1.01R with a standard deviation of 0.07R. 97.46% of losses were stop-outs at the planned level. The worst single loss was 1.25R, one of 4 gap stops where the market opened beyond the stop.
That uniformity is the point. When the rule is followed, the loss is boringly predictable. What varies is what you do next.
Why Trades Overlap in the E-mini Loss Study
Signals on a 20-session breakout rule cluster, because one strong move keeps printing new highs. In this guide's 20-year E-mini study, 391 of 591 consecutive signal pairs arrived while the previous trade was still open. Collapsing every overlapping trade into one market window leaves 231 distinct windows, about 39% of the 592 booked trades.
Overlap matters for handling losses because overlapping trades lose together. It is also why the "skip the next trade after a loss" tactic looks brilliant on a backtest and disappoints in a one-position account, as the revenge trading section of this guide shows.
Relief and Recovery After a Losing Trade

After a trading loss, three different clocks start running, and most traders only watch the first. This guide's 20-year E-mini breakout study measured all three after each of its 354 losses.
| Clock after a loss | Median trades | Mean trades | Slowest tenth |
|---|---|---|---|
| Next winning trade | 3 | 4.04 | 9 or more |
| Back to the pre-loss balance | 7 | 16.64 | 25 or more |
| Back to the pre-loss equity peak | 54.5 | 80.08 | 212 or more |
The relief clock is short. In the E-mini study, the median wait for the next winner was 3 trades. Still, 33.14% of losses were followed by five or more trades before a winner, and 13.95% needed eight or more.
The balance clock is longer. In the same study, the median loss took 7 trades to get back to the balance just before it. Only 19.21% were erased by the very next trade, and 10 losses (2.82%) were never regained by the end of the sample.
The peak clock is the one that hurts. Most losses arrive during a drawdown, so in the E-mini study getting back to the account's previous high took a median of 54.5 trades. The middle half of losses needed between 15 and 130 trades.
Why the Gap Between Relief and Recovery Drives Tilt
In this guide's E-mini study, the clock back to the equity peak ran about 18 times longer than the clock to the next winner, at the median. That gap is the mechanism behind a lot of post-loss damage.
A winner three trades later feels like the loss is over. The account statement disagrees. A trader who treats relief as recovery tends to do one of two things: size up to "finish the job," or loosen the rules because things feel normal again. Both add risk exactly when the account is still below its high.
The arithmetic is not mysterious. In the study, a win paid about 1.83R and a loss cost about 1R, so one winner should cover one loser. But winners came only 40.20% of the time, and losses arrived in runs. Recovery is not waiting for the next winner. It is waiting for all the winners to outweigh every loss since the peak.
Losing Streaks and a Long-Term View of Losses
The longest losing run in the study was 15 trades in a row, with entries from 4 August 2009 to 12 January 2010. That looks like a broken system. It was not.
In this guide's study, shuffling the 592 actual outcomes into 10,000 random orders gave a longest losing run of 11 at the median and 16 at the 95th percentile. 9.19% of the shuffles produced a run of 15 or longer. With a loss rate of about 60%, a 15-trade losing run sits inside normal variation.
Losses also cluster. Across the 77 losing runs in the E-mini study, 22 were six trades or longer, and the 53 runs of three or more held 90.68% of all losses. Losing runs are where both accounts and confidence break.
| Losing run length | Number of runs |
|---|---|
| 1 loss | 15 |
| 2 losses | 9 |
| 3 losses | 11 |
| 4 losses | 11 |
| 5 losses | 9 |
| 6 or more losses | 22 |
A Long-Term Mindset About Trading Losses
A long-term view of trading losses works in both directions. In the same 20-year E-mini study, the longest winning run was 13 trades, entered from 10 April 2026 to 12 May 2026, worth 25.94R. Thirteen wins in a row feels like proof of skill. On a rule with a 40% win rate, it is mostly sequence luck.
A long-term mindset means judging a strategy over hundreds of trades, not over the last ten. It also means honesty about the base rate. In a study of every day trader on the Taiwan Stock Exchange from 1992 to 2006, Barber, Lee, Liu and Odean found that less than 1% (about 1,000 of 360,000 in an average year) outperformed consistently.
The long view is not "losses don't matter, the edge will come through." It is "the edge, if it exists, only shows up across a sample large enough to include the bad runs, so the plan has to survive them."
Risk Management That Keeps Trading Losses Small
Risk management cannot stop losses. It decides how much each one costs and how many you can survive.
The cleanest unit is R: the amount you risk on one trade. A trader who thinks in R describes the strategy. A trader who thinks only in dollars describes their sizing, which is a separate choice.
Why a 1R Loss Is Not a Fixed Dollar Amount
A 1R loss is fixed in R but not in dollars, because R moves with volatility. In this guide's 20-year E-mini study, on one ES contract ($50 per index point), the risk unit (one average true range) had a median of $1,370.42. It ran from $630.90 at the 5th percentile to $4,621.61 at the 95th. The average loss was $1,834.45 per contract, the 90th percentile $3,693.24 and the 99th $5,934.28.
Same rule, same 1R loss, roughly seven times the dollar damage depending on when it happened. That is the arithmetic behind "I'll make it back," and it is why size should come from the stop distance and a fixed dollar risk, not from a habit of "one contract."
The Worst Losing Run, Priced Three Ways
Here is the longest losing run in this guide's E-mini study, 15 trades entered from August 2009 to January 2010, priced under three sizing choices on an illustrative $50,000 account:
| Sizing choice | Loss over 15 trades | Share of $50,000 |
|---|---|---|
| R units, any sizing | -15.49R | Depends on R |
| One ES contract every trade | -$12,069.85 | 24.14% |
| Fixed $250 risk (0.5%) | -$3,873.32 | 7.75% |
| Fixed $500 risk (1.0%) | -$7,746.65 | 15.49% |
The R result never changes. The account result moves by a factor of three with sizing alone. If your plan cannot survive a 15-loss run at your current risk per trade, the run is not the problem. The size is.
Daily Loss Limits as a Session Stop
A daily loss limit is a session-level stop: once losses for the day reach a set amount, you stop trading until the next session. It caps the damage of a bad day before tilt can compound it.
Set it in R while flat, for example two or three full losses, or one loss plus one rule break. Choosing it in advance matters more than the exact number, because the version you choose mid-drawdown is always looser. Many platforms let you hard-code a personal daily loss limit, which removes the decision from the moment.
Related lesson: How daily and weekly caps fit together
Managing Emotions in the Hour After a Loss
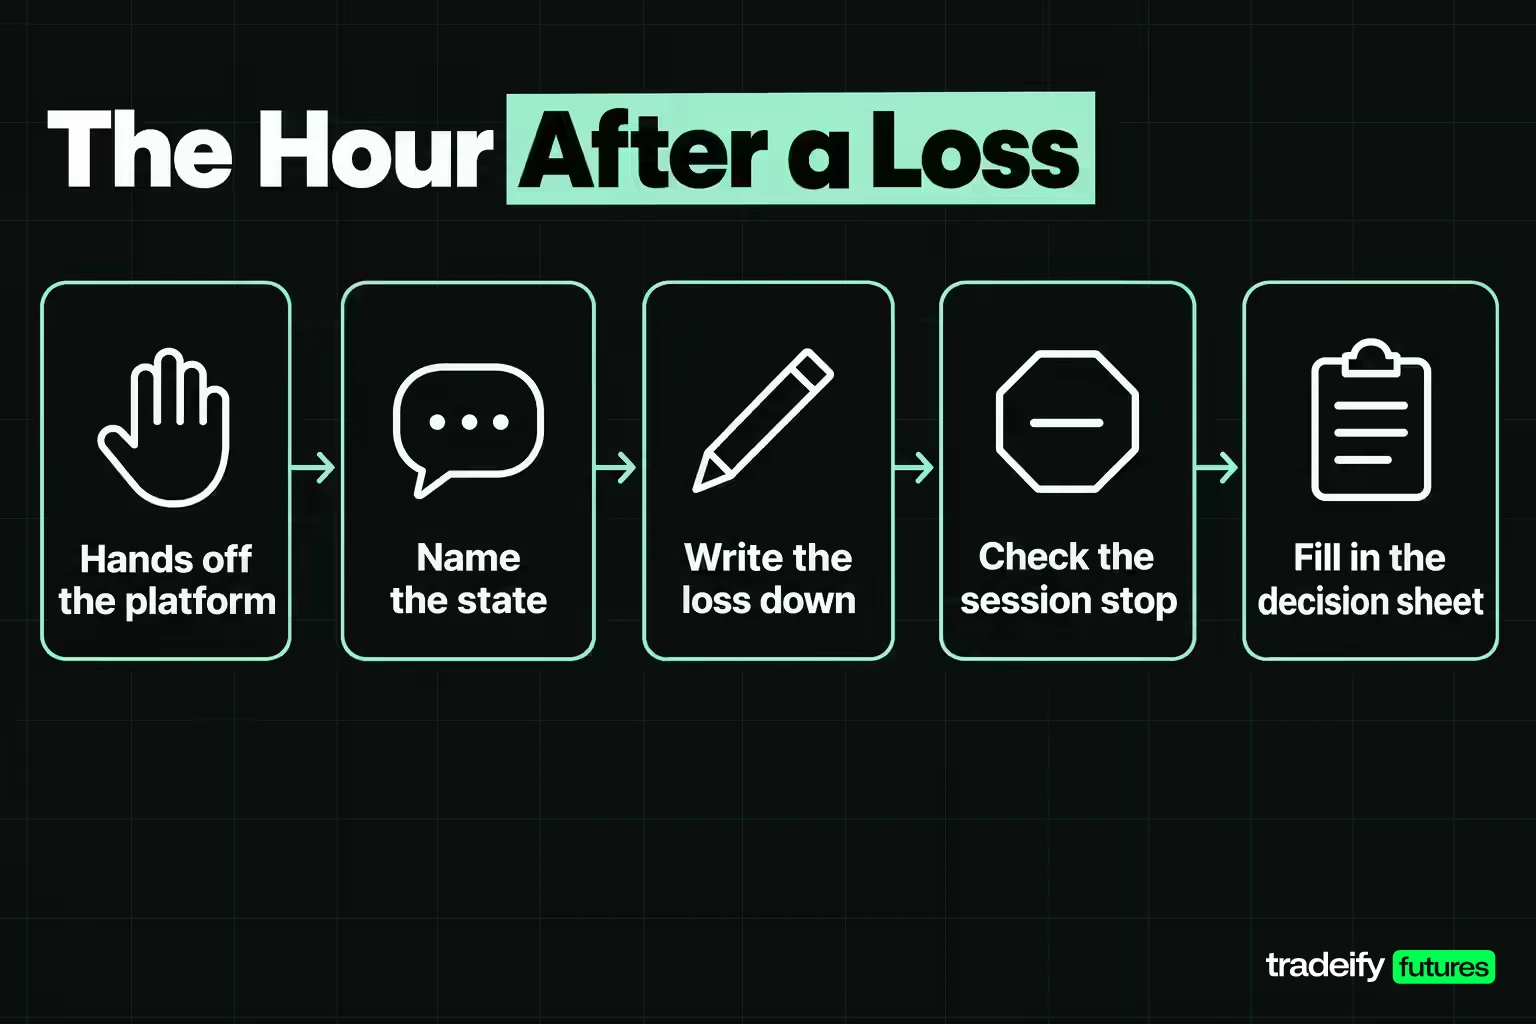
The hour after a trading loss is when loss aversion and stress show up in your orders. Managing emotions after a loss is less about feeling calm and more about slowing the next decision down.
A short routine that works for many traders:
- Take your hands off the platform. Stand up, step away, and let the first spike pass before you look at the chart again.
- Name the state. Angry, rushed, embarrassed, numb. Naming it gives you a cue to check the next entry harder.
- Write the loss down in R, in dollars, and as a share of the account, on one line.
- Check the session stop you set while flat. If the loss reached it, you are done for the day.
- Fill in a post-loss decision sheet before any new entry.
The Post-Loss Decision Sheet
A post-loss decision sheet has five slots, filled in after a loss and before the next entry, not after it:
- Slot 1, the loss and its unit. R, dollars and account percentage on one line, so the dollar figure cannot float away from the risk you accepted.
- Slot 2, the exit type. Stop at your level, reversal from near target, time exit, or a fill beyond the stop. A stop that fired where you placed it is a cost. A fill you did not plan is a process note.
- Slot 3, open exposure. Count open positions and whether they are on the same move as the loss. If they are, the next signal is the same bet, not a new decision.
- Slot 4, relief versus recovery. Write where the account needs to get back to, separately from when the next win might come. If your plan treats the next win as recovery, the sheet wins.
- Slot 5, the stop condition. The count that ends your session, written as something you can check without judgement.
Related lesson: The state that makes a loss feel like it must be answered now
Avoiding Revenge Trading After a Loss
Revenge trading is an entry taken to get the money back rather than because the setup is there. It usually shows up as a larger size, a faster entry, a looser stop, or a trade on a market you do not normally trade.
Research on CBOT pit traders by Coval and Shumway found that traders with losing mornings took more afternoon risk, so the urge is normal even among professionals. The fix is not willpower. It is a rule that makes the revenge entry hard to place:
- A cooldown after any loss, set in minutes, before the next order.
- No size increase after a loss in the same session.
- Only setups from your written list, checked against the plan before entry.
- The daily loss limit coded into the platform, not kept in your head.
Related lesson: What the second trade after a loss actually costs
Testing the Take-a-Break Rule After a Loss
The most common post-loss advice is to skip the next trade after a loss. This guide's 20-year E-mini breakout study can test it.
On the study's booked record of 592 trades, skipping the next signal after any loss took 394 trades and returned 161.16R, against 77.02R for taking everything. That is 84.13R better, and the average trade rose from 0.13R to 0.41R. Skipping after two losses added 61.78R. Skipping after a win instead cost 133.75R. As a control, the same rule applied to 10,000 shuffled orders of the same outcomes had a median change of -28.85R, a best case of 32.89R, and none reached 84.13R.
It looks like a powerful rule. Before trusting it, check what was skipped. Of the 198 removed signals, 95 (about 48%) would have been entered while the losing trade was still open. A trader holding one position at a time could never have taken them, so the rule gets credit for skipping trades that did not exist.
Running it honestly on the study's 231 non-overlapping windows flips the result. The baseline made 22.01R, and skipping after a loss made 12.36R, a change of -9.65R.
Both results are true, and they answer different questions. The break works when it stops you stacking correlated positions on a move that has already proven you wrong. It costs money when the loss is closed and the next signal is genuinely new. That makes "take a break" an exposure rule, not a mood rule.
Learning From Trading Losses

A loss you do not classify is a loss you pay for twice. Learning from trading losses starts with sorting each one into a category:
- Planned: the rule produced it and the fill matched. No change needed.
- Execution: wrong size, wrong contract, slippage past your stop, a platform mistake.
- Rule break: an off-plan entry, a moved stop, a held exit.
- Regime: the rule behaved as designed, but conditions (volatility, trend, session) have shifted.
Only the last three call for action, and each needs a different fix. Execution errors need a checklist. Rule breaks need a precommitment or a lockout. A regime question needs more data before you change anything, because a short sample rarely proves it.
A useful benchmark from this guide's 20-year E-mini study: 97.46% of losses were clean stop-outs at the planned level. If a large share of your losses are not near 1R, that is a process finding, not bad luck.
Using a Trading Journal for Loss Analysis
A trading journal turns losses into data you can analyze. For each trade, record the date, market, setup name, planned risk in R, result in R and dollars, exit type, the loss category (planned, execution, rule break or regime), and one line on your state before entry.
Watch for one failure mode. Many traders journal heavily when a loss stings and stop when it does not. That leaves a record full of the worst trades, which is a biased sample in the same way a backtest with look-ahead is a biased backtest. Log every trade, winners included, or the journal will tell you a distorted story.
Review weekly, not after each loss. One loss tells you almost nothing. Twenty losses sorted by category start to show where the money leaks.
Related lesson: Recording losses in R so the relief and recovery clocks show in your own data
Building Emotional Resilience to Trading Losses
Emotional resilience is the ability to take the next valid trade at normal size after a loss. It is built before the losses arrive, not during them.
Three habits help:
- Rehearse the bad run. Know the longest losing run your strategy is likely to produce, and its cost at your size, before it happens. A 15-loss run, like the worst one in this guide's E-mini study, still hurts when you expected it. One you did not expect feels like proof the strategy is broken.
- Precommit the rules. Decide your risk per trade, session stop and cooldown while flat. Decisions made calm are the ones you can follow when you are not.
- Protect the basics. Sleep, food and time away from screens affect decisions more than most traders admit. Research linking traders' cortisol to the variance of their results is a reason to treat them as part of risk management.
Resilience also means accepting that some losing stretches will be long. In this guide's 20-year E-mini study, the median loss needed 54.5 trades before the account saw a new equity high. Expecting that in advance removes a lot of the panic.
Seeking Support After Heavy Losses
Losses are easier to handle when you are not the only one looking at them. A mentor, a trading partner or a community of traders can review your journal and spot a pattern you cannot see from inside it.
If trading losses are affecting money you need for living costs, your sleep or your relationships, step back from trading and talk to someone qualified, such as a financial adviser or a mental health professional. That is not weakness. It is the same risk management, applied to your life instead of one account.
Related lesson: When the losing run is long enough to be a drawdown
Rebuilding Trading Confidence After Losses
Confidence after losses comes back through evidence, not pep talks. The evidence that counts is whether you followed your rules, not whether the last trade won.
A practical rebuild:
- Score execution, not P&L. For the next 20 trades, mark each one "followed the plan" or "did not." A run of clean executions is real progress even if some lose.
- Step size down with a stated exit. Trade smaller, for example half your normal risk, until you hit a set number of rule-following trades. Then step back up. Write both numbers before you start.
- Pick the best-understood setup. Trade only the setup you know best until the execution score is back.
Be honest about the cost. In this guide's 20-year E-mini study, halving size after every loss until the account made a new high cost 12.65R on the non-overlapping trades, because the edge was intact and smaller size earned less of it. Size reduction is a tool for protecting your decision-making, not a free upgrade. Use it when execution is slipping, and step back up on a rule, not a feeling.
Handling Trading Losses FAQ
How do you handle losses in trading?
Handle a trading loss by writing it down in R, dollars and account percent, then checking it against your plan before the next entry. Confirm the exit was where you planned and whether you hold correlated positions. Stop for the day if your session stop is reached.
Is it true that 90% of traders lose money?
Not exactly, but most active traders do lose money. Barber, Lee, Liu and Odean studied every day trader in Taiwan from 1992 to 2006 and found about 13% made a profit net of fees in a typical year. Less than 1% outperformed consistently from year to year.
How many losses in a row should you expect?
Expect longer losing runs than feel comfortable, often in double digits for a rule that loses more often than it wins. In this guide's 20-year E-mini breakout study, a rule that lost about 60% of the time had a 15-trade losing run, and random shuffles put the 95th percentile at 16. Size so that a run of that length is survivable.
What is the 7% loss rule?
The 7% loss rule says to sell a stock when it is down 7% or 8% from your purchase price, with no exceptions. It comes from William O'Neil and Investor's Business Daily, and it was written for stock investing. Futures traders usually set stops by market structure or volatility instead, but the principle of a fixed, precommitted exit carries over.
What is the 3-5-7 rule in trading?
The 3-5-7 rule caps risk at 3% per trade and 5% across all open positions, and aims for winners at least 7% larger than losers. It is an informal rule of thumb, not a regulation. Definitions vary, and many futures traders use a much lower risk per trade.
Can you write off trading losses on your taxes?
In the US, net capital losses can offset ordinary income up to $3,000 a year ($1,500 if married filing separately), with the excess carried forward. Regulated futures fall under Section 1256, which treats gains and losses as 60% long-term and 40% short-term. Rules depend on your situation, so check with a tax professional.
Preparing for Your Next Trading Loss
Your next trading loss is the one forecast in trading with no uncertainty attached. Three preparations are worth doing now, while the account is flat:
- Write your session stop as a count you can check, not a feeling.
- Decide what you will do with correlated signals after a loss.
- Start recording every trade in R as well as dollars, so your own relief and recovery clocks become visible.
On our accounts that carry a Daily Loss Limit, such as Growth, it is a soft breach: reaching it pauses trading until the next trading day without failing the account. It is not a stop loss, and losses can run past it before it triggers, so it should never replace your own stop. Our funded accounts are simulated, and traders who want a tighter personal limit can set one in Tradovate's Risk Settings or a lockout timer in Tradesea.
This guide is educational and not investment, tax or legal advice. Futures and leveraged trading carry a substantial risk of loss, losses can exceed what you expect, and simulated or funded account results do not guarantee live results. The study above is historical and illustrative, and real fills, costs and conditions will differ.


