



TL;DR: Revenge trading is a trade taken because the last one lost, not because your setup appeared. In 20 years of E-mini data, a doubled re-entry after a stop left the average almost flat but took the worst day from -1R to -4.59R. Only 2 of 34 re-entries won back the full loss. The fix is a rule written in advance: flat after a full stop, size set by the stop distance, and a daily cap in R.
Your stop gets hit. Price turns a few minutes later and trades back through your entry without you. Now the next order feels less like a decision and more like a correction the market owes you.
That moment is where revenge trading starts. The first loss was part of the plan. The second trade usually is not.
This guide covers what revenge trading is, why it happens, how to spot it in your own order history, and what the second trade actually costs when you measure it on two decades of futures data instead of just warning about it.
What Revenge Trading Is
Revenge trading is entering a trade because of the previous trade's loss rather than because your plan's setup appeared. The motive is to get the money back, and that motive changes the size, the timing or the quality bar of the next entry.
The definition is about why you clicked, not how the trade turned out. A revenge trade that wins is still a revenge trade. A planned setup that shows up five minutes after a stop-out and is taken at normal size is not one, even though it follows a loss.
The Flat-Day Test for a Revenge Trade
The cleanest way to classify a post-loss entry is a counterfactual. Ask: would I take this exact trade, at this size, with this stop and target, if my last trade had closed at breakeven?
- If yes, you are trading your plan.
- If no, the previous result is inside the position, and the loss is now setting your risk.
The test works because it ignores how you feel and checks only the decision. Feelings are hard to audit after the fact. Size, timing and setup criteria are sitting in your fills, and they do not argue back.
The Psychology Behind a Revenge Trade

A loss lands as more than a number. It can read as a verdict on your preparation, your read of the market or your competence, and the quickest imagined way to erase that verdict is another trade.
Three forces usually stack up in the minutes after a stop:
- The loss feels like a threat to fix now. The account balance becomes a reference point, and being below it feels like an open problem rather than a closed trade.
- Your body reacts to uncertainty. Coates and Herbert's 2008 study of traders on a London trading floor found that cortisol rose with the variance of each trader's results and with market volatility. A run of swingy outcomes is a physical event, not only a mental one.
- The need to be right. If the stopped trade was a strong conviction idea, re-entering feels like proving the read was correct and the stop was the mistake.
Evidence From Professional Futures Traders
This is not only a beginner problem. Coval and Shumway studied 426 local traders in the CBOT Treasury bond futures pit across 236 trading days in 1998, published in the Journal of Finance in 2005. A trader with a losing morning had a 31.2% chance of taking above-average risk in the afternoon, against 27.0% for a trader with a profitable morning. That made losing traders 15.5% more likely to raise their afternoon risk.
Coval and Shumway found the same pattern in trade counts and size. Traders with losing mornings were 17.4% more likely to place an above-average number of afternoon trades and 9.5% more likely to trade above-average size. The authors also found that prices set by these loss-averse traders reversed more quickly than prices set by other traders, which suggests the market treated those trades as pressure rather than information.
These were full-time professionals whose whole job was reading order flow, and they still did it. The urge to win it back is a feature of how people handle losses, not a flaw unique to you. That is why the fix has to be a rule, not a personality trait.
Cognitive Biases That Feed the Urge to Win It Back
Several well-documented decision biases push toward revenge trading after a loss. Knowing which one is active tells you which rule to lean on.
- Loss aversion. In Tversky and Kahneman's 1992 cumulative prospect theory experiment with 25 graduate students, the median loss-aversion coefficient was 2.25, meaning a loss weighed roughly twice as heavily as a gain of the same size. A trader who feels a 1R loss more than twice as strongly as a 1R win will reach for risk to remove it.
- The break-even effect. Thaler and Johnson's 1990 real-money experiments found that after prior losses, bets offering a chance to get back to even were especially attractive. That is the exact shape of a revenge trade: a bet chosen because it could reach zero on the day, not because it has an edge.
- Anchoring to the old balance. The morning's starting equity becomes the target. Every decision gets measured against that number instead of against the setup in front of you.
- Outcome bias. A stop followed by a reversal makes the original trade look right and the stop look wrong. Sometimes the stop was too tight, and that is a question for your weekend review, not for the next five minutes.
- Recency. The last trade feels like the most informative one. It is one line in a sample of hundreds.
Related lesson: Confirmation bias
Warning Signs of Revenge Trading in Your Order History
Revenge trading is easier to catch in your fills than in your mood. Each sign below leaves a record you can check after the session.
| Warning sign | What it looks like in the record | What to check |
|---|---|---|
| Size jumps after a loss | Contract count above your normal size on the next entry | Size ratio of post-loss entries to all entries |
| Fast re-entry | New fill within minutes of a stop-out | Time from last losing fill to next entry |
| Stop distance changes | Wider stop to give the trade room, or no stop at all | Stop distance against your median |
| Setup off your list | Entry with no named setup in the journal | Share of entries with a setup tag |
| Instrument switch | Moving from your usual market to a faster one | Number of symbols traded on red days versus green days |
| Same level, again | Re-entering at or near the level that just stopped you | Entries within a few ticks of a stop price |
| Ignoring the daily cap | Trading on after the day's loss limit was reached | Trades placed after the cap |
One sign alone can be innocent. Two or more on the same trade, right after a loss, is the pattern.
There are quieter forms too. Some traders keep size constant but drop their entry standards. Others stop trading their tested session and start trading the slow lunch hour because sitting still feels like accepting the loss. Both pass a size check and still fail the flat-day test.
Revenge Trading vs Overtrading
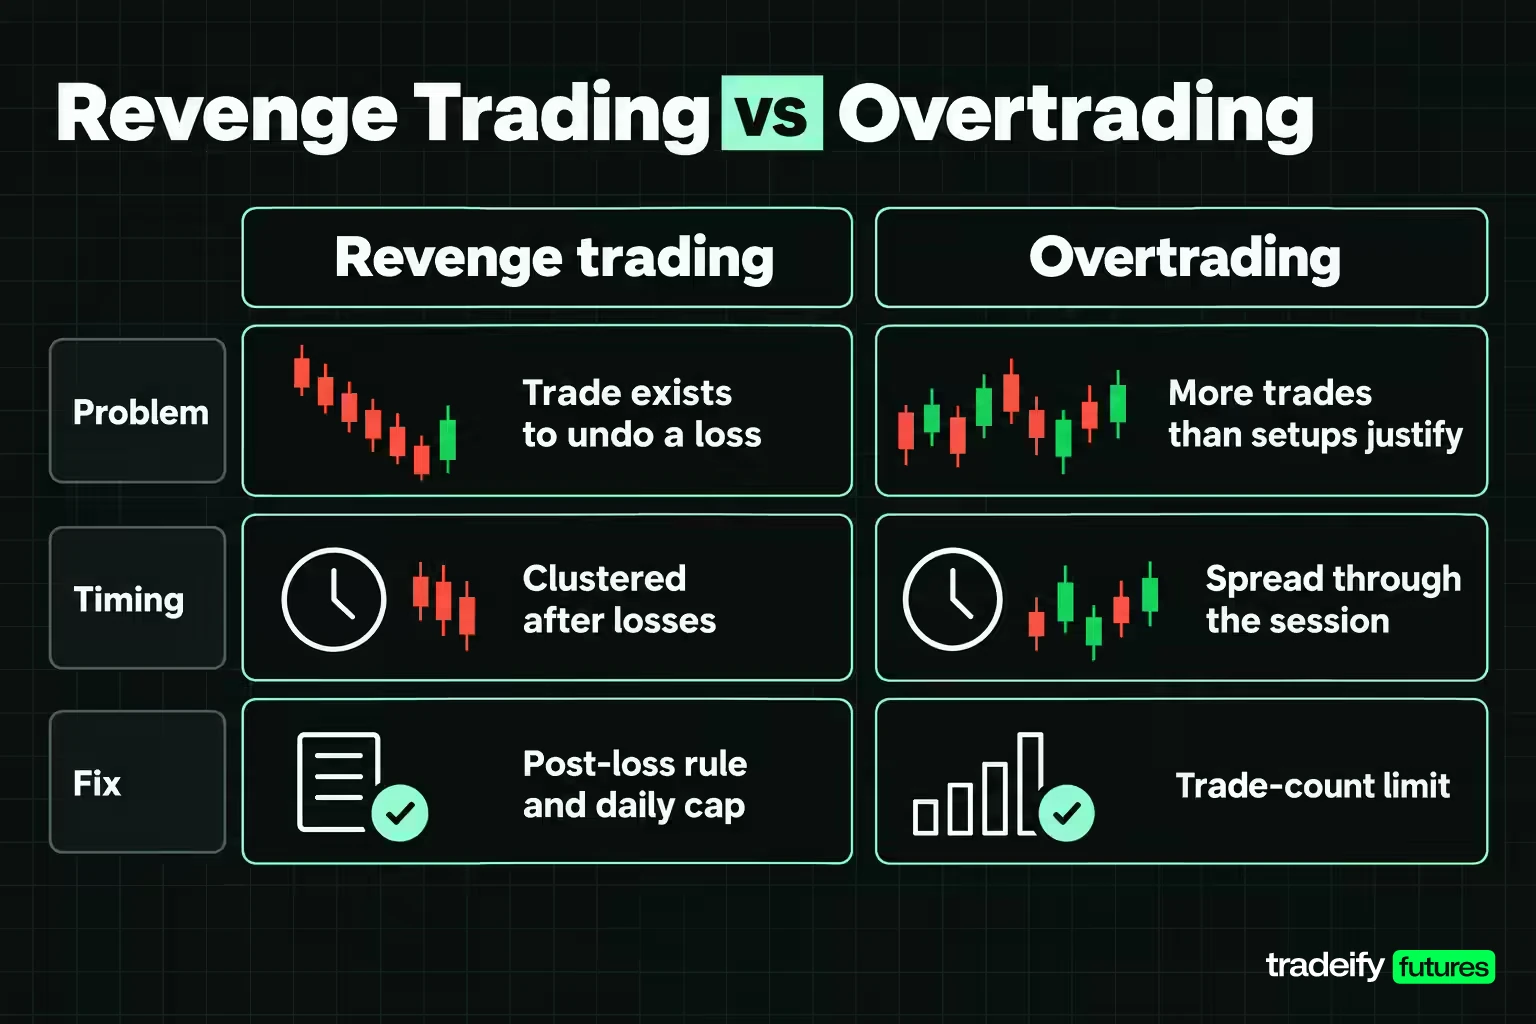
Revenge trading and overtrading overlap, but they are different problems with different fixes.
| Feature | Revenge trading | Overtrading |
|---|---|---|
| Core problem | Motive, the trade exists to undo a loss | Volume, more trades than your setups justify |
| Trigger | A specific losing trade or red day | Boredom, a slow market, a target, or habit |
| Typical size change | Often larger after the loss | Often unchanged |
| Timing | Clustered right after losses | Spread through the session |
| Main fix | Post-loss rule and daily cap | Setup criteria and a trade-count limit |
They feed each other. A revenge entry lowers your standards, and lower standards produce more trades. The difference matters because a trade-count limit alone does not stop a single oversized revenge trade, and a post-loss rule alone does not stop a trader who overtrades on green days too.
What a Revenge Trade Costs in 20 Years of E-mini Data
Most advice on revenge trading says it is expensive without showing the bill. This section measures one common version of it, re-entering right after a stop, on a fully stated rule so you can rebuild it.
How the Revenge Trade Study Was Built
All figures are in R, where 1R is what the planned trade loses if its stop is hit. The study is illustrative, uses historical continuous front-month data, and ignores commissions and slippage.
- Data. E-mini S&P 500 continuous front-month daily bars (Yahoo Finance series ES=F), 5,067 sessions from 18 September 2006 to 4 November 2026, with 9 rows that carried no price excluded.
- Signal. A session closes above the highest high of the prior 20 sessions. That produced 592 signals, about 29.4 a year.
- Planned trade. Long at the next session's open, exit at that session's close.
- Stop. One times the 14-session Wilder average true range at the signal bar, below the entry. Treated as a resting order, so a session that touches it loses exactly 1R.
- Revenge re-entry. On a stop-out, buy again at the stop price in the same session and hold to the close with no stop. Daily bars cannot show the order of moves inside a session, so this is the most generous version possible. A real revenge trade usually has worse fills and often gets repeated.
- Escalation. The re-entry sized at one, two or three units.
In this guide's study the stop was touched on 34 of 592 signals, 5.7%. Thirty-four cases over 20 years is a small sample, which is exactly why this study reports the tail and the drawdown, not only the average.
The Re-Entry Ledger on 34 Stop-Outs
The revenge re-entry feels justified because the market often trades back through the stop. This guide's own ledger of the 34 E-mini stop-outs shows why that memory is misleading.
| Outcome after the stop in this guide's E-mini study | Count of 34 | Share | Average R |
|---|---|---|---|
| Holding through the stop would have closed green | 2 | 5.9% | Not applicable |
| Re-entry closed profitable | 19 | 55.9% | 0.44R |
| Re-entry won back the full 1R | 2 | 5.9% | Not applicable |
| Re-entry closed red | 15 | 44.1% | -0.47R |
In this guide's E-mini study, more than half the re-entries made money, and that is the number a trader remembers. It is also the number that keeps the habit alive. But a 0.44R win does not undo a 1R loss. Only 2 of 34 re-entries actually recovered the stop, while 15 of 34 added a second loss, the worst of them -1.79R. Profitable and recovered are two different numbers, and the gap between 55.9% and 5.9% is where the revenge story gets built.
The Escalation Ladder in Drawdown Terms
Here is what happens to the whole 20-year record when the re-entry is added and then sized up.
| Policy | Total return | Average per signal | Worst day | Max drawdown | Return to drawdown |
|---|---|---|---|---|---|
| Plan only | 17.69R | 0.03R | -1.00R | 5.36R | 3.30 |
| Plan plus one-unit re-entry | 18.89R | 0.03R | -2.79R | 5.64R | 3.35 |
| Plan plus two-unit re-entry | 20.10R | 0.03R | -4.59R | 6.62R | 3.03 |
| Plan plus three-unit re-entry | 21.30R | 0.04R | -6.38R | 9.05R | 2.35 |
On this index, over this uptrending window, the re-entry did not lose money on average. That is the honest finding, and it is why traders defend the habit.
The cost of revenge trading is in the shape. In this guide's E-mini study, every step up the ladder added the same 1.20R of return, but the drawdown added 0.28R, then 0.99R, then 2.43R. The worst single day went from -1.00R to -4.59R at double size. A 10,000-draw bootstrap resample of all 592 signals put the two-unit policy ahead of the plan in 63.6% of draws, with a difference interval of -11.96R to 16.03R, so even the average edge is far from settled.
Dollar Cost of the Worst Revenge Trading Day
On 3 September 2020 the session opened at 3,578.75 and the stop sat at 3,536.77, so 1R was 41.98 points. That is $209.88 on one Micro E-mini S&P 500 (MES, $5 per point) or $2,098.84 on one E-mini (ES, $50 per point).
The planned trade lost its $209.88. A re-entry at the stop price, held to the 3,461.50 close, lost another $376.37 on one MES, making the day -$586.25. The session's low of 3,424.50 sat 2.67R below the stop, so the no-stop assumption is not a technicality. Doubling the re-entry turns the day into -$962.62 on one MES, or -$9,626.16 on one ES.
The case traders remember looks different. On 1 December 2017 the session opened at 2,640.75 with the stop at 2,623.39, a 17.36-point 1R worth $86.78 on one MES. The re-entry closed at 2,644.00 for 1.19R, or $103.03, and the day finished at +$16.25 instead of a loss. One good save of $16.25 against one bad day of -$586.25, on the same rule, is the revenge trade in miniature.
The Same Revenge Rule on Nasdaq-100 Futures
One market is one sample, so this guide ran the identical revenge re-entry test on E-mini Nasdaq-100 continuous front-month daily bars (NQ=F) from 18 September 2006 to 4 November 2026. The rule is unchanged: a close above the prior 20-session high, a long at the next open with a stop one 14-session ATR below, and a same-session re-entry at the stop price held to the close with no stop. It produced 627 signals and 38 stop-outs, 6.1%.
| Nasdaq-100 policy | Total return | Worst day | Max drawdown |
|---|---|---|---|
| Plan only | 35.75R | -1.00R | 7.29R |
| Plan plus one-unit re-entry | 34.76R | -3.80R | 9.22R |
| Plan plus two-unit re-entry | 33.76R | -6.61R | 11.16R |
| Plan plus three-unit re-entry | 32.77R | -9.41R | 13.75R |
In this guide's Nasdaq-100 run, the revenge re-entry lost on average as well, -0.03R per stop-out, and only 1 of 38 recovered the full 1R even though 23 of 38 closed profitable. The two-unit policy beat the plan in only 43.2% of 10,000 resamples.
Two markets gave two answers on the average and the same answer on the tail. If you want a reason not to take the second trade that holds up on your own account, use the worst day and the drawdown. Those transfer. The average does not.
Stop-Loss Rules and Position Size After a Loss
Revenge trading does its damage through risk, so the strongest defenses against revenge trading are risk rules that the post-loss state cannot edit.
Set size from the stop distance, never from the loss. Imagine a trader with a $200 per-trade risk budget on MES. A 20-point stop costs $100 per contract, so the plan says 2 MES. After a loss, the revenge version is 4 MES with the same stop, $400 at risk, which is a 2R bet wearing a 1R label. The fix is mechanical: the next trade's size comes from its own stop distance and your normal budget, every time.
Keep the stop where the plan put it. Widening a stop after entry to avoid a second loss turns a defined 1R trade into an undefined one. On 3 September 2020, the E-mini S&P 500 session's low finished 2.67R below a breakout stop level, which is how far a day can run when a re-entry has no stop.
Cap the day in R, not only in dollars. A daily cap of 2R with a $200 per-trade budget is a $400 day. Expressing it in R keeps the rule consistent when volatility changes your stop distance.
Count the re-entry against the day. A re-entry at half size is still escalation on a day that has already shown an adverse move. Every position opened after a loss counts toward the same daily cap.
Rules of thumb like the 3-5-7 rule (risk at most 3% per trade, 5% across all open positions, and aim for winners at least 7% larger than losers) are informal heuristics, not exchange or regulatory rules. For a futures day trader they are a starting point to be translated into contracts and R, not a substitute for a written daily cap.
Related lesson: Daily and weekly loss limits
A Post-Loss Protocol to Stop Revenge Trading
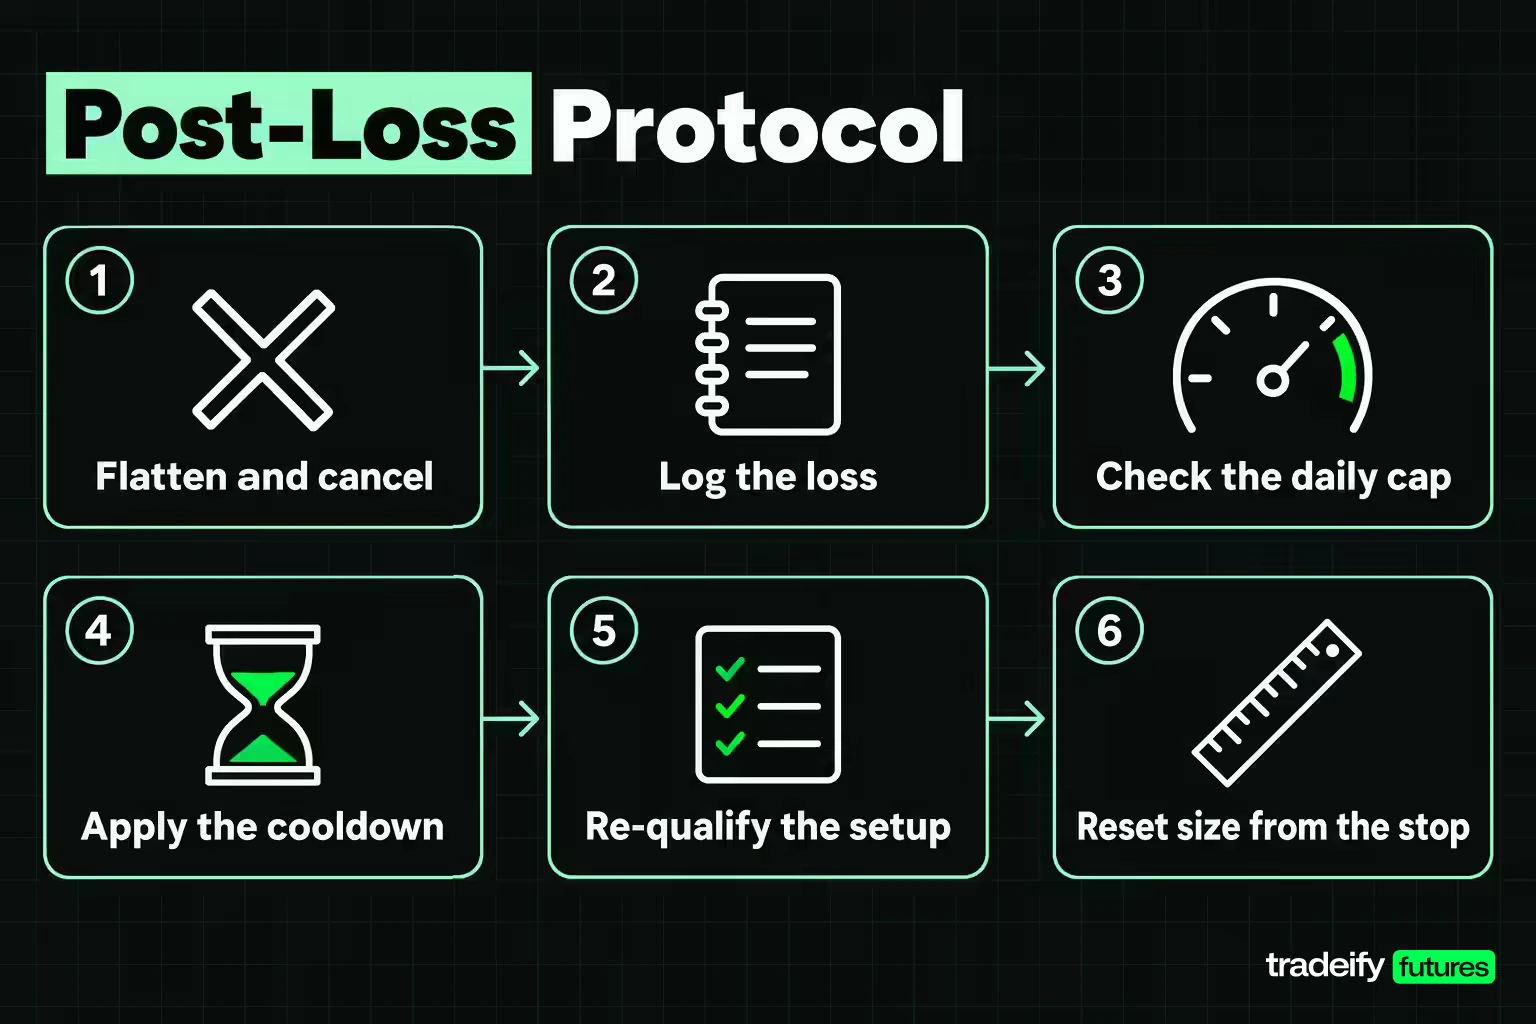
A post-loss protocol is a short checklist written before the session to stop revenge trading, so the only decision left at the moment of a stop is whether the rule fires.
- Flatten and cancel. Close any remaining position in that instrument and cancel resting orders.
- Log the loss immediately. Record the setup name, the R lost, and whether the trade followed the plan.
- Check the day. If the day's realized loss has reached the cap, the session is over.
- Apply the cooldown. After a full 1R stop, no new entry for the period your plan names. The strict version is flat until the next session.
- Re-qualify. Any next trade must meet the full written setup criteria and pass the flat-day test.
- Reset size. Size comes from the new stop distance and the normal budget, never from the amount lost.
Waiting Versus Re-Entering After a Stop-Out
This guide's 20-year E-mini S&P 500 breakout study (592 signals, a stop of one 14-session ATR, exit at the close) measured the strict cooldown directly. For each of its 34 stop-outs, the alternative to re-entering was no more trades that day, then a long at the next session's open, exited at its close, in the same R units.
| Choice after a stop in this guide's E-mini study | Average R | Approximate 95% interval |
|---|---|---|
| Wait for the next session | 0.10R | -0.15R to 0.36R |
| Re-enter at the stop price | 0.04R | -0.17R to 0.24R |
| Difference, wait minus re-enter | 0.07R | -0.22R to 0.36R |
Be honest about what that table says. Thirty-four cases cannot separate the two choices on the average, because every interval crosses zero.
What this guide's sample does show is narrower and still useful. Waiting was the better choice on 58.8% of stop-outs, the next session opened lower on 64.7% of them, and the worst waiting outcome was -1.27R against -1.79R for the worst re-entry. Waiting cost very little in this data, and it takes the decision away from the worst possible moment to make it.
Emotional Management Techniques for the Revenge Urge
You cannot stop the revenge urge from showing up after a stop. Nobody can. You can make sure it has nowhere to go, which is what managing revenge trading emotionally actually means.
- Break the physical loop. Stand up and leave the screen for a set period after a full stop. The aim is distance between the trigger and the next order, not a perfect mood.
- Name the feeling in the journal. Writing "I want this back" next to the trade time turns a vague state into a data point you can review later.
- Use if-then statements written in advance. "If I take a full 1R stop, then I am flat until the next session." A pre-written condition is easier to follow than a decision made while frustrated.
- Change what is in front of you. Close the P&L display, collapse the DOM, or switch the chart to a higher timeframe during the cooldown. A live dollar figure pulls attention back to the loss.
- Use the platform's lockout. Many trading platforms let you set a personal daily loss limit or lock yourself out of order entry for a period. A lockout works when willpower does not.
- End the day on a rule. Decide in the plan what ends the session: a cap hit, a number of losses, or a time. Then a red day ends by design, not by exhaustion.
Related lesson: Avoiding trading tilt
Writing Revenge Trading Rules Into Your Trading Plan
A trading plan that only covers entries leaves the most dangerous decision of the day, what to do after a loss, to be made live, which is exactly where revenge trading starts. These clauses close that gap.
| Plan clause | Example wording | Why it exists |
|---|---|---|
| Per-trade risk | Every trade risks 1R, sized from its own stop distance | Stops a loss from setting the next size |
| Daily cap | The session ends at a realized loss of 2R | Caps the tail that revenge trades create |
| Post-stop cooldown | After a full 1R stop, no entry until the cooldown ends | Removes the fastest revenge entry |
| Setup list | Only named setups with written criteria qualify | Blocks thin entries taken to get back to even |
| Instrument list | Only the markets named in the plan | Stops the switch to a faster market |
| Stop handling | Stops are never widened after entry | Keeps 1R from becoming undefined |
| Override log | Any rule break is logged with a reason | Turns exceptions into reviewable data |
Write the plan when the market is closed. Rules written in the middle of a drawdown are not rules, they are negotiations, and you will be negotiating with yourself at your weakest.
Related lesson: How to create a trading plan
Journaling Revenge Trades With Tags
A trading journal turns revenge trading from a vague worry into a number. The trick is to tag entries at the time of the trade, not reconstruct them afterward.
For each entry, record three yes-or-no answers:
- Would I take this at normal size if my last trade had closed flat?
- Is this setup on my written list?
- Was I inside the cooldown or past the daily cap?
Any "no" on the first two, or "yes" on the third, gets a revenge tag. Then once a month, compare tagged against untagged trades:
- Share of all trades that carry the tag.
- Total and average R of tagged trades.
- Share of the month's drawdown that came from tagged trades.
- Average size of tagged entries against untagged ones.
This guide's own 20-year E-mini S&P 500 breakout study, with a once-a-day signal, produced only 34 post-stop decisions in two decades. An active intraday journal can produce that many in a few busy months, on your own account and your own execution. That is a better sample for deciding your rules than any backtest.
Related lesson: How to keep a trading journal
How Revenge Trading Differs in Futures, Stocks and Crypto
The urge to win it back is the same everywhere, but the market structure decides how much damage one session of revenge trading can do and what kind of rule stops it.
- Futures. Leverage means a small move in points is a large move in dollars, and size can be doubled with one click. E-mini S&P 500 futures trade from Sunday 6:00 PM to Friday 5:00 PM ET with a daily one-hour break, so there is almost always a market open to take the next trade.
- Prop firm evaluations and funded accounts. These usually come with a daily loss limit and a maximum drawdown. A revenge sequence that would be a bad day on a personal account can end an evaluation, because the limit counts the second trade's loss and the first one's together.
- Stocks. Individual names gap and halt, and switching to a hotter ticker after a loss is the stock version of the instrument switch.
- Crypto and spot forex. Markets that trade around the clock have no natural session end, so the cooldown has to be a rule you set rather than a closing bell.
On our accounts, the Daily Loss Limit on Growth, Lightning and Select Daily Funded accounts is a soft breach: it pauses trading for the rest of the day and you can trade again the next session after 6:00 PM ET. It is not a stop, and losses can run past it before it triggers, so your own daily cap should sit well inside it. Tradesea, one of our supported platforms, includes personal lockouts built as a cooling-off tool, and Tradovate's Risk Settings let you set your own daily loss limit. Funded accounts are simulated.
Long-Term Habits That Prevent Revenge Trading
Short-term rules stop the next revenge trade. Long-term habits make revenge trading less tempting and the rules easier to keep.
Judge days by process, not P&L. Score each session on whether you followed the plan. A losing day with every rule followed is a good day of trading. A green day built on a revenge trade is a bad one that happened to pay.
Think in samples. A rule's edge shows up over hundreds of trades. One stop is one line in that sample, which makes it much harder to treat as something that has to be fixed today.
Know what a bad day costs to heal. In this guide's 20-year E-mini S&P 500 breakout study with 592 signals, the planned trade earned about 0.03R per signal. At that rate, a normal 1R stop takes about 33.5 signals, roughly 1.1 years, to earn back. The worst double-size revenge day, -4.59R, takes about 153.5 signals, roughly 5.2 years. Seeing the second trade in years instead of dollars changes how appealing it looks.
Get a second reader. A trading partner, mentor or coach who reviews your tagged trades each month will spot patterns you explain away.
Review the rules quarterly, never mid-session. If the cooldown feels too strict, look at the tagged and untagged numbers over a full quarter before changing it.
Related lesson: Trading discipline
Revenge Trading FAQ
How do I stop revenge trading?
Remove the decision instead of resisting it. Write a per-trade risk in R, a daily cap, and a cooldown after any full stop before the session starts, and use a platform lockout if your software has one. Then tag every entry taken inside the cooldown and review the tags monthly.
What is the 3-5-7 rule in trading?
It is an informal risk heuristic: risk no more than 3% of the account on one trade, keep total open risk at or under 5%, and aim for winners at least 7% larger than losers. Versions differ, and it is not an exchange or regulatory rule. Futures day traders usually need tighter, contract-based limits than these percentages.
Does trading really work?
Trading can work for some people, but the evidence is sobering. In a study of Brazilian index-futures day traders by Chague, De-Losso and Giovannetti, 97% of the 1,551 who persisted more than 300 days lost money. A written plan, strict risk limits and an honest journal are what give a trader a fair test of whether a strategy has an edge.
Is it possible to make $10,000 a month day trading?
It is not a figure any trader can plan on, because there is no reliable data on what an individual can earn and studies of retail day traders show most lose money. A monthly income target also tends to cause revenge trading, because a red week turns into pressure to catch up. Focus on whether your rules show a positive edge over a large sample.
How do you build strong psychology in trading?
Strong trading psychology comes mostly from structure, not toughness. Pre-written rules, consistent size, a daily cap and a journal reduce the number of decisions you make under stress. Reviewing your own tagged trades shows you where your discipline actually breaks.
How long should a cooldown be after a loss?
A cooldown should last long enough that the revenge urge has passed and short enough that you actually keep it, with the daily cap ending the session regardless. In this guide's 20-year E-mini S&P 500 study of 34 stop-outs, waiting until the next session beat an immediate re-entry on 58.8% of them, though the average difference was too small to call.
This article is educational, not financial advice, and futures are leveraged products where losses can exceed what you expect on a single day. The E-mini and Nasdaq-100 study uses historical continuous front-month data without commissions or slippage, past or modeled results do not predict future results, prop firm evaluation and funded accounts are simulated, and no rule here guarantees a profit or prevents a loss.


