




TL;DR: Recovering from a drawdown is a sizing decision before it is a strategy decision. A 50% loss needs a 100% gain, so depth is what you control. On 592 E-mini breakout trades, most holes cleared fast, but the worst took 189 trades to clear after its low. Cutting size barely sped recovery, but it cut the chance of breaching a 10% limit from 20.57% to 7.20%.
Recovering from a drawdown starts with one uncomfortable question. Is the hole you are in a normal part of how your method trades, or a sign something broke?
Most traders answer it by feel, usually on the worst afternoon of the month. That is exactly when size creeps up, stops drift and a written rule quietly turns into a hunch.
This guide answers it with numbers instead. It covers the recovery arithmetic, then a 20-year study of drawdowns on one stated E-mini rule, then the decisions that follow: what to do at each depth, how to size, what to protect, what to change and how funded-account floors change the problem.
What Recovering from a Drawdown Means
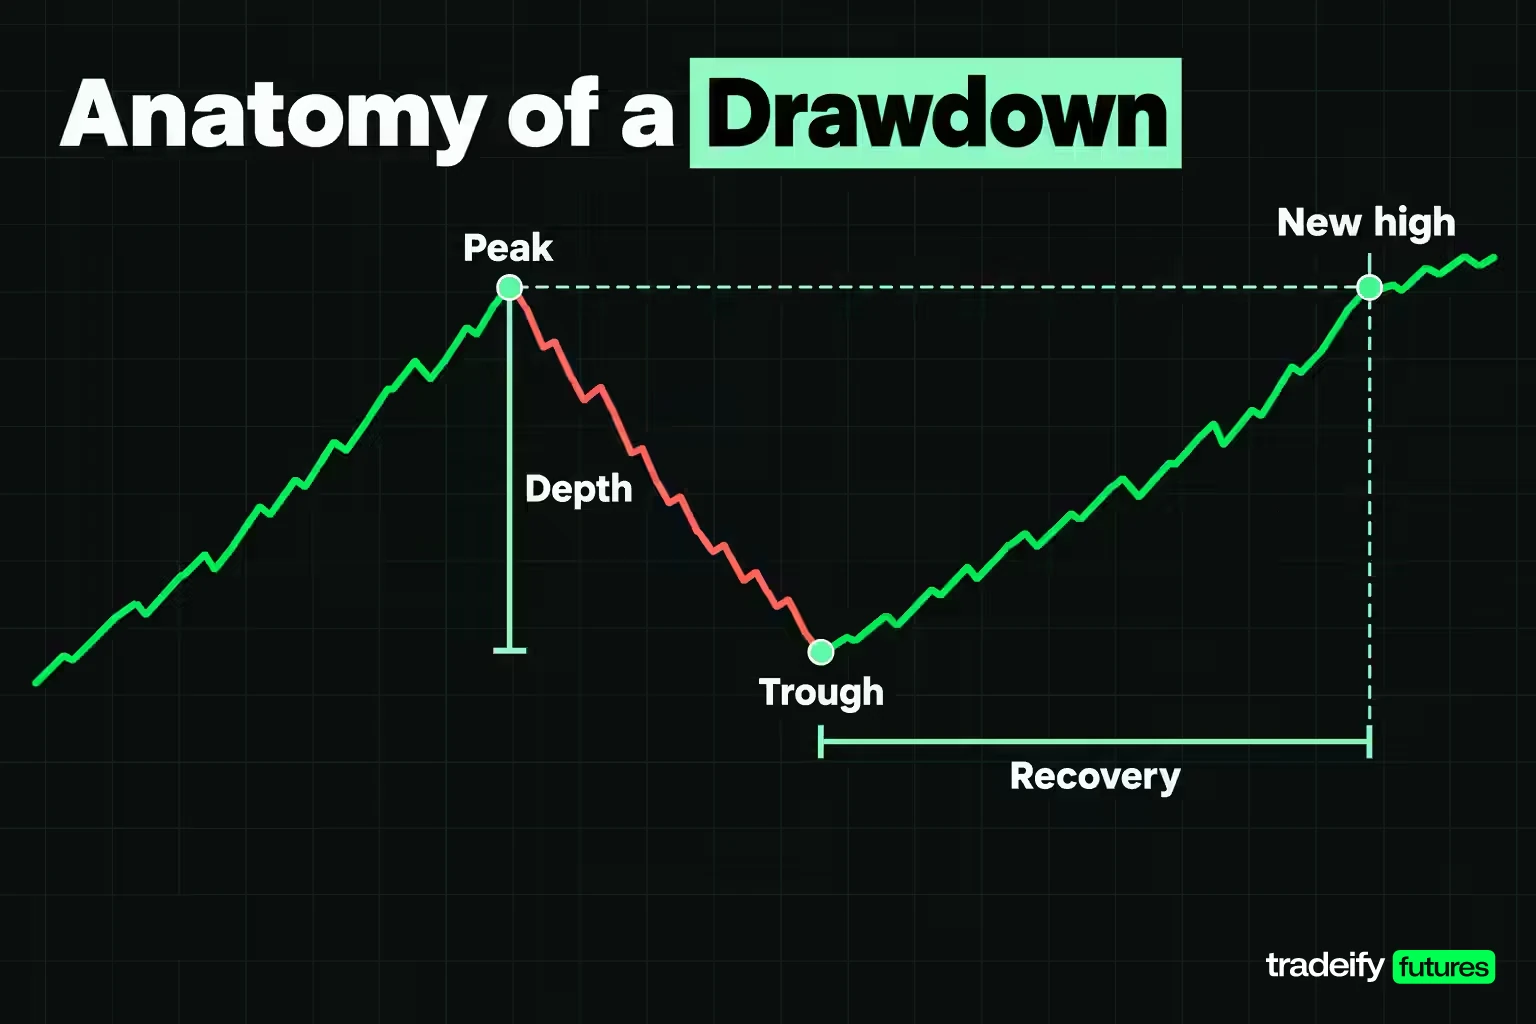
A drawdown is the decline from an account's highest value (the peak) to the lowest value that follows it (the trough). Recovering from a drawdown means getting back to that peak and making a new high. Until the new high prints, the drawdown is still open, however good the last few days felt.
Two measurements describe every drawdown, and they answer different questions.
- Depth is how far the account fell, in dollars, in percent of the peak, or in R (multiples of the planned risk on one trade).
- Recovery is how long the climb back took, in trades and in calendar time.
Drawdown risk is the chance that an account falls far enough, for long enough, to force a decision you did not plan for: a margin call, a breached account limit, or simply a trader who abandons the method before it recovers.
How to Calculate and Track a Drawdown
The calculation is simple. Drawdown in percent equals the peak minus the current value, divided by the peak. An account that peaked at $50,000 and now sits at $45,000 is in a 10% drawdown.
Tracking it in R is more useful for a trader, because R ties the depth to your own risk unit. If you risk $250 per trade, that same $5,000 decline is a 20R drawdown. Twenty losing trades' worth of hole tells you far more about your method than "down 10%" does.
Log four numbers for every drawdown episode in your journal:
- The peak value and date.
- The trough value and date, and the number of trades from peak to trough.
- The date of the new high, and the number of trades from trough to new high.
- The depth in R, measured with the risk unit you defined before each trade.
A handful of episodes logged this way gives you a personal base rate. Without one, every drawdown feels like the worst one ever.
Related lesson: Maximum drawdown
Drawdown Recovery Math and the Gain Needed to Break Even
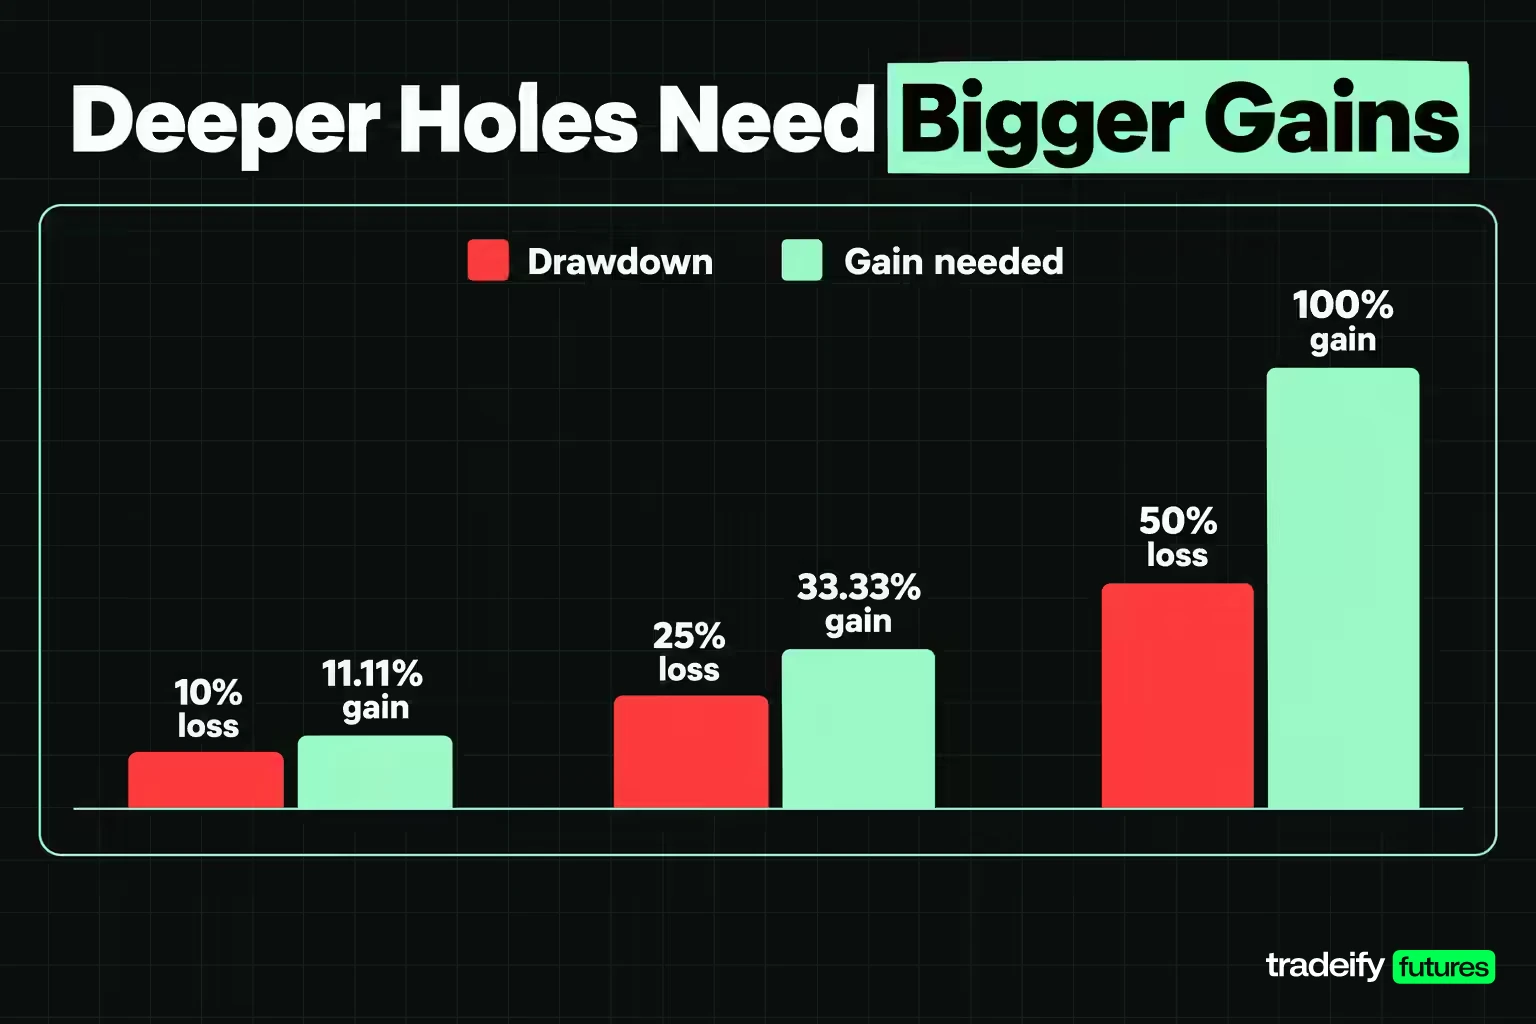
Drawdown recovery is harder than the decline because the gain is earned on a smaller base. Lose 10% and you need 11.11% to get back. Lose 50% and you need 100%. The formula is the depth divided by one minus the depth.
| Drawdown depth | Gain needed to recover | Straight 2R winners needed at 1% risk |
|---|---|---|
| 5% | 5.26% | 3 |
| 10% | 11.11% | 6 |
| 20% | 25% | 12 |
| 25% | 33.33% | 15 |
| 30% | 42.86% | 19 |
| 40% | 66.67% | 26 |
| 50% | 100% | 36 |
| 60% | 150% | 47 |
| 75% | 300% | 71 |
The third column assumes each winner returns 2% of current equity (a 2R winner at 1% risk), with no losers in between. Real recovery includes losers, so these counts are the floor, not the forecast.
The table shows why a 50% drawdown is harder to recover than a 10% one. The required gain does not grow in step with the loss. It accelerates. Going from a 10% hole to a 20% hole more than doubles the gain needed, from 11.11% to 25%.
Depth also damages compounding. Every percent of growth after a drawdown is first spent refilling the hole, so the account compounds from a smaller base for as long as the recovery lasts. A shallow drawdown costs a few weeks of growth. A deep one can cost years, which the study below measures directly.
A 20-Year Drawdown Study on E-mini Breakout Trades
General advice about drawdowns is easy to write and hard to check. So this guide measures drawdowns on one simple, fully stated rule, and reports what happened. It is an illustrative study of one rule on one market, not a recommendation to trade it.
The data is the front-month continuous E-mini S&P 500 futures series (ES=F) on daily bars from Yahoo Finance: 5,066 sessions from September 18, 2006 to November 3, 2026. The rule:
- Signal. A session closes above the highest high of the prior 20 sessions.
- Entry. Long at the next session's open, one unit.
- Stop and target. 1.0 and 2.0 times the 14-session Wilder average true range, both set at the signal bar. The stop distance is 1R.
- Time exit. At the close of the 20th session after entry if neither level is hit.
- Fills. A session that opens beyond the stop fills at that open. On a session that touches both levels, the stop counts first.
- Cost. 0.5 index points per round turn, about 1.31% of the average risk unit.
Every signal was taken, so trades can overlap. The rule produced 592 trades, about 29.41 a year. It won 40.20% of the time, with an average winner of 1.83R and an average loser of 1.01R. The result was 0.1301R per trade and 77.02R in total. Exits split into 345 stops, 203 targets, 40 time exits and 4 gap fills.
The average risk unit was 38.20 index points. On one ES contract at $50 per point, that is about $1,910 of risk per trade. On one Micro E-mini (MES) at $5 per point, it is about $191.
That is a small edge. A small edge matters here, because a small edge takes many trades to climb out of a hole measured in units of that edge.
Every Drawdown of 3R or Deeper in the Study
In the 20-year E-mini breakout study, the rule's equity curve, counted in R, had 17 separate drawdown episodes. Four were shallower than 3R, the kind of dip one or two losing trades produce. The 13 episodes of 3R or deeper are listed below. Dates are the exit dates of the trades that set each peak, trough and new high.
| Peak | Trough | New high | Depth in R | Trades down | Trades up |
|---|---|---|---|---|---|
| Start, Sep 18, 2006 | Jan 12, 2010 | Jan 9, 2017 | 22.09 | 68 | 189 |
| Jan 9, 2017 | Jan 30, 2017 | Feb 15, 2017 | 3.08 | 3 | 2 |
| Mar 1, 2017 | Aug 10, 2017 | Oct 13, 2017 | 6.27 | 9 | 5 |
| Oct 23, 2017 | Nov 9, 2017 | Nov 30, 2017 | 5.21 | 5 | 3 |
| Jan 29, 2018 | Jun 19, 2018 | Mar 4, 2019 | 8.14 | 8 | 21 |
| Mar 14, 2019 | Mar 22, 2019 | Apr 30, 2019 | 4.06 | 4 | 3 |
| Apr 30, 2019 | Sep 24, 2019 | Nov 19, 2019 | 6.20 | 12 | 4 |
| Nov 26, 2019 | Dec 2, 2019 | Jan 2, 2020 | 5.10 | 5 | 3 |
| Jan 2, 2020 | May 1, 2020 | Aug 24, 2020 | 7.34 | 13 | 9 |
| Sep 2, 2020 | Sep 9, 2021 | Dec 13, 2023 | 20.74 | 47 | 55 |
| Feb 22, 2024 | May 29, 2024 | Oct 21, 2024 | 8.10 | 11 | 8 |
| Oct 22, 2024 | Dec 31, 2025 | May 7, 2026 | 14.49 | 40 | 8 |
| Jun 1, 2026 | Oct 8, 2026 | Still open | 10.06 | 10 | Open |
The last row is live. As of November 3, 2026, the rule sits 10.06R below its June 2026 peak, which is the position a trader in a drawdown is actually in: no idea yet which row it will turn into.
How Long Drawdown Recovery Takes
Drawdown recovery runs on two clocks. The relief clock is short: a couple of winners arrive and the pressure lifts. The account clock is long: the drawdown is not over until the equity curve makes a new high. Most expensive decisions in a drawdown, like sizing up to get it back, happen because the relief clock says "done" while the account clock is still running.
This guide's 20-year E-mini breakout study (592 trades on ES daily bars, 2006 to 2026) shows how differently those clocks can run. Among its 12 completed episodes of 3R or deeper, the median episode took 10 trades to reach its trough and 6.5 trades to climb back to a new high. In that study, 9 of the 12 recovered in fewer trades than they took to fall, and 9 of the 12 were back within 10 trades of the trough.
The other 3 episodes in the E-mini study recovered more slowly than they fell, and those 3 dominate the time spent under water. The tail is where the planning belongs. The study's deepest episode fell for 68 trades, from the start of the test to January 2010, and then needed 189 trades and 6.99 calendar years to make a new high. The second deepest, 20.74R, needed 55 trades and a little over two years.
The account clock also explains a result from the same E-mini breakout study that surprises most traders: 91.39% of the rule's trades were taken while its equity curve sat below an earlier peak. Being below your high is the normal state of a trading account. On its own, it is not a sign that anything is broken.
How Much Deeper a Drawdown Goes After You Notice It
The hardest part of a drawdown is not knowing whether you are at the bottom. To put a number on it, the 592 trade results from this guide's 20-year E-mini breakout study were resampled into 20,000 recovery paths starting from a hole of a given depth, each ending at a new high or after 250 trades.
Two resampling methods are reported, because they disagree for a reason. The independent draw picks trades one at a time at random. The block draw picks runs of 5 consecutive trades, which keeps the clustering in the real results. That clustering is strong: the lag-one autocorrelation of the trade results was 0.49, so a losing run on this rule really did tend to keep running.
| Visible hole in the E-mini study | Median further decline, block draw | 90th percentile, block draw | Median further decline, independent draw | Paths back to a new high within 250 trades, block draw |
|---|---|---|---|---|
| 5R | 4.06R | 20.99R | 3.03R | 95.89% |
| 10R | 5.52R | 25.66R | 3.84R | 91.83% |
| 20R | 7.31R | 27.63R | 4.38R | 82.43% |
Read the 10R row of the E-mini study carefully. From a visible 10R hole, the median block-draw path in that resample went another 5.52R deeper before it turned, and 54.96% of paths went at least 5R deeper. The further decline did not shrink as the hole got deeper. It grew.
The practical rule follows directly: stop treating the current low as the bottom. Plan with the hole you are in plus a typical further decline, because that is the hole you may actually have to survive.
The Base Rate for Drawdown Depth
A second resample of the same E-mini breakout trades asks how deep a drawdown tends to run at all. It ran 40,000 peak-to-peak cycles and kept only the cycles that dipped below their starting peak, since a trader reading this mid-drawdown belongs to that group.
| Drawdown depth measure in the E-mini study | Block draw | Independent draw |
|---|---|---|
| Median depth | 4.11R | 2.05R |
| 75th percentile | 8.93R | 4.35R |
| 90th percentile | 17.54R | 9.16R |
| 95th percentile | 25.68R | 13.27R |
| Share deeper than 5R | 46.77% | 23.88% |
| Share deeper than 10R | 22.23% | 8.57% |
| Share deeper than 20R | 7.97% | 1.81% |
The study's recorded history sides with the block draw. Four of the 13 recorded E-mini episodes of 3R or deeper ran past 10R. If you only ever test your method with independent draws, you will understate how deep your drawdowns can go.
Recovery Strategies for Each Drawdown Depth
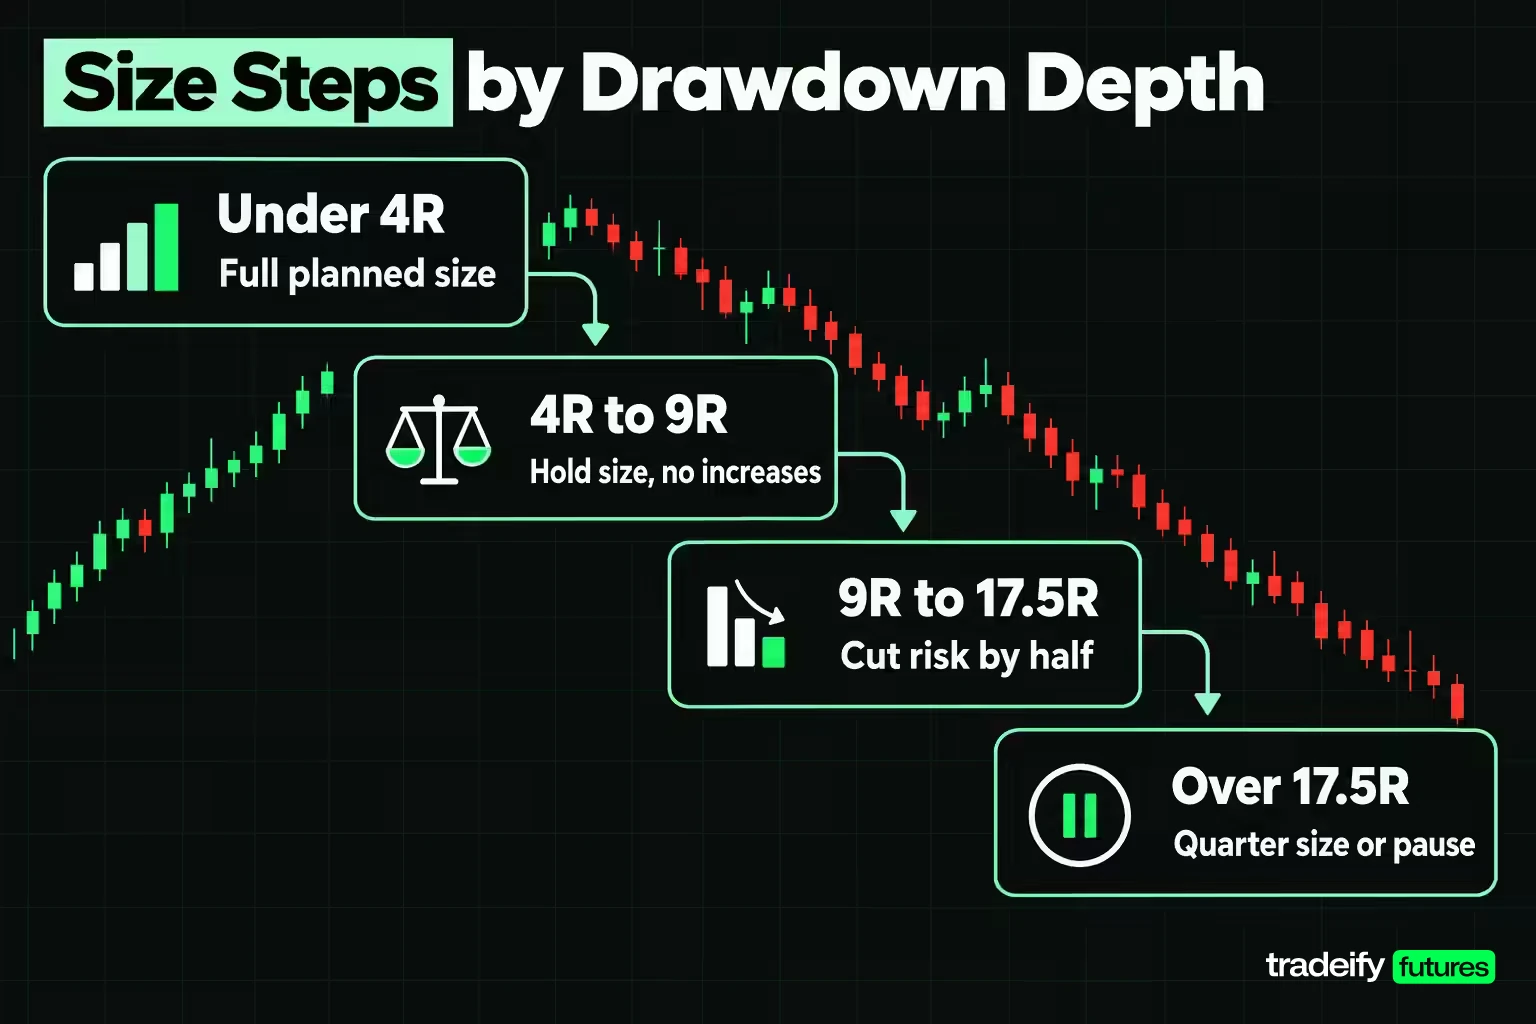
A recovery strategy that works at 3R can be wrong at 15R. The bands below come from the block-draw base rate in this guide's 20-year E-mini breakout study and are expressed in R so you can apply them to any account. They are one example protocol; set your own bands from your own log once you have enough episodes.
| Drawdown band | Where it sits in the E-mini study | Size step | Main job |
|---|---|---|---|
| Under 4R | Below the median dipped cycle | Full planned size | Keep trading the written rule and log every trade |
| 4R to 9R | Median to 75th percentile | Hold size, no increases | Audit execution against the rule once, then trade on |
| 9R to 17.5R | 75th to 90th percentile | Cut risk per trade by half | Check the room left under any hard limit in R |
| Over 17.5R | Beyond the 90th percentile | Quarter size or pause | Review the method on a sample, not on recent trades |
A step-by-step method for recovering from a drawdown, done before the session opens rather than during it:
- Write the current depth in R, using the risk unit you set at entry, not the dollar amount you feel you have lost.
- Find the band, then apply its size step. Depth changes size. It does not change your entry rule.
- Write the gain needed on the smaller base next to the depth, using depth divided by one minus depth.
- Set the condition for moving back up a band as a number, such as a new equity high or recovering half the hole, so you can check it without judgment.
- Trade the written rule at the new size, or do not trade that session. Improvising inside a hole turns a measured drawdown into an unmeasured one.
The bands do not promise anything about the next trade. Their job is to make the next decision small, written and a little boring, which is exactly what you want in a hole.
Related lesson: The session after a loss inside the hole
Position Sizing While Recovering from a Drawdown
The standard advice when recovering from a drawdown is to cut your position size. This guide's 20-year E-mini breakout study shows exactly what that does and what it does not do. The table replays the study's worst episode (22.09R) with a fixed fraction of current equity risked per trade, and pairs it with the block-draw chance that a dipped cycle breaches a 10% account limit.
| Risk per trade | Worst episode depth | Gain needed to recover | Trades from peak to new high | Chance a dip breaches a 10% limit, block draw | Same, independent draw |
|---|---|---|---|---|---|
| 0.25% | 5.41% | 5.72% | 257 | 1.26% | 0.08% |
| 0.5% | 10.59% | 11.84% | 262 | 7.20% | 1.68% |
| 1% | 20.29% | 25.46% | 263 | 20.57% | 8.07% |
| 2% | 39.00% | 63.94% | 264 | 39.32% | 21.68% |
On a $50,000 account at 1% risk, the worst episode removed $10,145.79 and left $39,854.21, which then needed a 25.46% gain. At 0.5% risk, the same trades removed $5,294.95 and needed 11.84%.
Here is the part most traders expect and do not get. In the E-mini study, cutting size from 1% to 0.5% changed the recovery time from 263 trades to 262. The hole in R is a property of the trades, not the size, so a smaller size climbs a smaller hole at almost the same speed. What halving size did change was survival: the chance of breaching a 10% limit fell from 20.57% to 7.20% in the block draw.
That is the honest case for sizing down. It is not a faster recovery. It is a much better chance of staying in the game long enough to see the recovery at all.
The reverse move, sizing up to win it back, gets the trade-off backwards. At 2% risk the same episode would have cut the account by 39.00% and demanded a 63.94% gain. Larger size makes the next losing run more expensive and leaves the time to recover unchanged.
Related lesson: Fixed fraction sizing behind the recovery arithmetic
Risk Management Rules That Keep a Drawdown Shallow
The cheapest drawdown recovery is the one you never need. Drawdown risk management works on the inputs that set depth: risk per trade, the stop, daily and weekly loss limits, and how many correlated positions are open at once.
- Risk per trade. With risk fixed in dollars, depth in percent is about the depth in R times your risk per trade. The 90th-percentile dip of 17.54R in this guide's E-mini breakout study is about a 17.54% hole at 1% risk and about 8.77% at 0.5%. Pick the risk per trade from the depth you could live through, not from the profit you want.
- Stop placement. A stop belongs where the trade idea is wrong, set before entry and not moved further away once price approaches it. A stop that drifts makes every R bigger than planned, and the drawdown deeper than your log says.
- Daily and weekly loss limits. A hard daily limit caps how many R a single bad session can add to the hole. It works best set as a number of R, such as three losing trades, and enforced by your platform rather than by willpower.
- Correlated positions. Long ES and long NQ at the same time is close to one bigger trade, because the two indexes usually move together. Count total open risk across correlated positions, not per position.
The 3-5-7 rule is a popular informal version of these ideas. Its common form says risk no more than 3% on one trade, keep total open risk at or under 5%, and aim for winners at least 7% larger than losers. It is a rule of thumb from trading educators, not an exchange or regulatory rule, and 3% per trade is aggressive by the E-mini study's numbers: a 17.54R dip at 3% risk would take roughly 41% to 53% of the account, depending on whether the 3% is a fixed dollar amount or a fraction of current equity.
Related lesson: Sizing a position so a hole stays survivable
Capital Preservation During a Drawdown
Capital preservation during a drawdown means one thing in practice: protect your ability to keep trading the method until its edge has a chance to show up again. Every dollar of capital you keep is a dollar that does not need the larger percentage gain to come back.
Start with the distance to your hard floor, measured in R. Say a hypothetical account has $3,000 of room left before a hard limit and risks $300 per trade. That is 10R of room. In this guide's E-mini breakout study, the median further decline from a visible 10R hole was 5.52R, and the 90th percentile was 25.66R. With 10R of room, a typical continuation fits. A bad one does not.
The arithmetic gives you three ways to buy room:
- Lower the risk per trade. Cutting $300 to $150 turns the same $3,000 into 20R of room.
- Trade fewer setups. Take only the cleanest signals your rule defines, which reduces exposure without changing the rule itself.
- Stop for the day sooner. A tighter daily limit keeps one session from eating a third of the remaining room.
What capital preservation is not: moving stops wider to avoid taking the loss, averaging down into a losing position, or holding a trade past its planned exit to "give it room". Each of those keeps the account number higher for an hour and makes the eventual drawdown deeper.
Drawdown Psychology and the Urge to Win It Back
Drawdowns hurt more than the same amount of profit feels good. Kahneman and Tversky's prospect theory research describes this as loss aversion: losses loom larger than equivalent gains, and people become more willing to take risk when they are trying to avoid a loss. Inside a drawdown, that shows up as a very specific urge: make it back, today.
The urge has predictable forms:
- Revenge sizing. Doubling up on the next trade to erase the last one.
- Rule drift. Taking a setup that is "almost" valid because waiting feels like falling further behind.
- Freezing. Skipping valid signals after a run of losses, which often means missing the winners that would have started the recovery.
- Confidence collapse. Deciding the method is broken after a losing run that sits well inside its normal range.
Each of these is an understandable feeling and an expensive behavior. You will not stop feeling it. The fix is to make the important decisions before the feeling arrives. Write your size steps, your daily stop and your pause condition while the account is at a high, and treat them as fixed during the session.
Confidence comes back from evidence, not from one big winner. Track whether each trade matched the written rule, separately from whether it made money. A run of rule-following trades during a drawdown is real progress, even when the equity curve has not turned yet.
Related lesson: Counting the lapse that turns a rule drawdown into your own
When to Change a Strategy After a Drawdown
After a deep drawdown, the instinct is to change something. Sometimes that instinct is right. Often it swaps a method with a known drawdown profile for one with an unknown profile, right at the bottom of the old method's normal range.
Separate three causes before you change anything:
- Ordinary variance. The trades matched the rule and the depth sits inside your measured range. In this guide's E-mini breakout study, a 15-trade losing streak and a 14.49R episode in 2025 were both part of the same rule's history, which went on to make a new high in May 2026. Changing the rule here mostly resets your sample.
- Execution drift. The trades did not match the rule: late entries, moved stops, extra trades. The fix is the execution, not the rule. Count the lapses and the R they cost.
- A changed market or broken edge. The trades matched the rule, but the depth is well beyond anything in your history, or the win rate and payoff have shifted over a meaningful sample. This is the case for real adaptation.
A useful test is to compare the current episode with your own base rate. If your log shows past drawdowns of 4R to 9R and you are at 6R, there is little evidence for change. If you are past the deepest episode you have ever recorded, the method is outside its tested range, and reducing size while you review it on a large sample is reasonable.
When you do adapt, change one thing at a time, test it on historical data first, and restart at reduced size. Changing several parameters at once during a drawdown makes it impossible to tell later which change helped.
Related lesson: The rule whose drawdowns get measured
Scaling Back Up After a Drawdown Recovery
Scaling back up after a drawdown recovery is where many traders lose the gains they just rebuilt. The account reaches its old high, relief arrives, and size jumps straight back to full or beyond. If the next losing run arrives early, the new drawdown starts at a larger size.
A steadier approach to scaling back up:
- Use a written trigger. For example, return one band up the size ladder when the account recovers half the hole, and to full size only at a new equity high.
- Step, do not jump. Move from quarter size to half size to full size, one step per trigger, never skipping a step after a single big winner.
- Reset the reference point. After the new high, measure the next drawdown from that high. A trailing measurement keeps the scale honest.
- Keep the rule unchanged. Scaling is about size only. If you changed the method during the drawdown, the new version needs its own sample before it gets full size.
Size growth should follow the account, not the mood. A fixed-fraction method does this automatically, because risk per trade rises only as equity rises.
Recovering from a Drawdown in a Funded Account
Recovering from a drawdown in a prop-firm or funded account adds a hard constraint: a maximum drawdown limit that ends the account if it is touched. Many firms use a trailing drawdown, where the floor rises with the account's highest value. That changes recovery in two ways.
First, the floor does not come back down. In a hypothetical $100,000 account with a $3,000 trailing limit, a balance that peaks at $102,000 moves the floor to $99,000. A slide back to $100,500 leaves $1,500 of room, not $3,000. Second, the limit is usually a small number of R. On one ES contract, the average risk unit of about $1,910 in this guide's E-mini breakout study makes $3,000 just 1.57R of room.
So the real question in a funded account is not how to recover. It is how many R of room you have, and whether a typical further decline fits inside it. With $3,000 of room, surviving that study's 90th-percentile dip of 17.54R means risking about $171 per trade or less. That is why many prop traders size in micros: on one MES contract, the same study's average risk unit was about $191.
Funded accounts also deserve their own recovery rule: no sizing up to rebuild a buffer faster. A larger size shrinks the room in R at the moment you have the least of it.
On our accounts, the drawdown is an end-of-day trailing drawdown, enforced in real time on net liquidation value, and touching it fails the account. On Sim Funded accounts the floor locks at the starting balance plus $100; on a 50K Growth funded account with a $2,000 drawdown, it locks at $50,100 once the end-of-day balance reaches $52,100, while on evaluations it never locks. Our Growth evaluations also have a daily loss limit ($1,250 on a 50K) that puts the account in liquidation-only until the next trading day, and you can add your own daily and weekly limits with Tradovate's personal Risk Settings or a Tradesea lockout timer.
Drawdown Recovery FAQ
How long does it take to recover from a drawdown?
Most drawdowns recover quickly, but the deep ones can take years. In this guide's 20-year E-mini breakout study, the median episode of 3R or deeper recovered in 6.5 trades after its trough. The deepest needed 189 trades and 6.99 years, so plan around the tail, not the median.
What does drawdown risk mean?
Drawdown risk is the chance that an account falls far enough, or stays down long enough, to force an unplanned decision. That might be a breached account limit, a margin call or abandoning a sound method. It is managed mainly through risk per trade and hard loss limits.
What is the 3-5-7 rule in trading?
The 3-5-7 rule is an informal risk guideline. Its common form caps risk at 3% per trade and 5% across all open trades, and aims for winners at least 7% larger than losers. Versions differ, and it is not an exchange or regulatory rule.
What is a debt drawdown?
In lending, a drawdown means taking money from a loan or credit facility that has already been agreed, such as drawing on a line of credit. It shares the word with trading but means something different. A trading drawdown is a decline in account value from a peak.
Is a 20% drawdown bad?
A 20% drawdown needs a 25% gain to recover, so it is serious for most traders. Whether it is abnormal depends on your risk per trade. At 1% risk it is about a 20R hole, which sat beyond the 90th percentile of dips in this guide's E-mini breakout study.
Should you stop trading during a drawdown?
Stopping is reasonable when the drawdown is past your deepest recorded episode or your execution has drifted from the rule. Inside your normal range, reducing size usually beats stopping, because a pause can skip the trades that start the recovery.
A Drawdown Recovery Checklist for Your Own Log
A drawdown recovery checklist turns your own trading log into a base rate. Published studies, including the E-mini breakout study in this guide, describe one rule; your numbers come from your log, and one measured drawdown episode from your own history is enough to start.
- Find your highest equity point and the lowest point after it, and count the trades between them.
- Measure the depth in R, using your planned risk per trade.
- Count the trades from the trough to the new high, or mark the episode as still open.
- Repeat for every past episode you can find, and note the median and the deepest.
- Set your depth bands and size steps from that list, and write them down while the account is at a high.
- Check the room under any hard limit in R before each session in a drawdown.
Related lesson: The log you need to measure an episode from your own history
Futures trading involves substantial risk of loss and is not suitable for everyone, and leverage means losses can exceed what you expect. The study in this guide is a historical illustration of one rule on one market, not a forecast or a performance record, and past drawdowns do not limit future ones. Prop-firm evaluation and funded accounts are simulated trading accounts with their own rules. Nothing here is financial or investment advice.


