



TL;DR: Avoiding trading tilt means picking your next trade by your rule, not by how the last one felt. In 20 years of E-mini data, trades after a loss averaged +0.23R; doubling size after losses did the damage. Set circuit breakers before the session, such as a loss-count stop, a size cap and a lockout.
You take a clean loss. The setup was valid, the stop was where it belonged, and the market took it anyway. Ten minutes later you're in a trade you wouldn't have touched at the open, a little bigger than usual, because getting back to flat suddenly feels urgent.
That second trade is where tilt lives. Not the loss. The trade after it. This guide covers what tilt is, why it happens, the signs that show up in your order history and your body, and the rules that stop it. It also tests a question most tilt advice skips: does the trade after a loss actually perform worse, or is the damage in what you change?
What Trading Tilt Is
Trading tilt is a state where your last result, not your rule, is choosing your next action. The trigger is usually a loss, but it can be a big win, a stop that felt unfair, or a missed move. The behaviour is what gives it away: bigger size, faster entries, wider stops, trades outside your plan.
The word comes from poker, where a player on tilt adopts a worse strategy out of frustration and usually becomes too aggressive. Poker players borrowed it from pinball machines, which flash "TILT" and freeze the flippers when a frustrated player shoves the table. The image fits trading well. Once you start shoving, the game stops responding the way you expect.
Two versions matter for traders:
- Loss tilt. After a loss or a run of losses, you try to get the money back quickly. Revenge trades, doubled size and abandoned stops live here.
- Winner's tilt. After a strong win or a green streak, you feel the market is reading your mind. Oversizing, forcing marginal setups and skipping your checklist live here.
A useful test is narrow and checkable. Would you take this exact trade, at this exact size, if your last trade had gone the other way? If the answer is no, the last result is in charge.
Psychological Causes of Tilt in Trading
Tilt isn't a character flaw. It grows out of a few well-documented ways people respond to gains and losses, and every trader has all of them.
The break-even effect. In real-money experiments, Thaler and Johnson (1990) found that after prior losses, choices offering a chance to break even become especially attractive. That is the voice saying "one more and I'm flat." The trade is being picked for its ability to erase a number, not for its edge.
Loss aversion. Kahneman and Tversky's prospect theory (1979) showed that losses loom larger than gains, and that people turn risk seeking when every option involves a loss. After a red morning, a trader is choosing between losses, so bigger bets start to feel reasonable.
The house money effect. Thaler and Johnson also found more risk seeking after a prior gain. This is the engine of winner's tilt. Profit from earlier in the session feels like it isn't really yours, so it gets risked loosely.
The need to be right. Trading psychologist Brett Steenbarger describes tilt as a function of frustration, and frustration as often coming from the need to be right. If a stop-out reads as a verdict on you rather than one outcome in a sample, every loss becomes something to fight.
Fatigue and burnout. Long sessions, poor sleep and stress outside trading lower the threshold for all of the above. Tilt on a tired day needs a smaller trigger.
Related lesson: How a long run of pressure turns into exhaustion
The Stop-Out That Feels Unfair as a Tilt Trigger
The most common tilt trigger is the stop that hits at the low before price goes exactly where you said. It feels like proof the stop was wrong, and it pushes traders to widen or drop the next one.
It is also common. In this guide's own calculation on a 20-year E-mini S&P 500 breakout rule (buy a close above the prior 20-session high, stop at 1 ATR, target at 2 ATR, 20-session time limit), that experience came up again and again. Of 349 stop exits, 102, or 29.23%, later reached the original target inside the original 20-session window, a median of 11.5 sessions after the stop.
Now look at the mirror. Of 203 target exits, 37, or 18.23%, later traded back through the original stop, a median of 6 sessions after the exit. Both figures describe the same two price levels seen from opposite sides. Whichever edge you landed on, the other one was often reachable later. The 29.23% is not evidence of bad stop placement. It is what a chart looks like after you close any trade, and it is exactly the input that tempts a trader to move the next stop.
Warning Signs of Tilt
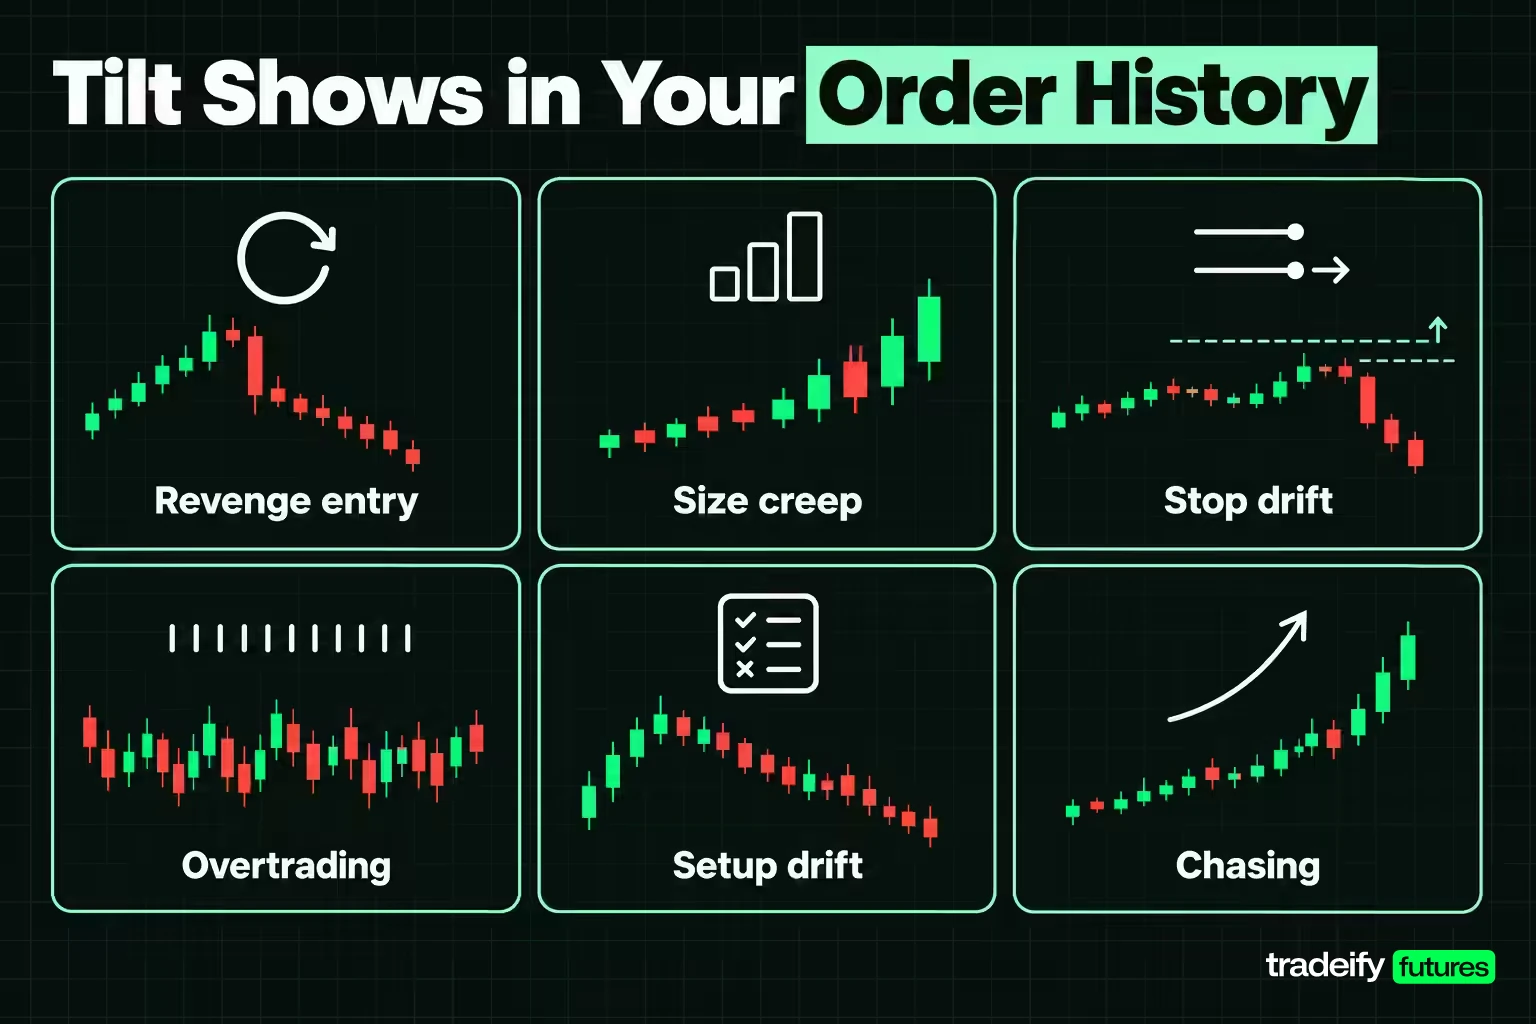
Tilt is easier to catch in your actions than in your feelings, because by the time you feel angry, the damage is usually done. These signs show up in an order history:
| Warning sign | What it looks like in your order history | Rule that catches it |
|---|---|---|
| Revenge entry | A new trade within minutes of a stop-out, same direction, same market | A fixed cooldown after any full loss |
| Size creep | Contract count rising after losses, not after a plan review | Size set at the start of the session, never changed during it |
| Stop drift | Stops moved further away or cancelled after entry | Stops placed with the entry as a bracket and never widened |
| Overtrading | Trade count well above your normal session | A maximum trade count per session |
| Setup drift | Entries that fail your checklist or come from a timeframe you don't trade | A written checklist checked before every order |
| Stacking | Several positions open in correlated markets on one idea | A cap on total open risk, not just per-trade risk |
| Chasing | Market orders after a move you missed | No entries more than a set distance from your planned level |
Mental signs come with them. You start narrating the market as personal ("it's hunting my stop"), you check P&L more than the chart, and you set a dollar goal for the rest of the day that has nothing to do with your setups.
Physical Symptoms of Tilt
Your body often reacts before you notice the change in your decisions. In a pilot study of 10 professional traders during live sessions, Lo and Repin (2002) recorded elevated skin conductance and cardiovascular responses during volatility spikes and intraday trend breaks, even in experienced traders. Coates and Herbert (2008) found that traders' cortisol on a London trading floor rose with the variance of their trading results and with market volatility.
Emotion is not the enemy here. Intensity is. In a follow-up study of 80 day-traders over a five-week program, Lo, Repin and Steenbarger (2005) found that traders whose emotional reactions to gains and losses were more intense, in both directions, had significantly worse trading performance.
Common physical signals traders report:
- Faster heart rate and shallow breathing with nothing happening on the tape.
- A clenched jaw, tight shoulders or a tight chest after a stop-out.
- Clicking faster and skipping confirmation.
- Heat in the face, restlessness, or the urge to stand and pace.
- Fatigue that makes every decision feel heavier than it should.
None of these is a diagnosis. They are cues to run your pre-planned response before your next order, not after it.
Revenge Trading After a Loss
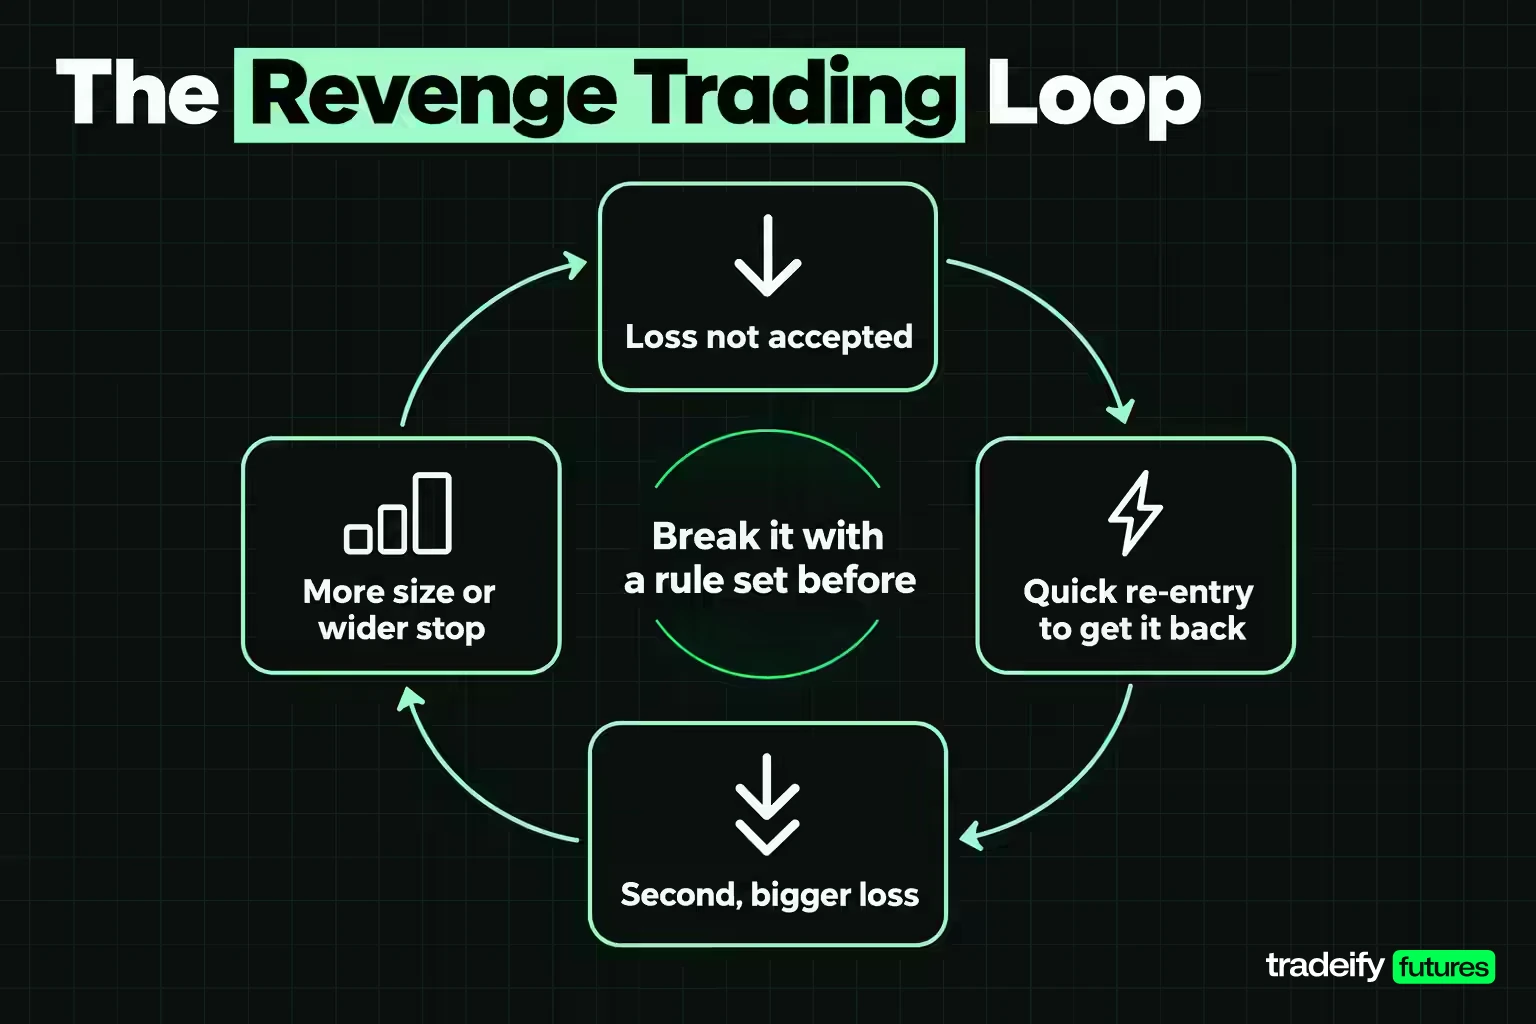
Revenge trading is the most common way tilt turns into money lost. It is an attempt to recover a loss quickly through an extra trade, extra size or both, and it rarely announces itself. It feels like seeing an obvious opportunity.
Professional traders do it too. Coval and Shumway (2005) studied 426 local traders in the CBOT Treasury bond futures pit. A trader with a losing morning had a 31.2% chance of taking above-average risk in the afternoon, against 27.0% after a profitable morning, making them about 15.5% more likely to raise risk after losing.
The pattern usually escalates in steps:
- A loss you accept on paper but not emotionally.
- A quick re-entry, often in the same direction, to "get it back."
- A second loss, now with a bigger number to recover.
- More size or a wider stop, because the recovery target grew.
- A loss large enough to change the week, not just the day.
The fix isn't willpower in step 2. You won't have much of it there. It is a rule decided before step 1 that makes step 2 impossible or small: a cooldown, a session loss cap, or a size that cannot go up during the session.
Related lesson: What a revenge trade costs and a post-loss protocol
Trading Tilt Tested on 20 Years of E-mini Futures
Most tilt advice assumes the trade after a loss is worse. That can be tested. This section is this guide's own illustrative study, calculated on Yahoo Finance daily E-mini S&P 500 futures data. It is not a strategy recommendation.
How the E-mini Tilt Study Was Built
The data is the continuous front-month E-mini S&P 500 future on daily bars, 5,067 completed sessions from 18 September 2006 to 4 November 2026. The rule:
- Signal: a close above the highest high of the prior 20 sessions.
- Entry: long at the next session's open, one unit.
- Stop at 1.0 times the 14-session average true range (Wilder), target at 2.0 times it.
- Exit at the 20th session if neither level is hit; a gap through the stop fills at the open.
- Cost: 0.5 index points per round turn.
The rule produced 592 signals, a 40.20% win rate and an average of 0.13R per trade (77.02R in total). The average win was 1.83R and the average loss -1.01R. A bootstrap interval put the average between 0.02R and 0.25R, so the edge is small and real, which makes it a fair test. "R" is one unit of planned risk, the distance from entry to stop.
Does the Trade After a Loss Do Worse
A trader only knows a trade lost once it has closed. So in this guide's E-mini calculation, each trade's "last result" is the most recent trade that had already closed before the entry.
| Tilt state before the entry | Trades | Average result | Win rate |
|---|---|---|---|
| All trades | 592 | 0.13R | 40.20% |
| Last closed trade was a loss | 377 | +0.23R | 44.30% |
| Last two closed trades were losses | 325 | +0.18R | 42.46% |
| Last closed trade was a win | 214 | -0.05R | 33.18% |
| Last closed trade won 1.5R or more | 183 | -0.07R | 32.24% |
On this rule, the trade after a loss did not do worse. It did slightly better than average, and the trade after a big win did slightly worse. Small samples move numbers around, so don't read this as "losses predict wins." Read it as: the next signal after a loss was a normal signal. The market was not punishing you for having lost.
That moves the problem to where it belongs: you, not the market. If the next trade is fine as written, any damage after a loss comes from what a tilted trader changes about it: size, stop, timing or how many positions they pile on.
Taking the rule one position at a time, 231 trades, told the same story. After a loss: 140 trades at +0.13R. After a win: 90 trades at +0.05R. After two losses: 82 trades at +0.03R. Nothing in those numbers says "stop trading because you lost."
Why Stacked Positions Make Tilt Look Like Fate
Measure it a slightly different way and you get a much darker story. The reason is worth knowing, because traders fool themselves the same way.
In this guide's E-mini calculation, if you label each trade by the result of the trade entered just before it, whether or not that one had closed, the "after a loss" group shows 353 trades averaging -0.41R with a 21.53% win rate. Within it, 197 trades entered while that earlier losing trade was still open averaged -0.86R with a 5.58% win rate.
Those numbers are not about tilt. They use information the trader could not have had at the entry, and they mostly measure one thing: overlapping trades on the same move win and lose together. When every signal was taken, up to 8 positions were open at once, and 429 of 592 trades were entered while another was still running. If the first one stops out, the ones entered on the same move usually do too.
That is the real lesson about stacking. Adding a second and third position on the same idea is not three trades. It is one bet at three times the size, and when it goes wrong, it feels like the market singled you out.
What Tilted Behaviours Cost in Drawdown
To put a price on tilt, the 20-year E-mini breakout rule (20-session high breakout, 1 ATR stop, 2 ATR target) was run one position at a time with 1% of running equity risked per R. Then it was altered the way a tilted trader alters a plan.
| Behaviour after losses | Total return | Maximum drawdown |
|---|---|---|
| Follow the rule as written | +21.78% | 16.73% |
| Double size after two straight losses | +22.45% | 26.29% |
| Widen the stop to 2 ATR on the trade after a loss | +36.33% | 15.30% |
| Halve size after two straight losses | +20.76% | 11.61% |
| Skip one signal after two straight losses | +15.71% | 12.02% |
| Skip one signal after three straight losses | +32.67% | 9.44% |
Doubling after two losses changed the ending return by less than a point but deepened the worst drawdown from 16.73% to 26.29%. It doubled 82 trades. That is the trade tilt offers: almost the same money, with a much deeper hole along the way. In fixed dollars at $250 per R, the worst drawdown went from $4,509 to $7,425.
Stacking makes it worse. Taking every signal at 1% each returned +98.00% with a 20.90% maximum drawdown. Add doubling after two known losses and the return rose to +203.30%, but the maximum drawdown hit 36.41%, and peak open risk went from 8 units to 14. Very few accounts, funded or personal, survive a 36.41% drawdown long enough to collect that return. On paper the aggressive version wins. In practice it usually ends first.
Related lesson: Why the size of your worst drawdown matters more than the ending return
The Doubling Ladder Against a Loss Limit
Here is the same idea in dollars. Take an illustrative account with a $2,500 loss limit and $250 risk per trade, and count the cumulative loss after each straight loss:
| Straight losses | Flat $250 per trade | Double after two losses | Double every loss |
|---|---|---|---|
| 1 | $250 | $250 | $250 |
| 2 | $500 | $500 | $750 |
| 3 | $750 | $1,000 | $1,750 |
| 4 | $1,000 | $1,500 | $3,750 |
| 5 | $1,250 | $2,000 | $7,750 |
| 6 | $1,500 | $2,500 | $15,750 |
Flat risk reaches the $2,500 limit after 10 straight losses. Doubling after two reaches it after 6, and doubling every loss blows through it on the fourth. The longest one-position losing run in the study was 9 trades. Flat risk survives that run; both doubling versions do not.
Widening a Stop After a Loss
Widening the stop on the trade after a loss is the one tilted behaviour that earned more in this guide's 20-year E-mini breakout test, +36.33% against +21.78% for the rule as written, because wider stops let more breakouts breathe. That does not make it a tilt fix.
Look at what it did to risk. Across 140 widened trades, the worst loss was -2.28R against -1.08R as written, and the average losing trade cost -1.84R. The trader was risking close to twice the planned amount on every one of those trades without sizing down for it. If a wider stop is better for your method, that is a rule change you test and size in advance. Moving a stop mid-tilt is an untested strategy with double the risk.
Tilt Circuit Breakers That End a Bad Session
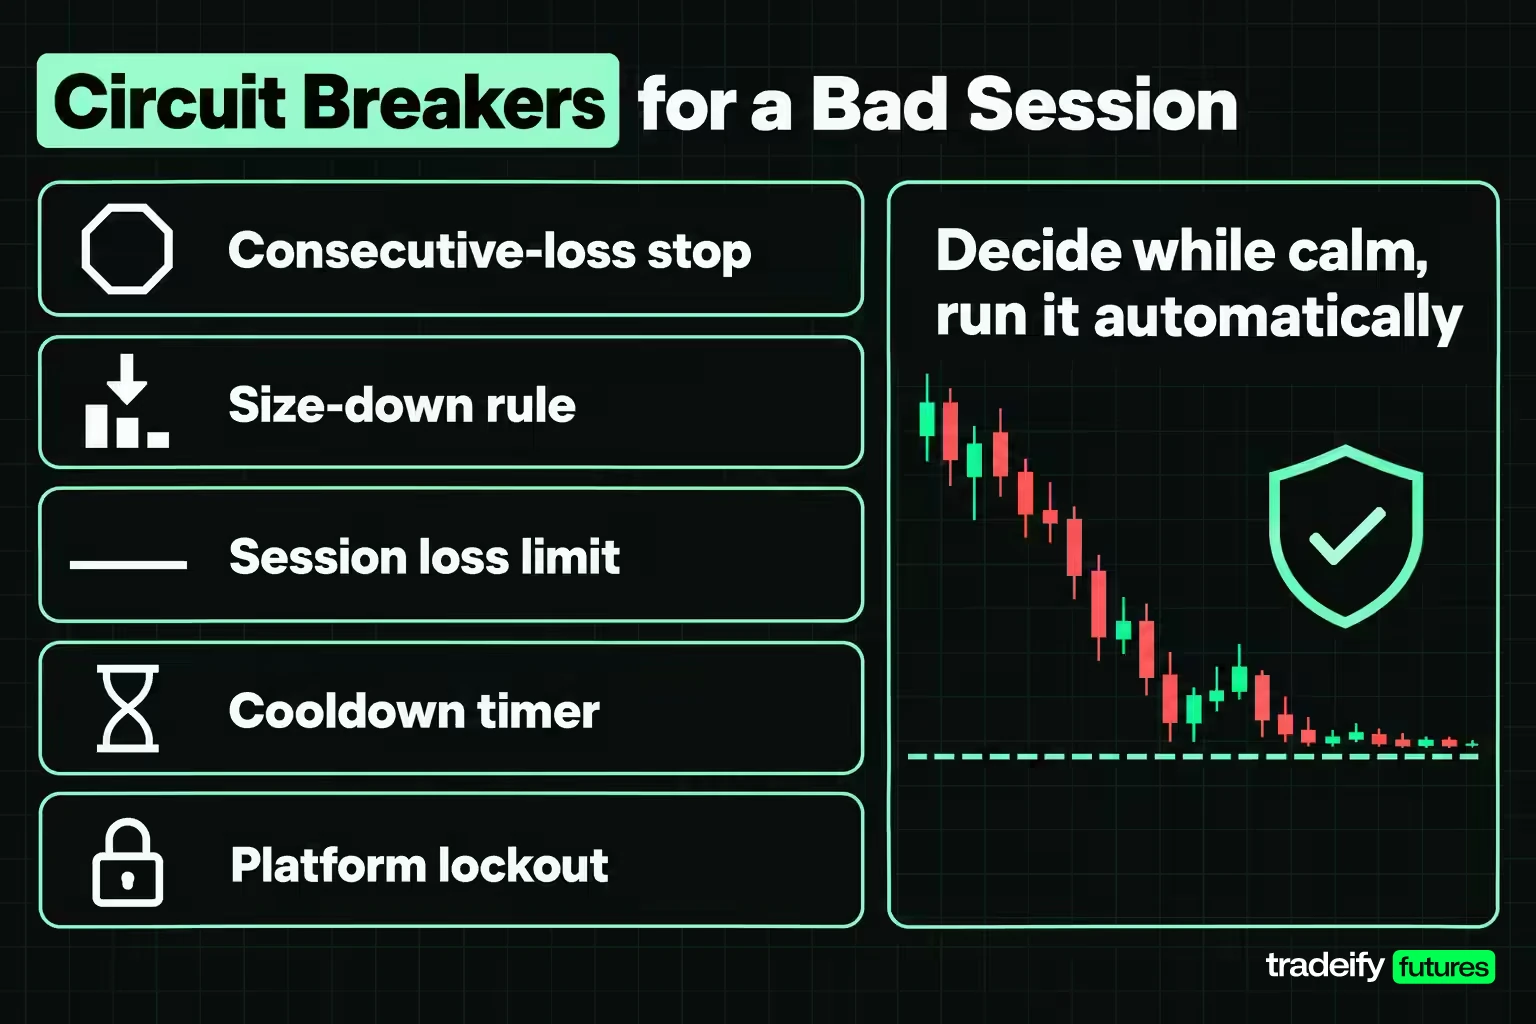
A circuit breaker is a decision you make while calm that runs automatically when you're not. The best ones are mechanical, so there is nothing to negotiate with in the moment.
- Consecutive-loss stop. After a set number of straight losses, you stop or skip the next setup. In the 20-year E-mini breakout study, skipping one signal after three straight losses cut the worst drawdown from 16.73% to 9.44% and returned +32.67%. It skipped 34 trades that averaged -0.24R. In fixed dollars at $250 per R, the worst drawdown fell from $4,509 to $2,430.
- Size-down rule. Halve size after two straight losses until a win. It cut the maximum drawdown to 11.61% for nearly the same return (+20.76%).
- Session loss limit. A dollar or R loss for the day that ends the session. It caps the bad day without needing to diagnose your mood.
- Aggregate open-risk cap. A limit on total risk across all open positions, which stops stacking cold. Per-trade limits alone miss it.
- Cooldown timer. A fixed pause after any full 1R loss, long enough to get up from the screen.
- Platform lockouts. Most platforms let you lock yourself out for a set period or the rest of the session. A lockout removes the order button, not just the intention.
Limits of the Circuit Breaker Results
Be honest about the limits of these circuit breaker numbers from the E-mini study. They come from one breakout rule on one market, and they are fitted on the same data they describe. Skipping after two losses cut drawdown to 12.02% but also cut the return to +15.71%. The consistent result is narrower: every breaker that reduced exposure after losses reduced the depth of the worst drawdown.
Related lesson: How to set daily and weekly loss limits
Avoiding Trading Tilt Before the Session Starts
Prevention works best before the first order. These routines lower the odds that a normal loss becomes a tilted afternoon:
- Know your system's bad runs. Tilt often starts with surprise: "I didn't know this many could lose in a row." On the 20-year E-mini breakout rule, traded one position at a time, the longest losing run was 9 trades. Shuffling the same results 10,000 times gave a median longest run of 9 and a 95th percentile of 14, and 67.35% of shuffles had a run of 9 or longer. A run that long is normal for a rule that wins 40.20% of the time.
- Check your state before you trade. Rate sleep, stress and focus on a 1 to 5 scale. On a low day, trade smaller or not at all. Fatigue makes everything in this guide worse.
- Write if-then plans. "If I take two full losses, then I stand up for 15 minutes." "If I'm green by my target, then size drops by half." A plan written in advance is much easier to follow than one invented mid-session.
- Size so a bad run is survivable. If your normal risk would put your account in danger within your usual worst run, the size is the tilt risk, not your emotions.
- Journal in R with tags. Record each trade's result in R and tag anything outside the plan: re-entry, size change, moved stop. Patterns show up within weeks.
- Pre-set brackets. Enter stops and targets with the order so there's no live decision to protect.
That E-mini rule had 58 losing runs; 20 were three or more losses long and 5 were six or more. If you know those numbers for your own method, a losing run becomes something you expected rather than something that happened to you.
Related lesson: Recording trades in R so tilt patterns show up
How Long Tilt Lasts and How to Recover
A tilt episode can last a few minutes or a whole session, and the after-effects can last much longer. The emotion fades in minutes if you step away. The damage depends on what you did during it, and a single tilted session can create a drawdown that takes weeks of normal trading to repair.
The losing run that triggers tilt is usually shorter than it feels. On the 20-year E-mini breakout rule, one position at a time, the median from the first loss of a run to the next win was 3 trades (mean 3.39). The longest run, 9 trades from 8 October 2007 to 3 April 2009, cost -9.17R. At 1% risk per trade, that is a drawdown you can trade through, provided size stays the same.
A recovery sequence that works:
- Stop the bleeding. Flatten, cancel working orders, close the platform or use a lockout.
- Get physical distance. Walk, drink water, breathe slowly. Lowering your arousal comes before any analysis.
- Score the session in R. Separate planned losses from tilted ones. A loss that followed the rule is not a mistake.
- Name the trigger. Was it a loss, a big win, an unfair stop or fatigue? Write it down.
- Return smaller. Come back at reduced size for the next session or two, then step back up after you follow your rules, not after you make money.
Related lesson: What to do when a run of losses has already dug a hole
Tilt Prevention Tips From Trader Forums
Trader forums are full of tilt advice. A few patterns come up again and again:
- Watch the body, not just the P&L. One r/Daytrading post on fixing tilt described logging physical cues (a clenched jaw, shallow breathing, a rising heart rate, clicking faster) next to each trade, then pairing each cue with a pre-planned action like standing up and walking away. That matches the research on physical arousal.
- Look after the basics. In a thread on avoiding burnout and tilt, the most repeated answers were sleep, food, exercise and hydration, plus focusing on the process instead of a daily dollar goal.
- Force yourself to walk away. Several traders describe physically leaving the desk as the only thing that works once a session turns.
- Know your system's worst days. Systematic trader Dave Mabe argues that stepping away or halving size are band-aids if the deeper problem is not knowing how bad your system's normal bad days get.
- Admit the pattern. One Elite Trader thread opens with a trader describing what many recognise: a few early losses, doubt, deviation from a system they trust, then much bigger losses.
The E-mini measurements in this guide back the structural advice most: fixed size, loss-count stops and limits on total exposure. Breathing and walking away work best as the way you carry out those rules, not a replacement for them.
Tilt in Discretionary Versus Automated Trading
Tilt looks different depending on how you trade.
Discretionary traders tilt inside the decision itself. The setup filter loosens, the stop moves and size creeps, often without one obvious rule break. Their defence is a written checklist, fixed size and tags that make drift visible afterwards. Lo, Repin and Steenbarger found no specific "trader personality" in their sample, which suggests trading habits can be learned rather than inborn.
Automated or system traders tilt by overriding the system. They switch it off after a losing run, skip signals that "look wrong," or double size to get back to the equity peak. The system keeps working as designed while the trader changes the rules around it. Their defence is deciding in advance when an override is allowed, writing it down, and judging the system on its tested range of bad runs, not on the last month.
Both groups share one weak point: sizing decisions made in the middle of a losing run. In 20 years of E-mini breakout data, that is where tilt's measured cost showed up, in deeper drawdowns rather than worse next trades.
Trading Tilt FAQ
How do you avoid tilt in trading?
Set mechanical limits before the session: fixed size, a consecutive-loss stop, a session loss limit and a cap on total open risk. Add a cooldown after any full loss and use a platform lockout when you hit a limit. Rules decided while calm do the work you can't do while upset.
How do you deal with emotions when trading?
Notice the physical signs early, such as a faster heart rate, a clenched jaw or clicking faster, and pair each one with a set action like stepping away for 15 minutes. Studies of traders link more intense emotional reactions to worse results, so the goal is lower intensity, not no emotion. Journaling your state next to each trade shows your own patterns.
Is it true that 97% of day traders lose money?
Yes, in one well-known study of a specific group, though not as a rule for every trader. Chague, De-Losso and Giovannetti studied Brazilian equity index futures day traders, and of the 1,551 who kept going for more than 300 days, 97% lost money and only 1.1% earned more than the Brazilian minimum wage. It is strong evidence that day trading is hard, but it describes one market and period, not every trader.
What is the 3-5-7 rule in trading?
The 3-5-7 rule caps risk at 3% per trade and 5% across all open positions, and aims for winners at least 7% larger than losers. It is an informal risk heuristic, not an exchange or regulatory rule, and versions differ. Its 5% total cap works as a guard against stacking, which is one of the costliest tilt behaviours.
How do you earn $1,000 per day in trading?
There's no reliable way to guarantee it, and a daily dollar target is a common tilt trigger. On one E-mini S&P 500 contract, $1,000 is a 20-point move before costs, which some days never offer. Trading toward a fixed number pushes traders to force entries and add size, so focus on following a tested process and let results vary.
How long does trading tilt last?
The emotional spike can fade within minutes if you step away, but tilted decisions can extend it for a whole session. The financial effect can last weeks if size or stops changed during it. A forced break, a smaller next session and a written review keep a short episode short.
A Three-Rule Anti-Tilt Plan for Your Next Session
Before your next session, write down three rules and put them where you can see them while you trade:
- Your consecutive-loss stop: the number of straight losses after which you skip or stop.
- Your maximum total open risk across every position, not just per trade.
- What you do in the first 15 minutes after any full loss.
Then check them against your last 20 trades. If any trade broke one of these rules, tag it, and compare the tagged trades' average R with the rest. That gap is what tilt costs you.
On our accounts, two tools turn that list into something you can't argue with mid-session. Tradovate's Manual Lockout pauses trading for 15 minutes, 30 minutes, 1 hour, the end of the session or a custom duration up to 24 hours. It flattens open positions, cancels working orders and blocks new trades on every platform, across all accounts tied to your user ID. On Rithmic accounts, Tradesea's personal lockouts do the same job with a countdown timer. Both are your own limits and sit alongside our account rules, not in place of them.
This article is educational and is not investment advice. Trading futures and other leveraged products involves substantial risk, and losses can exceed what you expect, especially when size increases after losses. The study here uses historical data and a fixed hypothetical rule; past results do not predict future performance. Evaluation and funded accounts at prop firms are simulated trading accounts. Make decisions about your own trading based on your own circumstances.


