



TL;DR: Harmonic patterns are five-point XABCD price structures where each leg has to land on a set Fibonacci ratio. The pattern tells you where a reversal may start, not whether it will. The reversal zone is a band of prices, and where you enter inside it changes reward-to-risk more than which pattern you picked. Published turn rates near 90% are not win rates, so price the stop before you trust the shape.
Harmonic patterns promise something most chart patterns do not: a reversal level you can calculate before price gets there. That is the appeal, and it is also the trap. A level you can calculate still has to be traded. The hard decisions (which swings count, how loose the ratios can be, where inside the zone you enter, where the stop goes) are the ones most explanations skip, and they are where the money is won or lost.
This guide covers the definitions and the named patterns, then works one illustrative E-mini S&P 500 Gartley all the way through to contracts and dollars, so you can see where the method holds up and where it leans on judgment.
What Harmonic Patterns Are
A harmonic pattern is a rule about a sequence of five price swings. You label five turning points X, A, B, C and D, which create four legs (XA, AB, BC and CD), and then you check whether each leg sits at a prescribed Fibonacci ratio of an earlier leg.
Four measurements do most of the work:
- How far B retraced the XA leg.
- How far C retraced the AB leg.
- How far the CD leg extends relative to BC.
- Where D finishes relative to the whole XA leg.
If those numbers line up with a pattern's ratio set, the structure gets a name (Gartley, bat, butterfly, crab), and the area around D becomes the potential reversal zone, often shortened to PRZ.
Related lesson: Fibonacci retracements and extensions
How Harmonic Patterns Differ From Shape-Based Chart Patterns
A double bottom or a head and shoulders is a shape you recognise. A harmonic pattern is a set of numbers you check. That changes the workflow in two useful ways.
First, the geometry is measured rather than eyeballed, so two traders who agree on the five swing points will agree on the ratios. Second, the completion level is known before price arrives, so the entry, the invalidation level and the first target can be written down in advance instead of improvised in the moment.
The cost is that real charts rarely land exactly on a ratio. Every harmonic method has to decide how close is close enough, and that decision shapes the results more than most traders expect.
Where Harmonic Patterns Came From
Harmonic patterns started as a chart observation and became a ratio system decades later.
- 1935. H.M. Gartley described the structure now called the Gartley in his book Profits in the Stock Market. It is sometimes called the "Gartley 222" because it appears on page 222. According to Scott Carney's own pattern pages, the book did not assign specific Fibonacci retracements to it.
- 1998. Carney's book The Harmonic Trader assigned the ratios most traders now use for the Gartley (B at 0.618 of XA, D at 0.786 of XA) and set out the ratio alignment for the butterfly, whose general extension structure Carney credits to Bryce Gilmore.
- 2000 to 2001. Carney dates the bat pattern to 2001 and gives 2000 and 2001 in different places for the crab.
- 2011. Carney first released the shark in his Patterns into Profits course, describing it as a structure outside the usual M and W framework.
Carney coined the phrase Harmonic Trading, and his site states that the pattern names and terminology are registered trademarks and copyrights. That is one reason ratio tables vary from source to source. Other writers, chart platforms and researchers have published their own versions rather than copying his.
Harmonic Pattern Types and Their XABCD Ratios
Every named harmonic pattern uses the same skeleton. What changes is the ratio set, and in particular where point D finishes relative to point X. The table summarises the defining ratios as published on Carney's pattern pages, the reference most other sources build on.
| Pattern | Family | B point (share of XA) | D point completion | BC projection |
|---|---|---|---|---|
| Gartley | Retracement | 0.618 | 0.786 of XA, inside X | 1.27 or 1.618 |
| Bat | Retracement | Below 0.618, ideally 0.382 or 0.50 | 0.886 of XA, inside X | 1.618 to 2.618 |
| Butterfly | Extension | 0.786 | 1.27 of XA, beyond X | 1.618 to 2.618 |
| Crab | Extension | 0.382 to 0.618 | 1.618 of XA, beyond X | 2.618 to 3.618 |
| Deep crab | Extension | 0.886 | 1.618 of XA, beyond X | 2.24 to 3.618 |
| Shark | Separate structure | Not an M or W shape | 0.886 to 1.13 zone | Minimum 1.618 extension |
The AB=CD is the simpler four-point structure underneath most of these patterns. The CD leg roughly matches the AB leg, and its completion is one of the levels that builds the reversal zone.
Retracement Versus Extension Harmonic Patterns
Where point D completes relative to point X splits the harmonic family in two.
The Gartley and the bat complete inside the XA leg. Point D stays between A and X, so a close beyond X kills the pattern, and the stop has a natural home.
The butterfly and the crab complete beyond X. You are fading a move that has just made a new extreme, which is why Carney describes the crab as needing a very small stop loss. Small stops get hit more often, so the crab trades a better ratio for a lower hit rate. That is a tradeoff, not a free edge.
Which Harmonic Pattern Is the Most Powerful
There is no defensible "most powerful" pattern. Carney calls the bat probably the most accurate pattern in his set, and Thomas Bulkowski's tests rank the bullish bat first of five Fibonacci-based patterns for average rise. That bat ranking rests on 259 perfect trades, a small sample. A pattern that lands on a level the market has already respected is a stronger setup than any pattern name on its own.
Bullish and Bearish Harmonic Patterns
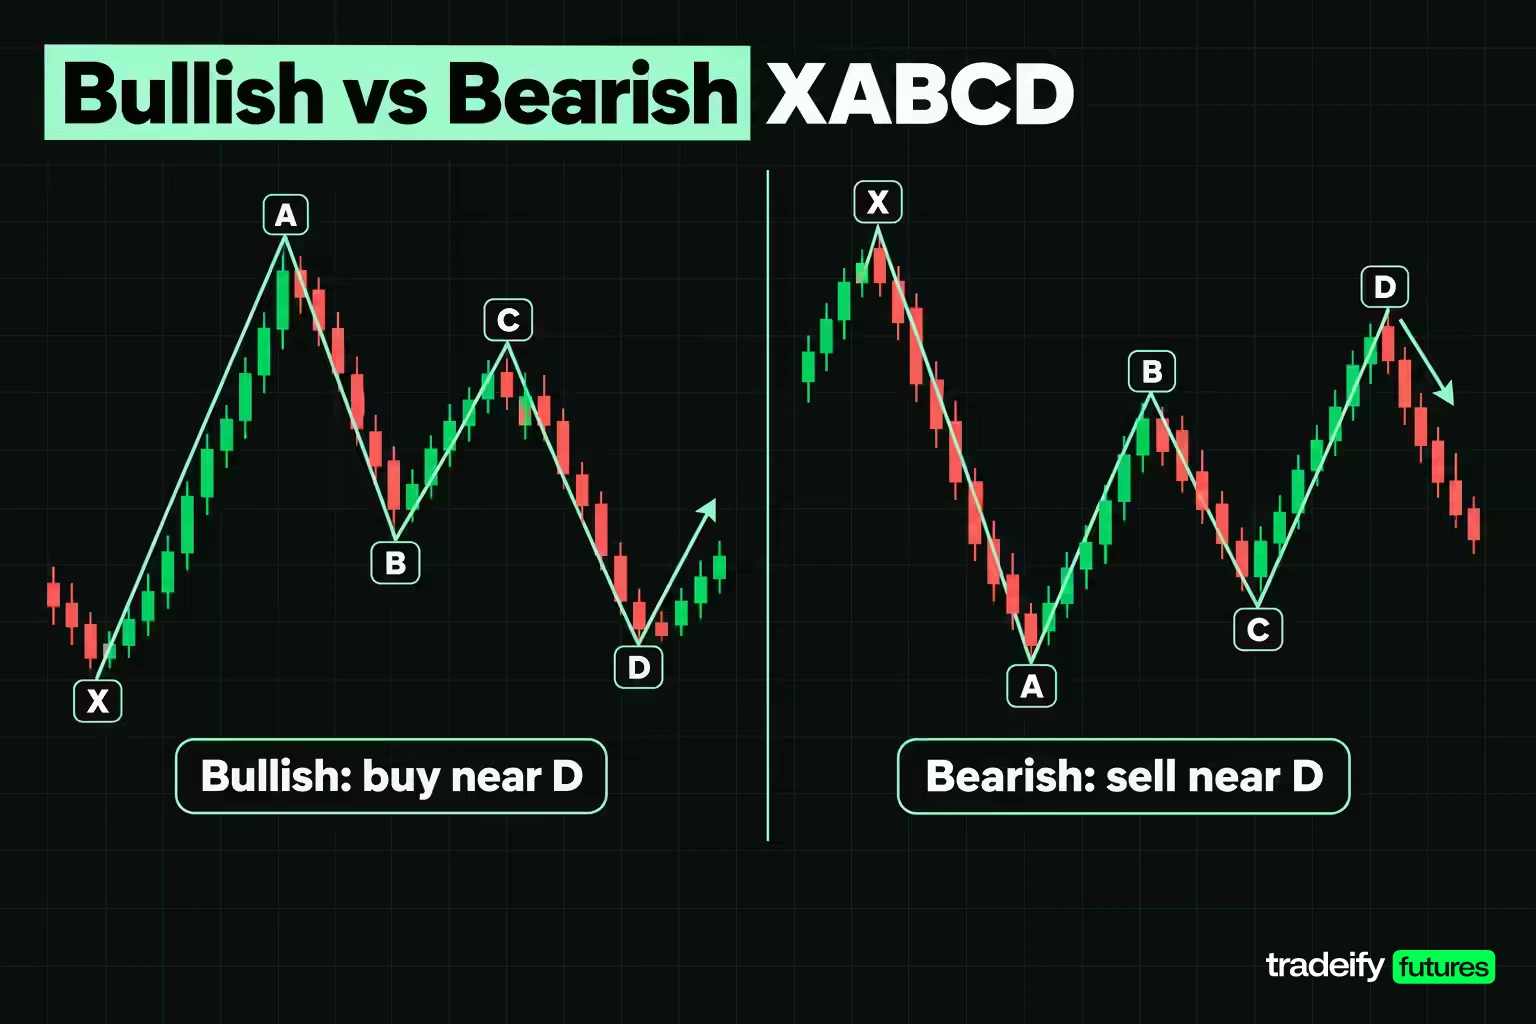
Every harmonic pattern comes in a bullish and a bearish version, and the difference is which way the final leg runs into point D.
- Bullish harmonic patterns finish with a decline into D. X, B and D are lows and A and C are highs, which traces an M shape. The trade idea is a buy in the reversal zone, with invalidation below the zone (or below X for a retracement pattern).
- Bearish harmonic patterns finish with a rally into D. X, B and D are highs and A and C are lows, which traces a W shape. The trade idea is a sell in the reversal zone, with invalidation above it.
The ratios are identical in both directions. What changes is the market context you are trading against. A bearish pattern in a strong uptrend asks you to short into strength, and a bullish one in a falling market asks you to buy weakness, so the bigger trend decides how much room the reversal has.
Bullish Versus Bearish Harmonic Pattern Statistics
Bulkowski's bullish samples post average rises of 36% to 44%, while the bearish samples post average declines of 13% to 14%. That gap does not mean bullish harmonic patterns are better. Several of those pages state their samples come from bull markets, where rises tend to run further than declines. Treat direction-level statistics as a description of the data period, not a rule for your market.
How to Find Harmonic Patterns on a Chart
Finding harmonic patterns by hand is a measuring job, not a hunting job. This sequence keeps the measuring honest:
- Pick the swing size first. Decide what counts as a swing (for example, a turn of at least a set number of points or bars) before you look for patterns. Bulkowski notes the peaks and valleys in a pattern need not be consecutive, which is exactly why you need a rule.
- Anchor XA. Find the largest clean leg on the timeframe you trade. Every other ratio is measured against it.
- Measure B. Divide AB by XA. This ratio decides which pattern family you are even considering (0.618 points to a Gartley, 0.382 or 0.50 to a bat, 0.786 to a butterfly).
- Measure C. Divide BC by AB and check it sits inside the pattern's range.
- Project D. Calculate the XA completion for the pattern, the BC projections and the AB=CD completion. Where they cluster is the reversal zone.
- Check the structure. A retracement pattern is void if price runs beyond X on the way to D. An extension pattern must go beyond X.
- Write the verdict down before price arrives. Pass, fail, and the tolerance you used.
The Tolerance Problem in Harmonic Pattern Rules
Harmonic ratios are published as exact numbers and applied as ranges, and most sources never say which range they use. Bulkowski is an exception. He applies a 3 percentage point window to the final ratio, so the bat's 88.6% becomes 85.6% to 91.6%, explicitly to keep his sample count high. On the AB=CD he uses a 1% window.
The window you choose decides how many harmonic patterns you see. Loosen it and patterns appear everywhere. Tighten it and almost none qualify. Neither is wrong, but a tolerance you change after looking at the chart is just a way of agreeing with yourself.
The Tick Floor on Harmonic Pattern Ratios
The instrument puts a floor under how tight a tolerance can be. On E-mini S&P 500 futures the minimum tick is 0.25 index points. On a 180-point XA leg, one tick is 0.139 percentage points of the leg.
That means a test tighter than about 0.14 percentage points is not stricter, it is impossible, because a swing point cannot sit between ticks. The shorter the XA leg, the bigger one tick becomes as a share of it, which is why very small intraday harmonic patterns carry more ratio noise than larger ones.
The Potential Reversal Zone and Other Harmonic Trading Zones
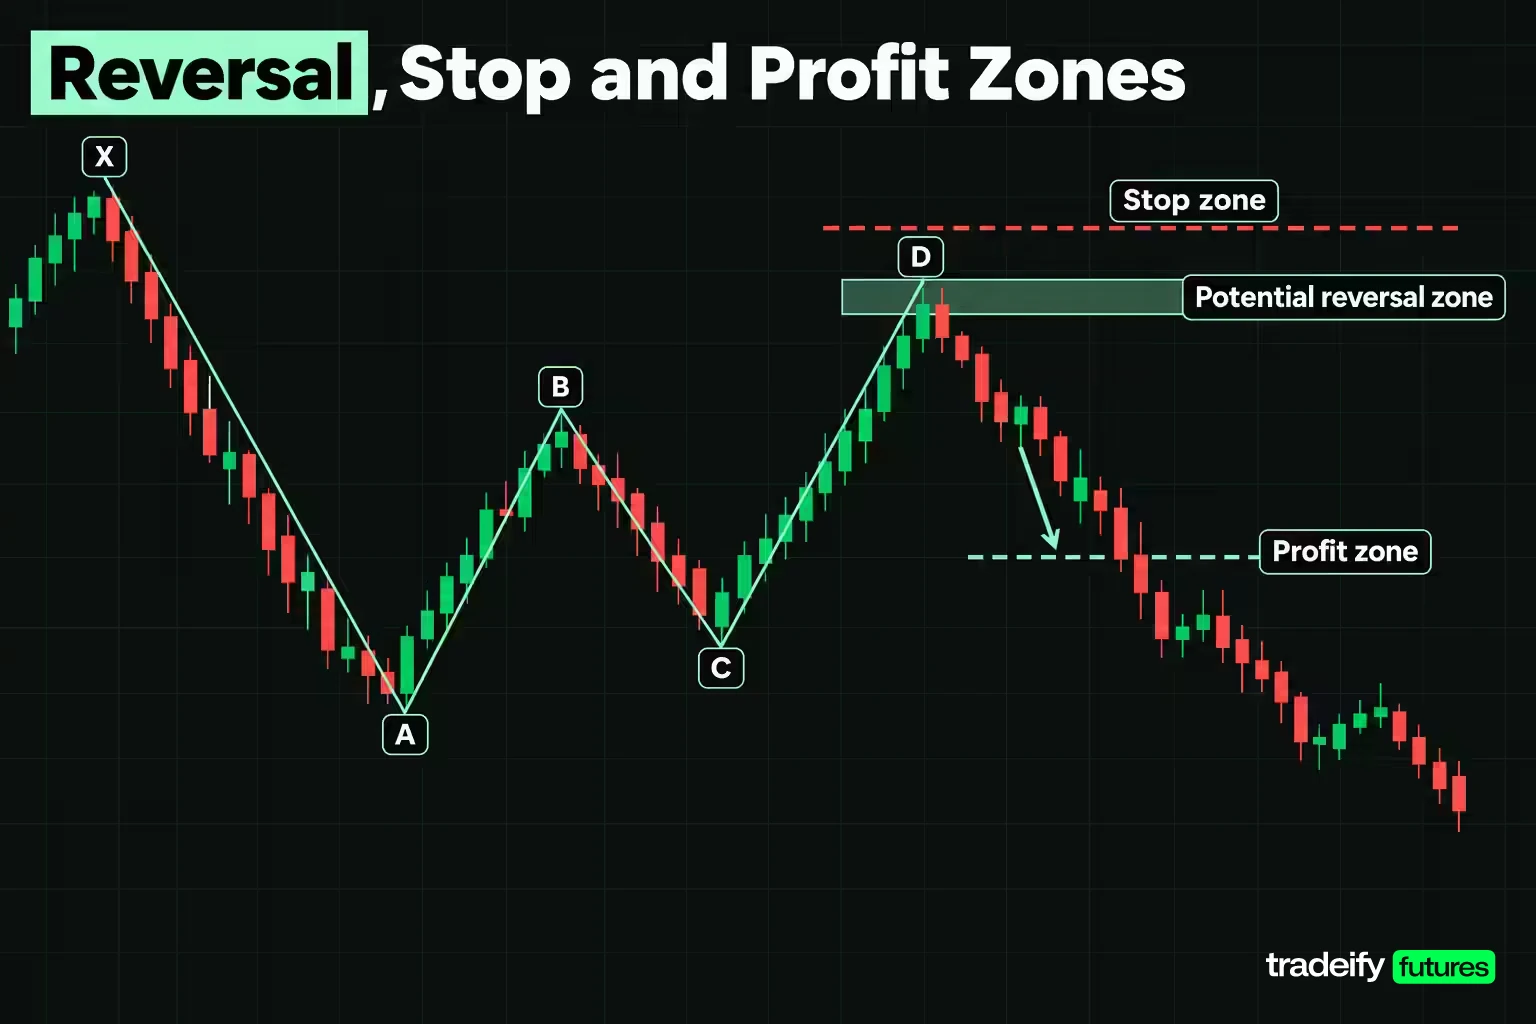
The potential reversal zone is the price band where a harmonic pattern's projections converge around point D. It is a band, not a price, and its width is the single most practical number in harmonic trading.
Most harmonic methods describe three zones:
- Potential reversal zone (PRZ). The cluster of the XA completion ratio, the BC projections and the AB=CD completion.
- Stop zone. Just beyond the far edge of the PRZ. For a retracement pattern, the outer limit is point X, because a move beyond X breaks the pattern.
- Profit zones. Retracements of the CD leg (commonly 0.382 and 0.618 of CD), then the swing points inside the pattern, such as point C.
How Wide a Harmonic Reversal Zone Really Is
Take an illustrative bearish Gartley on E-mini S&P 500 futures with X at 7180.00, A at 7000.00, B at 7111.25 and C at 7042.50. The projections for point D land here:
- 1.27 projection of BC: 7129.75 (rounded to the tick)
- 0.786 retracement of XA: 7141.50
- 1.618 projection of BC: 7153.75
- AB=CD completion: 7153.75
That PRZ runs from 7129.75 to 7153.75, a band of 24.00 points, or 13.333% of the XA leg. On the Micro E-mini S&P 500 at $5 per point, 24 points is $120 per contract. On the E-mini at $50 per point it is $1,200 per contract. "Wait for the reversal zone" is a $1,200 decision on one E-mini contract before you have chosen an entry.
A Worked Bearish Gartley Harmonic Pattern
This example uses round, illustrative E-mini S&P 500 prices. It is not a historical trade. Price falls from X to A, bounces to B, pulls back to C, then rallies into D.
| Point | Price | Leg measured | Leg size in points | Measured ratio | Gartley rule |
|---|---|---|---|---|---|
| X | 7180.00 | XA | 180.00 | n/a | Largest leg |
| A | 7000.00 | AB over XA | 111.25 | 61.806% | 61.8% |
| B | 7111.25 | BC over AB | 68.75 | 61.798% | 61.8% to 78.6% |
| C | 7042.50 | CD over BC | 99.00 | 144% | 127% or 161.8% |
| D | 7141.50 | AD over XA | 141.50 | 78.611% | 78.6% |
The two ratios this Gartley is named for are almost exact. B is 0.006 percentage points off 61.8%, and D is 0.011 off 78.6%. Point D also sits below X, so the structure is intact.
One Gartley Pattern Judged by Two Rulebooks
In the illustrative E-mini Gartley (X 7180.00, A 7000.00, B 7111.25, C 7042.50, D 7141.50), the CD leg is where the verdict depends on whose rules you use. At 144% of BC, it is 17 points above 127% and 17.8 below 161.8%.
- If you read the Gartley's BC projection as two point values (1.27 or 1.618, as Carney publishes it), the CD leg misses both by a wide margin.
- If you read it as a range, as Bulkowski does for testing, 144% passes. His own bearish Gartley example on a stock chart shows a CD/BC move of 142%, which he calls "about midway in the 127% to 161.8% range".
The BC leg has its own edge case. At 61.798% of AB it sits 0.002 percentage points under the 61.8% floor of the range, a gap far smaller than one tick.
Same five prices, two honest verdicts. That is why the tolerance and the reading of each rule need to be decided before you open the chart, not after.
Harmonic Pattern Entry, Stop and Target Rules
Harmonic trading strategies usually agree on the outline: enter in the PRZ, stop beyond it, target retracements of the CD leg. The details inside that outline decide whether the trade is worth taking. The numbers in this section use the same illustrative E-mini Gartley (PRZ 7129.75 to 7153.75, point D at 7141.50, point C at 7042.50).
Where You Enter Inside the Harmonic Reversal Zone
Fix the stop one tick above the PRZ at 7154.00 and fix the first target at the 0.382 retracement of the CD leg, 7103.75. Then move only the entry.
| Entry inside the zone | Entry price | Risk to the stop | Reward to target one | Reward-to-risk | Break-even win rate |
|---|---|---|---|---|---|
| Bottom of the zone | 7129.75 | 24.25 points | 26.00 points | 1.07 to 1 | 48.26% |
| Lower part of the zone | 7135.00 | 19.00 points | 31.25 points | 1.64 to 1 | 37.81% |
| Point D, 0.786 of XA | 7141.50 | 12.50 points | 37.75 points | 3.02 to 1 | 24.88% |
| Upper part of the zone | 7146.00 | 8.00 points | 42.25 points | 5.28 to 1 | 15.92% |
| Near the top of the zone | 7150.00 | 4.00 points | 46.25 points | 11.56 to 1 | 7.96% |
Every row is the same pattern in the same zone. Entering at the bottom of the zone needs a 48.26% hit rate just to break even. Entering at point D needs 24.88%. The reward-to-risk ratio falls 64.6% from point D to the bottom of the zone.
The higher rows look better on paper. Here is the catch. Price has to reach them. An entry near the top of the zone with a 4-point stop fills less often and gets stopped by ordinary noise more often. The real choice is between a better ratio and a higher chance of getting filled, and your journal should tell you which side of that tradeoff your rules sit on.
The other temptation shows up when price spikes through D without you. Selling wherever price happens to be is not the same trade at a worse price. It is a new trade with a new ratio, and it needs its own check against the stop.
Related lesson: Risk-reward ratio
Choosing the Stop on a Harmonic Pattern Trade
In the illustrative E-mini Gartley (reversal zone 7129.75 to 7153.75, point X at 7180.00, first target 7103.75), three stops are defensible from an entry at point D (7141.50), and each makes a different trade:
- One tick beyond the PRZ, 7154.00. Risk 12.50 points, 3.02 to 1 to the first target. The logic is that price trading through every projection means the zone failed.
- Midway between the PRZ and X, 7160.75. Risk 19.25 points, 1.96 to 1. Gives the zone room for a wick.
- At point X, 7180.00. Risk 38.50 points, 0.98 to 1. This is the structural stop (Bulkowski uses a close above X for the bearish Gartley), but at this entry it turns the trade into a coin flip on ratio alone.
A stop is an order, not a mental note. If the zone fails quickly, a resting stop order is what limits the loss, although in a fast market it can still fill worse than its price.
Harmonic Pattern Profit Targets
Common targets come from the CD leg and the pattern's own swing points:
- Target one: 0.382 of CD, 7103.75 in the illustrative example.
- Target two: 0.618 of CD, 7080.25.
- Point C: 7042.50, a 7.92 to 1 move against the 12.50-point stop.
Bulkowski's bearish Gartley tests found price dropped to point C 51% of the time and to point A 34% of the time after turning at D, on stock data. That is a reasonable argument for taking partial profits at the closer targets rather than holding the full position for C.
Sizing a Harmonic Pattern Trade in Futures Contracts
Turn the stop into dollars before you decide how many contracts to trade. Micro E-mini S&P 500 futures (MES) are $5 per point, and E-mini S&P 500 futures (ES) are $50 per point.
| Stop from 7141.50 | Points at risk | Risk per MES | Risk per ES |
|---|---|---|---|
| 7154.00, beyond the PRZ | 12.50 | $62.50 | $625 |
| 7160.75, midway to X | 19.25 | $96.25 | $962.50 |
| 7180.00, at point X | 38.50 | $192.50 | $1,925 |
On an illustrative $50,000 account risking 1% per trade ($500), the tight stop fits 8 MES contracts for exactly $500. The stop at X fits 2 MES for $385, because 3 would be $577.50. One ES at the tight stop risks $625, or 1.25% of the account, so it does not fit the budget. One ES at X risks $1,925 (3.85%). The pattern is the same in every case. The stop decides the size.
Related lesson: Position sizing futures contracts
How Accurate Are Harmonic Patterns
Harmonic pattern accuracy depends on what you count as a success. Thomas Bulkowski's per-pattern pages at ThePatternSite are the statistics most often quoted on harmonic patterns, and they come with definitions most quotes leave out.
| Pattern variant | Rank of 5 | Break-even failure rate | Average move | Turned at D | Sample |
|---|---|---|---|---|---|
| Bullish bat | 1 | 10% | 44% rise | 91% | 259 perfect trades |
| Bullish butterfly | 2 | 11% | 40% rise | 91% | Just over 700 |
| Bullish crab | 3 | 7% | 39% rise | 92% | Over 550 |
| Bullish Gartley | 5 | 14% | 36% rise | 90% | More than 1,900 |
| Bearish bat | 1 | 18% | 14% decline | 86% | More than 500 |
| Bearish crab | 1 | 20% | 14% decline | 87% | More than 1,350 |
| Bearish Gartley | 3 | 22% | 14% decline | 87% | More than 2,400 |
| Bearish butterfly | 4 | 27% | 13% drop | 86% | Over 1,000 |
The ranks compare each pattern only with the other Fibonacci-based patterns on the same site, and the data is from stocks.
Harmonic Pattern Turn Rate Versus Win Rate
In Bulkowski's harmonic pattern statistics, the "turned at D" figure is the share of patterns where price reversed at point D. It says nothing about how far price went, whether a trader got filled, or whether the move paid for the stop. His 91% turn rate for the bullish bat is not a 91% win rate.
Bulkowski defines the break-even failure rate as the share of patterns that fail to rise or decline by at least 5%, which he describes as failing to cover the cost of trading. Across his eight bat, butterfly, crab and Gartley variants it runs from 7% to 27%. His average moves are measured from the open after the breakout to the ultimate high or low, a best-case exit that no stop-and-target plan captures in full.
Bulkowski's bullish Gartley ranks last of five while still turning at D 90% of the time. Both are true. It turns as often as the others and then travels less.
Win Rates Quoted Without a Method
Some harmonic content quotes win rates or "completion rates" with no market, timeframe, sample or definition of success attached. Treat any such number as unverified until someone shows the rules and the data. The honest answer to "how accurate is harmonic trading" is that it depends on your swing rule, tolerance, entry, stop and target, and only a test of those exact rules on your market can answer it for you.
Related lesson: Backtesting a trading strategy
Harmonic Pattern Limitations and Failure Modes
The ratio arithmetic in harmonic patterns is the reliable part. The failures happen around it.
| Failure mode | What it looks like | The check that catches it |
|---|---|---|
| Contested swing labels | Two traders mark different highs as B and C | Fix a swing-size rule before looking, since peaks need not be consecutive |
| Rulebooks disagree | A CD/BC reading of 144% passes a range test and fails a point test | Pick one rulebook and one tolerance and write both down |
| Stop wider than the setup | A stop at X turns 3.02 to 1 into 0.98 to 1 | Price the stop before the entry and skip trades below your ratio floor |
| D lands in open space | The zone sits mid-range with no prior reaction level | Require a visible swing high, swing low or range edge inside the zone |
| Loose scanner tolerance | Software flags structures that fail a hand check | Find the scanner's tolerance and re-measure anything it flags |
| Turn rate read as win rate | A 90% turn statistic is treated as a 90% win rate | Track turn rate and break-even failure rate together |
Why Harmonic Rules Vary Between Sources
Different sources publish different harmonic ratios for the same pattern name. Carney's Gartley page defines the pattern by B at 0.618, D at 0.786 and a BC projection of 1.27 or 1.618, while TradingView's XABCD tool description and Bulkowski's tests add a BC retracement of 61.8% to 78.6% of AB and treat CD as a range. Bulkowski himself writes that the CD length "rarely holds true" and that you should be flexible. None of these is a mistake, but mixing rules from different sources lets you approve almost any structure.
When a Harmonic Reversal Is Really Just a Fibonacci Level
Harmonic ratios are Fibonacci retracement and extension levels. A reversal at D is sometimes just a retracement level doing what retracement levels often do, or a prior high doing what prior highs often do. If D lands on a level the market has already rejected, you are trading geometry plus structure. If it lands in open space, you are trading geometry alone, and that is a weaker trade.
Related lesson: Support and resistance
Harmonic Pattern Scanners and Drawing Tools
You can find harmonic patterns by hand with a Fibonacci retracement and extension tool, and doing the first few dozen by hand is the fastest way to learn what the ratios feel like. The arithmetic is four divisions.
Charting platforms make the drawing faster. TradingView, for example, has an XABCD pattern drawing tool that labels the five points and the four legs, plus separate Cypher, ABCD and three-drives pattern tools. A drawing tool measures what you place. It does not decide whether your swings are the right swings.
What to Check in a Harmonic Pattern Scanner
Automated scanners search many charts for harmonic patterns at once. That saves time and adds a new risk: the scanner's rules become your rules, whether or not you know them. Before trusting one, find out:
- Which ratio set it uses for each pattern name.
- What tolerance it applies to each ratio.
- How it defines a swing point, and whether it repaints (moves a point after the fact).
- Whether it shows completed patterns only, or also projects patterns still forming.
Re-measure a sample of its signals by hand. If its hits fail your own checks, it is generating structures your rules would reject.
A practical next step is to mark 20 completed harmonic patterns by hand on your own market, with your tolerance written down first, and record where each one reversed inside its zone. That small log will tell you more about your entry and stop rules than any published win rate.
Markets and Timeframes for Harmonic Patterns
Harmonic patterns are ratio-based, so they appear on any liquid market that trends and retraces: futures, stocks, forex and crypto. Liquid futures such as E-mini S&P 500, Nasdaq-100, crude oil and euro FX futures are common choices, because thin markets print gappy swings that are hard to label consistently.
Timeframe matters more than market. Daily and 4-hour harmonic patterns take days or weeks to complete and resolve. Intraday patterns complete within hours, but the legs are shorter, so each tick is a bigger share of the leg and the ratios get noisier. A practical rule is to trade harmonic patterns on the timeframe where your XA leg is large enough that one tick is a small fraction of a percentage point.
On our accounts, every position must be closed by 4:45 PM ET and nothing can be held overnight or over a weekend. That means a harmonic pattern that completes on a daily chart and needs several days to reach its targets is not a trade you can hold on a Tradeify account. The ones that fit are patterns that complete and resolve within a single session. WealthCharts, one of the platforms we support, includes Fibonacci retracement and extension drawing tools and a Chart Replay mode for practicing on historical data.
Harmonic Patterns vs Elliott Waves and Classic Chart Patterns
Harmonic patterns share ideas with other methods but answer a different question.
| Method | What it measures | Completion point | Main weakness |
|---|---|---|---|
| Harmonic patterns | Ratios between five swings | A calculated zone around D | Swing labelling and tolerance |
| Plain Fibonacci retracement | One pullback against one leg | Several candidate levels | No rule for which level holds |
| Elliott wave | A labelled wave count | Revised as the count develops | Counts can be relabelled after the fact |
| Double top or bottom | A repeated high or low | A neckline break | Confirmation comes later, after the move starts |
The practical difference from Elliott wave is that a harmonic pattern is fixed once the five points are set, while a wave count can be relabelled as price extends. Mixing the two invites retrofitting, where you keep relabelling until the count agrees with a position you already hold.
Related lesson: Elliott wave theory
Harmonic Patterns FAQ
How accurate is harmonic trading?
Harmonic trading is only as accurate as your exact entry, stop and target rules, because a pattern turning is not the same as a trade winning. Bulkowski's stock tests show harmonic patterns turning at D 86% to 92% of the time, but break-even failure rates of 7% to 27%. A turn is not a profitable trade, so only a test of your own entry, stop and target rules can answer it.
What is the most powerful pattern in trading?
No single pattern has earned that title. In Bulkowski's harmonic tests the bullish bat ranks first for average rise, but on just 259 trades. Any pattern is stronger when it completes at a level the market has already reacted to.
What is the most successful forex strategy?
No strategy is the most successful for every trader, market or period. Harmonic patterns can be applied to forex charts or currency futures like any other liquid market. A strategy is only worth trusting once its exact rules have been tested on data it was not built on.
How do you find a harmonic pattern?
Set a swing-size rule, anchor the largest clean leg as XA, then measure B, C and the D projections as ratios of earlier legs. Where the projections cluster is the reversal zone. Decide your tolerance before you measure, not after.
Are harmonic patterns better on higher timeframes?
Larger legs make the ratios cleaner, because one tick is a smaller share of the leg. Higher timeframes also take longer to complete. Pick the timeframe that matches how long you can hold a position.
Do harmonic patterns work in futures markets?
Yes, the ratio arithmetic works the same on futures as on stocks or forex. The published statistics come from stock data, so they do not carry over automatically. Futures add point values and tick sizes, which turn the zone width and the stop into dollars per contract.
Harmonic Patterns Trading Risk
This guide is educational and is not investment advice or a recommendation to trade any instrument. Futures are leveraged, losses can exceed what you expect, and a stop order does not guarantee your exit price in a fast market. Every price, account size and position size here is illustrative, not a real trade or a promise of any result. Published pattern statistics come from third-party stock studies and may not carry over to other markets. Simulated and funded account results are simulated and do not reflect live trading conditions. Test any rule on your own data before you risk money on it.


