



TL;DR: Maximum risk per trade is the most one trade can lose at its stop, and the right cap is one that survives your likely losing run. In a measured ES and NQ sample with a 60.86% loss rate, two separate 12-loss runs appeared. A 12-loss run costs 11.36% of the account at 1% risk and 45.96% at 5%. Solve the cap backwards from the drawdown you can accept, then size contracts from the stop.
Most traders pick a risk number the same way. Someone says 1%, or 2%, and it sounds sensible. The number only gets tested later, in the middle of a losing streak, when changing it feels urgent and is usually the wrong move.
This guide works the other way around. Start with the losing run your strategy will probably produce, price that run at different risk levels, then solve for a maximum risk per trade that keeps the account inside a drawdown you chose while you were calm.
What Maximum Risk per Trade Means
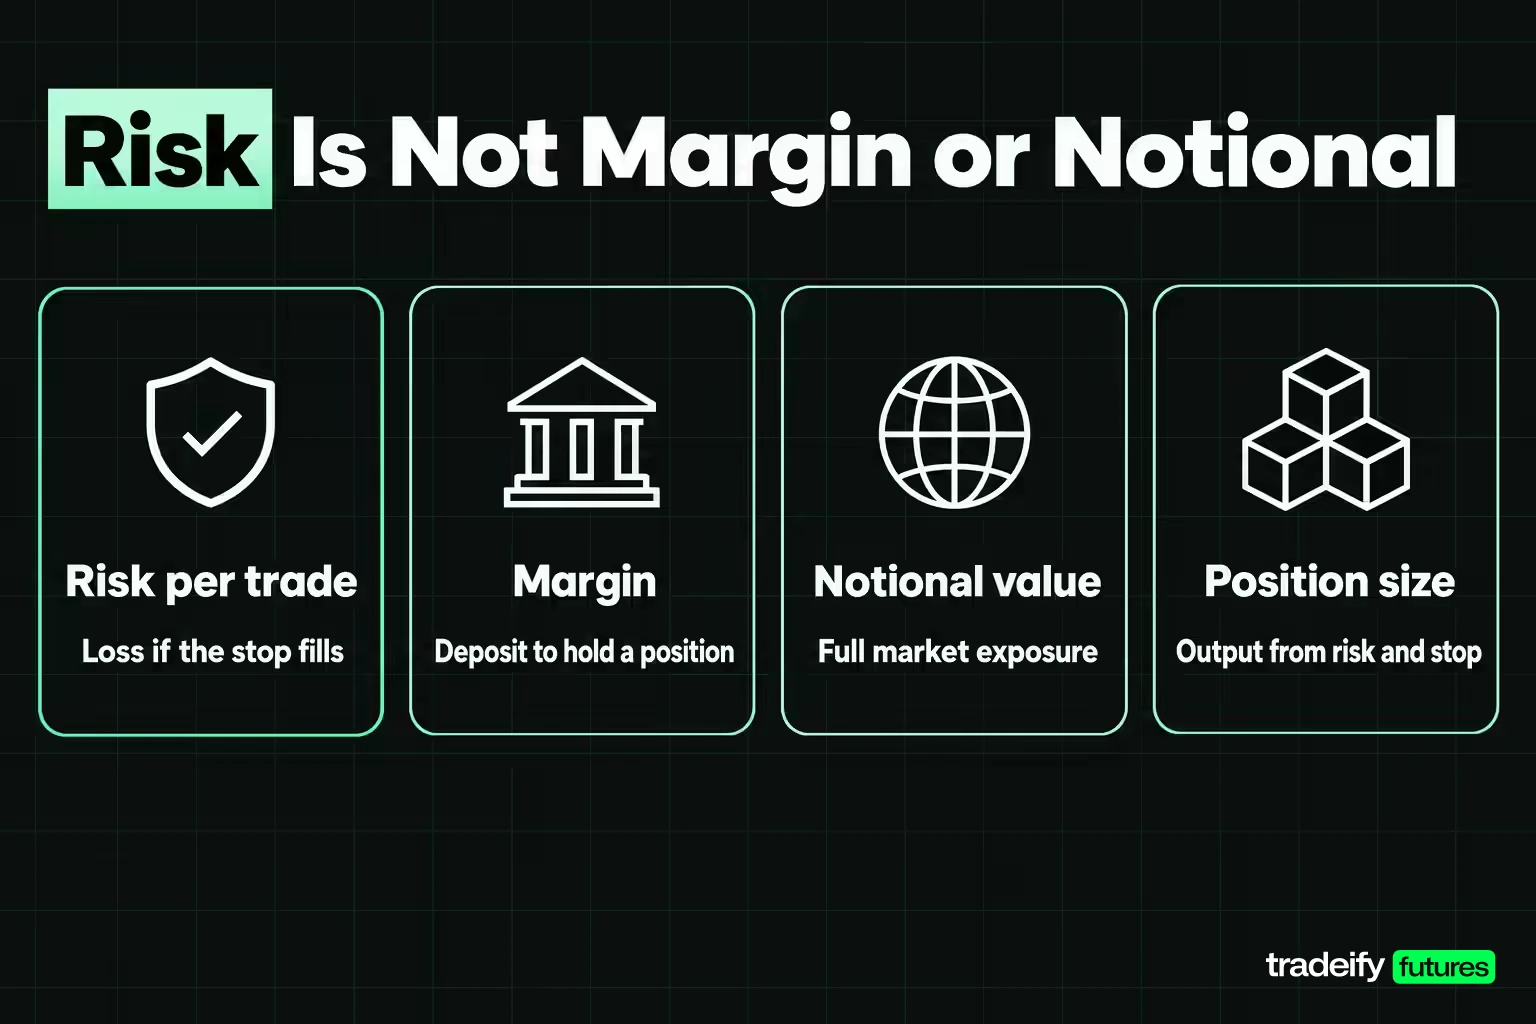
Maximum risk per trade is the dollar amount that leaves the account if a trade is wrong and the stop fills where it was placed. It is set before the order goes in, and it caps the loss on that single trade idea.
It is easy to confuse with three other numbers:
- Margin is the deposit a broker or exchange requires to hold a futures position. It is a performance bond, not a loss estimate, and it changes with exchange and broker settings.
- Notional value is the full market exposure. One E-mini S&P 500 (ES) contract is $50 times the index, so at an illustrative index level of 7,000 it controls $350,000 of exposure.
- Position size is the number of contracts, shares or lots. It is an output, worked out from the risk cap and the stop distance.
Here is where traders get caught. One ES contract with a 6.00 point stop risks $300, no matter how much margin it ties up or how large the notional value looks. A trader who sizes by margin or by "what the account can afford to hold" is measuring exposure, not risk. Leverage lets a small margin deposit control a large position, so a futures account can hold far more risk than a sensible cap allows. The cap is the number that stops that from happening.
Related lesson: Risk management for traders
Per-trade risk vs account-level risk limits
A maximum risk per trade sits underneath two broader limits. A daily loss limit caps how much the account can lose in one session, and a maximum drawdown caps how far the account can fall from its peak or starting balance. The per-trade cap is the smallest of these numbers and the one you apply most often, so it decides how many losing trades fit inside the bigger limits.
Common Risk Percentages and When Each Fits
Risk percentages are usually quoted as a share of current account equity: 0.5%, 1%, 2%, sometimes 5% or more. None of them is correct in the abstract. Each one is a statement about how many consecutive losses the account can take before it reaches a drawdown you would call broken.
The table below counts consecutive full losses needed to reach each drawdown, with risk recalculated on the shrinking balance after every loss.
| Risk per trade | Losses to reach a 10% drawdown | Losses to reach a 20% drawdown | Losses to halve the account | Drawdown after 12 straight losses |
|---|---|---|---|---|
| 0.5% | 22 | 45 | 139 | 5.84% |
| 1% | 11 | 23 | 69 | 11.36% |
| 2% | 6 | 12 | 35 | 21.53% |
| 5% | 3 | 5 | 14 | 45.96% |
| 10% | 1 | 3 | 7 | 71.76% |
Read the last column first, because that is the one that hurts. A run of 12 losses is not exotic for a strategy that loses more often than it wins: at a 60% loss rate over a few hundred trades, the typical longest losing run is about 11. At 0.5% that run is an annoyance. At 2% it is a fifth of the account. At 5% it is close to half.
How each level tends to fit:
- 0.5% or less. Suits strategies with low win rates, new strategies without much data, and accounts with tight drawdown rules. The cost is slower growth and, on small accounts, trouble fitting even one contract.
- 1%. The common default for a measured strategy with a moderate win rate. It survives an ordinary 12-loss run with an 11.36% drawdown.
- 2%. Workable for strategies with high win rates and verified short losing runs. A run of 12 costs more than a fifth of the account.
- 5% and 10%. Not risk management in any practical sense. At 10% a single loss takes a tenth of the account and 7 straight losses halve it.
Related lesson: Fixed-fractional position sizing
The 1% Risk per Trade Rule and What It Assumes
The 1% rule says no single trade should lose more than 1% of account equity. On a $50,000 account that is $500 per trade. If the next trade has a stop that would lose $300 per contract, the rule allows one contract, because two would risk $600.
The rule is popular for good reasons. It is simple, it scales with the account, and it turns a vague intention ("I'll be careful") into a number you can check before every order. It also compounds in your favor during a drawdown: each loss shrinks the balance, so the next 1% is a smaller dollar amount.
What the rule quietly assumes is that your losing runs are short enough for 1% to be safe. At 1%, it takes 11 straight losses to reach a 10% drawdown and 23 to reach 20%. Whether that is conservative or reckless depends entirely on the strategy's loss rate.
When the 1% rule is too loose or too tight
The 1% rule is too loose when the strategy wins less than about 40% of the time, when the account has a hard drawdown limit well below 20%, or when several positions open at once on the same idea. It can be too tight when a strategy has a long, verified record of high win rates and short losing runs, though raising the cap on a short sample is a common way to get hurt.
The honest answer is that 1% is a starting assumption. The rest of this guide shows how to replace the assumption with a number derived from your own losing streaks.
A Measured 12-Trade Losing Run in ES and NQ
To see what a real losing sequence looks like, consider an illustrative study on front-month E-mini S&P 500 (ES) and E-mini Nasdaq-100 (NQ) futures, run for the previous version of this guide on 5-minute bars from Yahoo Finance's continuous front-month series.
The method was deliberately plain:
- Sample. 50 complete regular sessions from July 8 to September 16, 2026, both contracts.
- Entries. Every hour from 10:00 AM to 3:00 PM New York time, one trade at the close of that 5-minute bar, in the direction the bar closed.
- Exits. Stop one entry-bar range away, target 1.5 times that range. The first level touched decided the trade. A bar touching both counted as a loss, and trades touching neither by the close were left unresolved.
On that Yahoo Finance data, this guide's study produced 592 entries, of which 580 resolved. 353 were losses, a loss rate of 60.86% and a win rate of 39.14%. The median stop was 6.00 points on ES and 37.25 points on NQ.
The entry has no edge, and that is deliberate. A 1.5-to-1 target needs a 40% win rate to break even before costs, and 39.14% falls just short, an expectancy of about -0.02R per trade. The study is not a strategy to trade. It is a realistic sequence of wins and losses for a common reward-to-risk shape.
Inside that sequence, the longest losing run was 12 trades, and it happened twice.
Is a 12-loss run unusual at a 60.86% loss rate
No. The exact probability distribution for the longest losing run, at a 60.86% loss rate over 580 independent trades, puts the median longest run at 11. The 12-loss runs in the data sit just above the middle of what chance alone produces.
| Longest losing run in 580 trades at a 60.86% loss rate | Run length |
|---|---|
| Median (50th percentile) | 11 |
| 75th percentile | 13 |
| 90th percentile | 15 |
| 95th percentile | 16 |
| 99th percentile | 20 |
The probability that a sequence this long contains a run of 13 or more losses is 29.77%. A run of 7 or more appears in 99.95% of sequences. So a 12-loss streak is not a sign that the strategy broke. It is what a 60% loss rate looks like over a few hundred trades.
That changes the question. A maximum risk per trade has to survive the losing run you will probably see, not the one you hope for. One rough stretch is a line in the sample, not a verdict on the strategy. For planning, the 95th percentile run (16 losses here) is a sensible stress case.
Related lesson: Risk of ruin
How Win Rate Changes the Losing Streaks to Plan For
Win rate and reward-to-risk ratio work as a pair. A strategy that targets 2R only needs to win 33.33% of the time to break even before costs, while a 1R target needs 50%. Lower win rates are fine when the winners are larger, but they come with longer losing streaks, and those streaks are what the risk cap has to absorb.
| Reward-to-risk ratio | Break-even win rate before costs |
|---|---|
| 1 to 1 | 50% |
| 1.5 to 1 | 40% |
| 2 to 1 | 33.33% |
| 3 to 1 | 25% |
The next table uses the same exact longest-run calculation for different win rates and sample sizes. Each cell gives the typical (median) longest losing run and the 95th percentile.
| Win rate | Over 100 trades | Over 250 trades | Over 500 trades |
|---|---|---|---|
| 30% | 10 typical, 17 at the 95th percentile | 13 typical, 20 at the 95th percentile | 15 typical, 22 at the 95th percentile |
| 40% | 7 typical, 12 at the 95th percentile | 9 typical, 14 at the 95th percentile | 11 typical, 16 at the 95th percentile |
| 50% | 6 typical, 9 at the 95th percentile | 7 typical, 11 at the 95th percentile | 8 typical, 12 at the 95th percentile |
| 60% | 4 typical, 7 at the 95th percentile | 5 typical, 8 at the 95th percentile | 6 typical, 9 at the 95th percentile |
Two lessons come out of this table. First, the more trades you take, the longer the worst streak gets, so a risk cap that felt safe over 100 trades can look thin after 500. Second, a trend-following style that wins 30% of the time should expect losing runs in the high teens or low twenties. At 2% per trade, a 20-loss run costs about a third of the account.
So win rate alone does not tell you how much to risk. It tells you how long the losing runs will be. The risk cap decides what those runs cost.
Related lesson: Win rate vs payoff ratio
What a 12-Loss Run Costs at 1% and 2% Risk
Take a $50,000 account and a run of 12 straight losses, the longest run in this guide's illustrative ES and NQ study, priced at the two caps traders most often use. Risk is a percentage of the equity still in the account, so the dollar risk shrinks a little with each loss.
| Loss number | Risk at 1% | Balance at 1% | Risk at 2% | Balance at 2% |
|---|---|---|---|---|
| 1 | $500.00 | $49,500.00 | $1,000.00 | $49,000.00 |
| 2 | $495.00 | $49,005.00 | $980.00 | $48,020.00 |
| 3 | $490.05 | $48,514.95 | $960.40 | $47,059.60 |
| 4 | $485.15 | $48,029.80 | $941.19 | $46,118.41 |
| 5 | $480.30 | $47,549.50 | $922.37 | $45,196.04 |
| 6 | $475.50 | $47,074.01 | $903.92 | $44,292.12 |
| 7 | $470.74 | $46,603.27 | $885.84 | $43,406.28 |
| 8 | $466.03 | $46,137.23 | $868.13 | $42,538.15 |
| 9 | $461.37 | $45,675.86 | $850.76 | $41,687.39 |
| 10 | $456.76 | $45,219.10 | $833.75 | $40,853.64 |
| 11 | $452.19 | $44,766.91 | $817.07 | $40,036.57 |
| 12 | $447.67 | $44,319.24 | $800.73 | $39,235.84 |
The 1% account ends the run at $44,319.24, an 11.36% drawdown. The 2% account ends at $39,235.84, a 21.53% drawdown. Commissions and slippage would add to both, and costs do not shrink with the account the way percentage risk does.
Drawdown recovery math after a losing run
Drawdowns are harder to climb out of than to fall into, because the recovery happens on a smaller balance.
| Drawdown | Gain needed to get back to the starting balance |
|---|---|
| 10% | 11.11% |
| 20% | 25% |
| 30% | 42.86% |
| 50% | 100% |
After the 12-loss run, the 1% account needs a gain of about 12.8% to recover. The 2% account needs about 27.4%. That second climb takes far longer, and it has to happen while the trader is still carrying the memory of 12 straight losses. This is where a higher risk cap does its real damage. Not in the drawdown itself, but in the pressure to win it back quickly.
Related lesson: Maximum drawdown
Solving for Your Maximum Risk per Trade From a Drawdown Limit
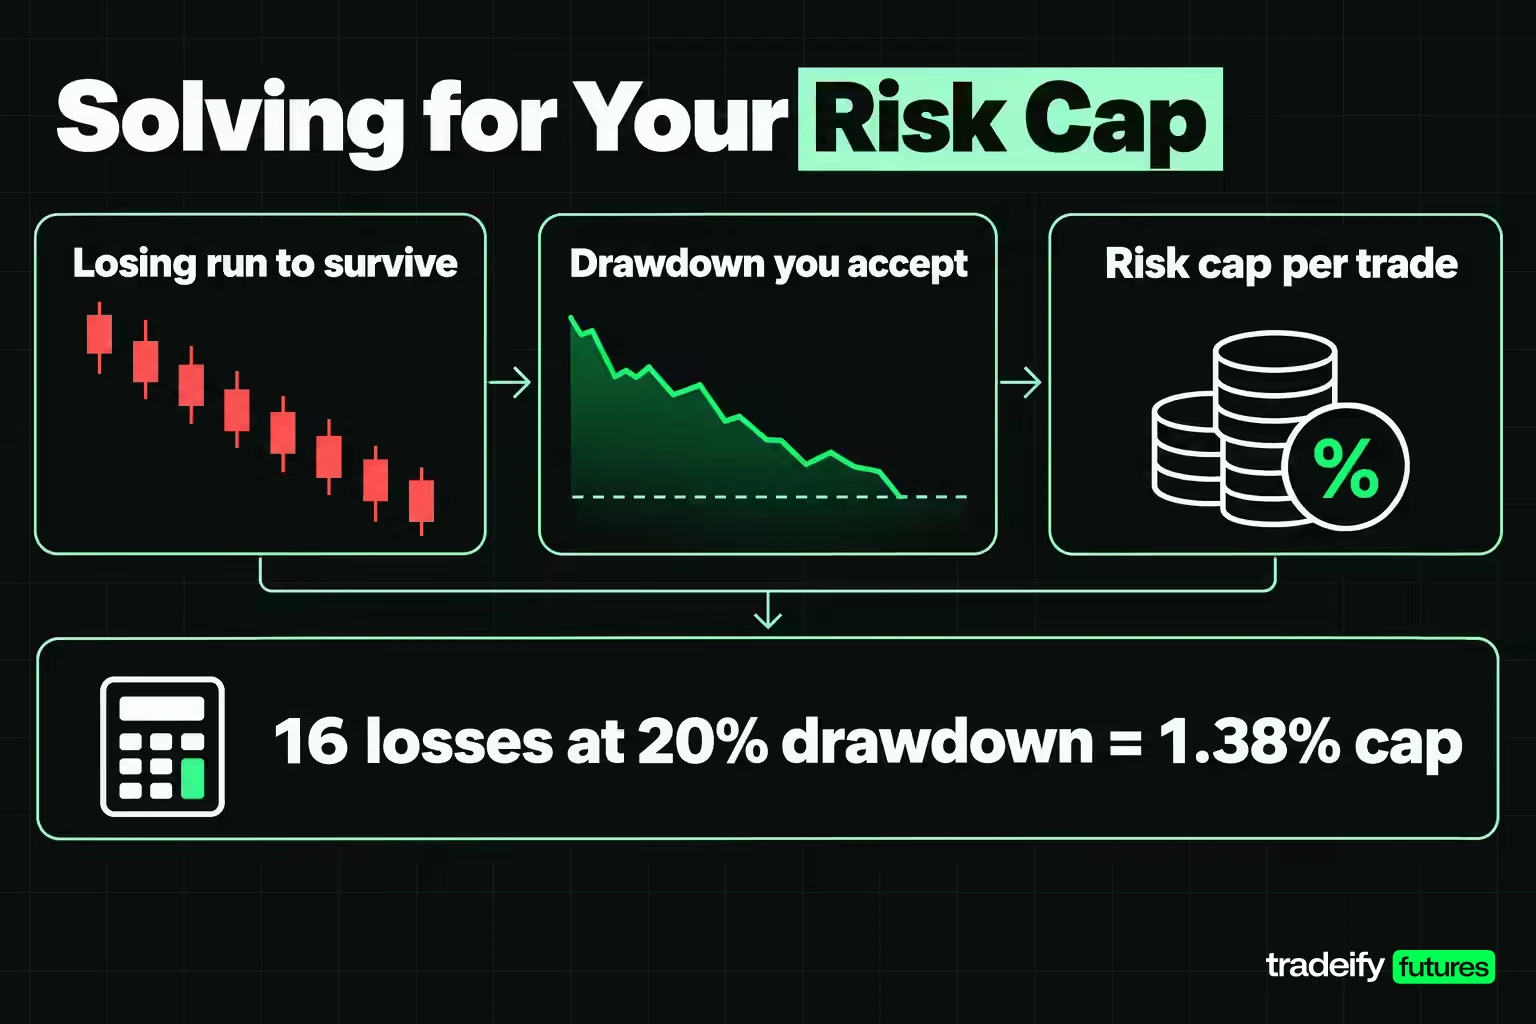
A defensible risk cap answers two questions you set in advance. How many consecutive losses should the account survive? And how much drawdown is that survival allowed to cost?
Because losses compound on a shrinking balance, the cap is not simply the drawdown divided by the losing run. A cap of c held through n losses leaves (1 - c) raised to the power n of the account. Set that equal to the balance you are willing to fall to and solve for c:
- Cap = 1 - (1 - drawdown tolerance) raised to the power (1 / n)
Solved for common inputs:
| Losing run to survive | Cap for a 10% drawdown | Cap for a 20% drawdown | Cap for a 30% drawdown |
|---|---|---|---|
| 11 losses | 0.95% | 2.01% | 3.19% |
| 12 losses | 0.87% | 1.84% | 2.93% |
| 16 losses | 0.66% | 1.38% | 2.2% |
| 20 losses | 0.53% | 1.11% | 1.77% |
In this guide's illustrative ES and NQ study (Yahoo Finance 5-minute bars, July 8 to September 16, 2026), the 95th percentile losing run was 16 losses. Using that run, a 20% drawdown tolerance gives a cap of 1.38%. A 10% tolerance gives 0.66%. Both land near or below the folk answer of 1%, which is a useful correction: 1% is not especially conservative. It is roughly what a 10% to 20% tolerance through a bad but ordinary losing run already requires.
What would change the answer? A better-measured win rate, a different reward-to-risk shape, or a stricter drawdown limit, such as one imposed by a funded account rulebook. When any of those inputs change, solve again rather than nudging the old number.
Position Size From the Risk Cap and the Stop
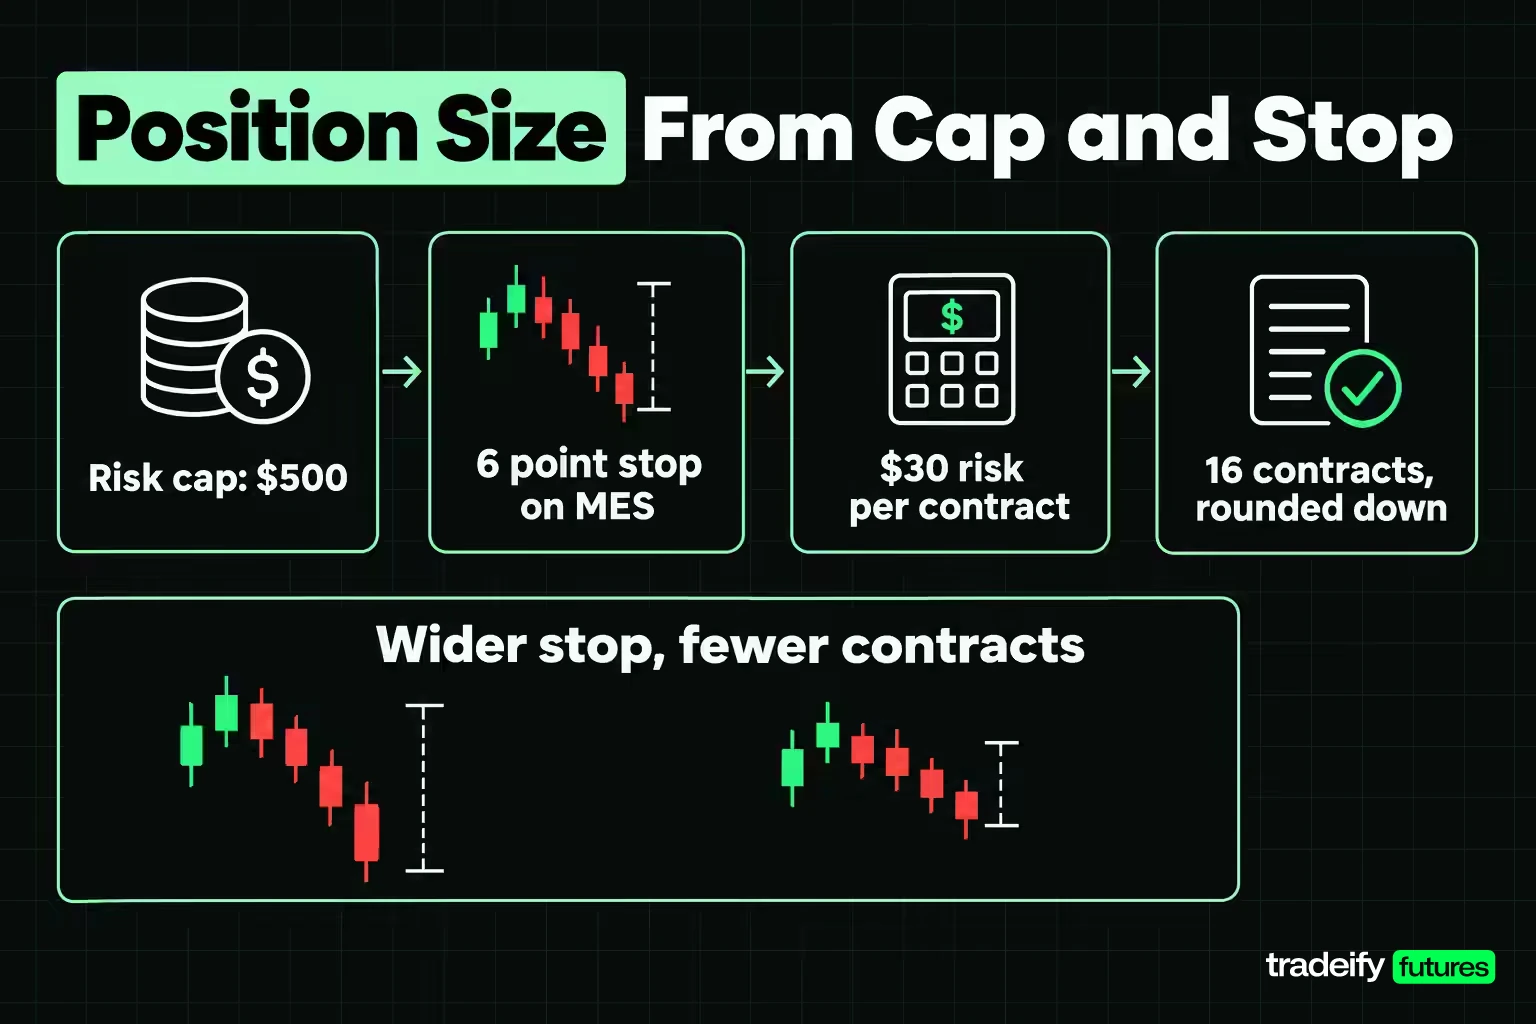
Position size is the dollar risk cap divided by the dollars one contract loses at the stop. The cap stays fixed for the trade; the size changes every time the stop distance changes.
- Contracts = (account equity x risk percentage) ÷ (stop distance in points x dollar value per point)
- Always round down. Rounding up puts the trade above the cap.
Contract values for the four most common equity index futures:
| Contract | Dollar value per index point | Minimum tick |
|---|---|---|
| E-mini S&P 500 (ES) | $50 | 0.25 points = $12.50 |
| Micro E-mini S&P 500 (MES) | $5 | 0.25 points = $1.25 |
| E-mini Nasdaq-100 (NQ) | $20 | 0.25 points = $5 |
| Micro E-mini Nasdaq-100 (MNQ) | $2 | 0.25 points = $0.50 |
Worked contract sizes for ES, MES, NQ and MNQ
Worked examples on a $50,000 account at a 1% cap, so a $500 budget, using median stops of 6.00 points on ES and MES and 37.25 points on NQ and MNQ (from this guide's illustrative study):
- ES, 6.00 point stop. 6 x $50 = $300 per contract. $500 ÷ $300 = 1.67, so 1 contract, risking $300.
- MES, 6.00 point stop. 6 x $5 = $30 per contract. $500 ÷ $30 = 16.67, so 16 contracts, risking $480.
- NQ, 37.25 point stop. 37.25 x $20 = $745 per contract. $500 ÷ $745 = 0.67, so 0 contracts. The trade is not available at this cap.
- MNQ, 37.25 point stop. 37.25 x $2 = $74.50 per contract. $500 ÷ $74.50 = 6.71, so 6 contracts, risking $447.
The best position sizing method is usually this one, fixed-fractional sizing from the stop, because it keeps the loss per trade constant while the stop distance changes. Fixed contract counts ("always trade two") let risk swing with volatility, and fixed dollar amounts ignore account growth or decline. Commissions also matter when using micros: ten micro contracts cost more round trip than one equivalent mini, so once a size reaches a multiple of ten micros, the mini is usually the cheaper way to hold the same risk.
Related lesson: Position sizing futures contracts
Stop-Loss Placement Before the Risk per Trade
The stop belongs where the trade idea is proven wrong: beyond the level that would invalidate the setup. Only after the stop is placed does the risk cap come in, and its job is to decide how many contracts that stop allows, or whether the trade is available at all.
Doing it the other way around is a common risk failure. A trader decides to risk $500 on one NQ contract, sees that the logical stop is 37.25 points away ($745), and squeezes the stop to 25 points to fit the budget. The trade now fits the cap on paper, but the stop sits inside normal noise and is more likely to be hit for reasons unrelated to the idea.
A few rules keep stop placement and the risk cap honest:
- Place the stop first, then size. If the size rounds to zero, take a smaller contract or skip the trade.
- Never widen a stop after entry. Widening it raises the risk above the cap you set when your judgment was calmer.
- Expect some slippage. A stop order becomes a market order once its price is reached, and in a fast market the fill can be worse than the stop price. A cap that is exactly at your limit has no room for that.
- Use resting orders, not mental stops. A percentage in a spreadsheet does not close a position. A working stop order does.
Related lesson: Stop loss orders and placement
Account Size and the Smallest Risk per Trade
A percentage cap has to turn into whole contracts, and that conversion has a floor. The smallest risk you can take on a product is one contract at your stop distance. If that floor is above your cap, the product is not tradable for that setup on that account.
The table shows one contract's risk, at the median stops from this guide's illustrative ES and NQ study (6.00 points on ES and MES, 37.25 points on NQ and MNQ), as a percentage of four account sizes.
| Account size | One ES contract | One MES contract | One NQ contract | One MNQ contract |
|---|---|---|---|---|
| $25,000 | 1.2% | 0.12% | 2.98% | 0.3% |
| $50,000 | 0.6% | 0.06% | 1.49% | 0.15% |
| $100,000 | 0.3% | 0.03% | 0.74% | 0.07% |
| $150,000 | 0.2% | 0.02% | 0.5% | 0.05% |
On a $25,000 account, one ES contract at a 6.00 point stop is already 1.2% of the account, and one NQ contract is 2.98%. A 1% cap rules out both on those stops, while the micro versions fit easily. On a $150,000 account the same NQ contract is 0.5%, so the full-size product becomes available.
Larger accounts give more precision, not more permission. A bigger balance lets you express the same cap in finer steps; it does not make a larger percentage safer. Small accounts face the opposite problem: rounding a fraction of a contract up to one can quietly double the intended risk.
Related lesson: Mini and micro futures contracts
Common Risk Sizing Mistakes That Break a Per-Trade Cap
A risk cap rarely fails because the percentage was a little off. It fails because the cap was applied to something other than the loss the trade could actually produce. These are the common risk mistakes and the check that catches each.
| Mistake | What goes wrong | The check |
|---|---|---|
| Sizing by gut or by recent results | Size grows after wins and shrinks or jumps after losses | Compute size from the formula before every order |
| Rounding up to one contract | Actual risk exceeds the cap, sometimes by double | Round down; if it rounds to zero, use micros or skip |
| Sizing off the starting balance | After a losing stretch, each trade risks more than the cap | Recalculate from current equity |
| Squeezing the stop to fit | The stop sits inside normal noise and gets hit more often | Place the stop at invalidation first |
| Ignoring correlated positions | Two positions on one idea double the real risk | Add up risk across every position on the same view |
| Forgetting costs | Commissions and slippage push each loss past the cap | Leave room under the cap for costs |
Correlated positions break a per-trade risk cap
Correlated positions deserve a closer look because each leg can pass the check while the combined position breaks it. In this guide's illustrative study of Yahoo Finance 5-minute bars (July 8 to September 16, 2026), ES and NQ returns had a correlation of 0.8962 across 13,632 aligned bars, so a long in each behaves much like one larger long.
One ES contract at 6.00 points ($300) plus one NQ contract at 37.25 points ($745) is $1,045 of risk, 2.09% of a $50,000 account. Each leg looks acceptable on its own. Together they are roughly double a 1% cap on what is effectively one trade idea. Sum the risk of every position expressing the same directional view, and compare that sum to the cap before any of them is opened.
Related lesson: Correlation risk
Holding a Risk Cap Through a Losing Streak
The hard part of a maximum risk per trade is not the math. It is keeping the same number on loss eight, nine and ten, when the last few trades feel personal and every instinct is pulling the other way.
The pull usually goes in one of two directions. Some traders raise size to win back the losses faster, which turns an ordinary streak into a deep drawdown. Others cut size sharply after a run of losses, then restore it after a few wins, which means they trade small when the strategy recovers and full size when it struggles. Both feel reasonable in the moment. Both quietly replace the strategy you measured with a different one you never tested.
What helps is deciding before the streak arrives:
- Know your expected run. If your loss rate and sample size say a 12-loss streak is ordinary, then loss 12 is information you already had, not a verdict.
- Write the cap down with a review date. Change it only after a stated block of trades, for example the next 100, never mid-streak.
- Set a stopping rule above the cap. A daily loss limit or a maximum number of losses per session ends the day before frustration starts sizing the trades.
- Journal the risk, not just the result. Record the planned risk, the actual loss and whether the stop was moved. A cap that is broken twice a week is not a cap.
There is also a quieter benefit. A trader who knows the cost of a bad run in advance tends to take the next valid setup with the same size, instead of hesitating after a loss and missing the trade that would have recovered it.
Related lesson: Trading psychology
Risk per Trade on Prop and Funded Accounts
On a prop firm evaluation or funded account, the account balance is not the number to size against. The binding limits are the firm's maximum drawdown and, on some accounts, a daily loss limit. A risk cap of 1% of the nominal balance can be far too large for those limits.
Take an illustrative rule set, not any specific firm's: a $50,000 account with a $3,000 maximum drawdown and a $1,000 daily loss limit.
- At 1% of the balance ($500 per trade), 6 straight losses use the whole $3,000 drawdown, and 2 losses reach the daily limit.
- To survive a 16-loss stress run, the per-trade risk can be no more than $3,000 ÷ 16 = $187.50, which is 0.375% of the nominal balance.
- With a trailing drawdown, the room left shrinks as the drawdown floor follows the balance up, so sizing against the remaining cushion is more accurate than sizing against the original allowance.
The practical approach on any funded account is to treat the firm's published limits as a ceiling and set your own cap well below them, so that an ordinary losing run cannot use up the account. A trade that is sized correctly for a personal account can still be oversized for a prop rulebook.
On our accounts, a losing run meets two rules: the trailing drawdown and, where it applies, the daily loss limit. On a 50K Growth funded account, the end-of-day trailing drawdown is $2,000, so surviving a 16-loss run means risking no more than $125 per trade. Our 50K Growth evaluation has a $1,250 daily loss limit, and our 50K accounts allow up to 4 minis or 40 micros, so micros are often the way to size that small. Funded accounts are simulated.
Building a Risk Plan Around Your Maximum Risk per Trade
A maximum risk per trade is only real when it is written down, applied before every order and left alone long enough for evidence to build up. A plan that does that fits on one page:
- Measure your loss rate. Count losing trades divided by resolved trades over at least a few hundred trades, from your journal or a backtest, not from memory.
- Find your stress-case losing run. Use the longest-run percentiles for that loss rate and trade count, and plan for the 95th percentile rather than the median.
- Choose the drawdown that means "stop and review." Decide it now, before the next losing run, and include any external limit such as a funded account drawdown.
- Solve for the cap. For a 16-loss stress run, a 20% tolerance gives 1.38% and a 10% tolerance gives 0.66%.
- Convert the cap to contracts. Divide the dollar cap by the risk of one contract at your typical stop and round down. If it rounds to zero, switch to micros or drop the setup.
- Add the session limits. Set a daily loss limit and, if you trade several markets, a cap on combined risk across correlated positions.
- Enforce it at the order level. Use resting stop orders and platform risk settings rather than intentions.
- Review on a schedule. Re-derive the cap after a stated block of trades, using the new loss rate, not after a single good or bad week.
A risk cap does not make a strategy profitable, and it cannot guarantee survival. If expectancy is negative after costs, a smaller cap only makes the path down longer. What the cap does is set the price of the losing runs every strategy goes through, so that the account is still there when the strategy's edge, if it has one, gets the chance to show up.
Related lesson: Trading expectancy
Maximum Risk per Trade FAQ
What percentage of your account should you risk per trade?
Most guidance lands between 0.5% and 2% of current equity per trade, with 1% the common default. A better answer comes from your own numbers: choose the drawdown you can accept and the losing run you need to survive, then solve for the cap. For a 16-loss run, a 20% drawdown tolerance gives 1.38% per trade.
Is it true that 97% of day traders lose money?
Not as a universal rule, but the best-known study points that way. Chague, De-Losso and Giovannetti studied Brazilian equity index futures day traders, and of the 1,551 individuals who kept day trading for more than 300 days, 97% lost money. It covers one market and period, yet it is strong evidence that persistent day trading loses money for most people.
Can you make $100 a day on forex?
Some traders do on some days, but no strategy produces a fixed daily amount, and losing days and losing runs are part of every record. On a $10,000 account at 1% risk, $100 is a single full loss, so averaging $100 a day would need a positive expectancy over many trades, not one good trade. Chasing a daily target tends to push traders into oversizing, which is the opposite of what a risk cap is for.
What are the best position sizing strategies?
Fixed-fractional sizing, which risks a set percentage of current equity based on the stop distance, is the most widely used because it keeps each loss proportional to the account. Fixed-dollar risk is simpler and works well against a hard drawdown limit. Fixed contract counts are the weakest choice, because the dollar risk changes every time the stop distance does.
Is risking 5% per trade too much?
For most strategies, yes. At 5% per trade, a 10% drawdown arrives after 3 losses, and 14 consecutive losses halve the account. A 12-loss run, which is ordinary for a strategy that loses 60% of the time, would cost 45.96% of the account.
Should risk be a percentage of starting balance or current equity?
Current equity, because each loss is taken against the balance that exists at the time. Sizing every trade off the starting balance means risking more than the cap after any losing stretch, exactly when the account can least afford it.
Is maximum risk per trade the same as position size?
No. Maximum risk per trade is the dollar loss you accept at the stop, while position size is that amount divided by the loss per contract, so the size changes as the cap stays fixed.
Futures trading involves substantial risk of loss and is not suitable for everyone. Leverage means losses can exceed what a position's margin suggests, and a stop order does not guarantee the fill price. Evaluation and funded accounts are simulated, and simulated results do not reflect live market conditions. The study figures in this guide are illustrative measurements on past data, not a prediction of future results. Nothing here is investment advice.


