




TL;DR: How to create a trading plan comes down to writing fixed commitments first and testable settings second. Commitments cover markets, hours, risk per trade and loss limits, and you set them once. Settings like stops, targets and lookbacks need hundreds of trades before a change is readable. On a $50,000 account risking 1%, a 27.4-point ES stop fits 3 MES contracts and no full ES contract. Write the rule for changing the plan before you need it.
Most traders who sit down to write a trading plan already know the list. Markets, entries, exits, risk, journal, review. The list is rarely the problem. The problem is that every line gets the same status, so after a rough week the stop gets nudged, the target gets moved and the size rule gets an exception. A month later you are trading a different plan, and the journal can no longer tell you whether the first one worked.
This guide walks through every part of a trading plan, then adds the piece most templates skip: which lines you can actually test, how many trades that takes, and which lines you should simply decide and leave alone. The numbers come from a stated study of one breakout rule on twenty years of E-mini S&P 500 futures, so you can see the size of the noise instead of taking it on faith.
What a Trading Plan Is and Why It Works Like a Business Plan
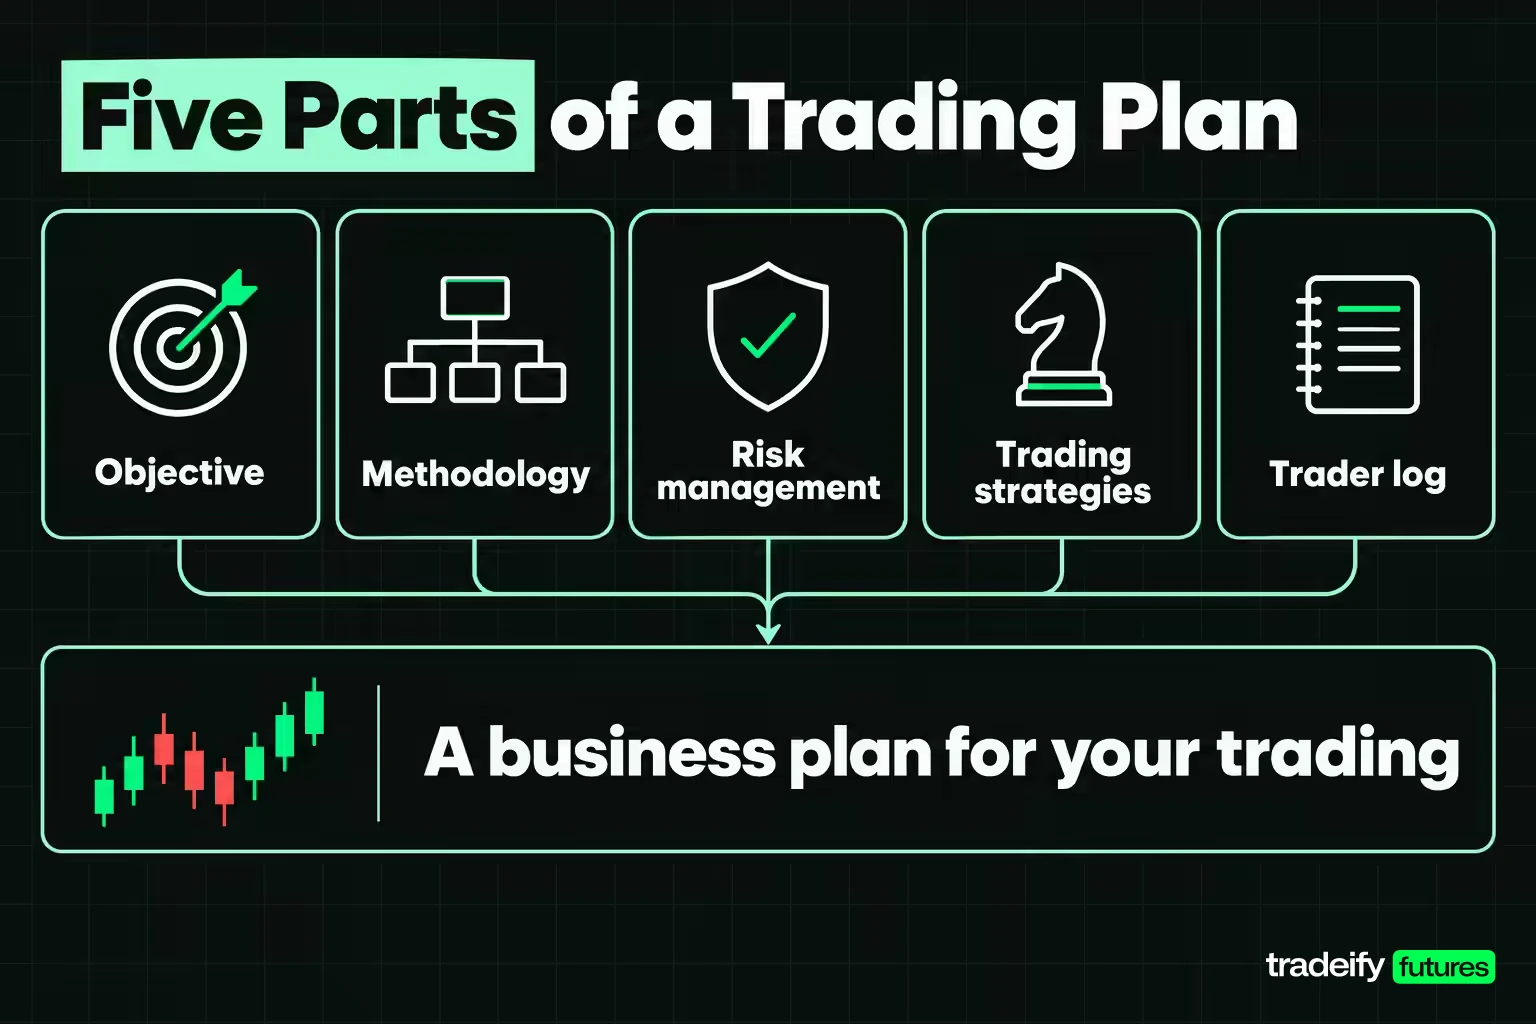
A trading plan is a written set of rules that decides, before the session starts, what you trade, when you trade it, how much you risk and what you do after you are wrong. CME Group's own course on the subject calls a trading plan "a business plan for your trading career" and a "working document" in which some assumptions "will surely be wrong." It names five components: an objective, a methodology, risk management, trading strategies and a trader log.
A trading plan is not the same thing as a strategy. A strategy is one repeatable way of finding and managing a trade, such as buying a breakout above a 20-session high. The plan is the business around it: which strategies are allowed, how much capital they get, when the business closes for the day, and how the results get audited.
Why a written plan beats a plan in your head
A plan in your head gets edited by your mood. After three losses the stop that felt right on Sunday suddenly looks too tight, and after three wins the size limit looks timid. Writing it down does not remove the feeling. It gives you a fixed line to hold the feeling up against, and that is usually enough to catch the edit before it reaches the order ticket.
There is also a cost argument. In Barber and Odean's study of 66,465 households at a large discount broker from 1991 to 1996, the households that traded most earned 11.4% a year while the market returned 17.9%. That study covers stock investors, not futures traders, but the lesson carries: activity is not edge, and a plan is how you keep activity tied to a reason.
The two halves of a testable trading plan
The most useful way to write a trading plan is to split it in two.
- Commitments. Markets, session hours, maximum risk per trade, daily and weekly loss limits, maximum open positions, review day. You pick these once. Their value comes from not revisiting them.
- Settings. Entry condition, stop distance, profit target, time exit, lookback lengths. These are claims about your edge, and claims need evidence before they earn a permanent place.
Commitments go in ink. Settings go in pencil, with a written rule for when the pencil is allowed to move.
Trading Goals a Plan Can Actually Measure
Most first trading plans open with a money goal: a monthly income, a dollar figure per day, an account size by year end. The trouble is that a money goal measures the market as much as it measures you. A good month in a trending market and a careful month in a choppy one can produce opposite numbers from identical behavior.
A trading plan works better with two kinds of goal written separately.
- Process goals you control every session: follow the entry checklist on every trade, place the stop before the entry fills, stop trading at the daily limit, log every trade the same day.
- Outcome goals you only judge over a large sample: average result per trade in R (one R is the amount you planned to lose if the stop is hit), worst drawdown, and rule adherence rate.
Why a dollar-per-day target is the wrong unit
Take the common goal of making $100 a day. On one Micro E-mini S&P 500 contract, which moves $5 per index point, $100 is a 20-point move in your favor. On a plan that risks $500 per trade, it is 0.2R. Neither number says anything about whether today's market offers a 20-point move or whether your setup appeared at all.
A daily dollar target also pushes you toward the worst behavior on the days you are behind it: larger size, lower-quality setups, and holding losers in the hope they turn. Write the outcome goal as an average over the next 100 trades instead, and the pressure to force a trade on a quiet Tuesday goes away.
Outcome goals with a sample size
Every outcome goal in a trading plan, such as average R per trade or worst drawdown, needs a sample size attached. "Average at least 0.1R per trade" means nothing after ten trades. "Review average R after every 50 trades and judge the strategy only after the sample reaches the number in my change rule" is a goal you can actually check.
Related lesson: Process goals that do not need a season of evidence
Choosing the Markets Your Trading Plan Covers
The market section of a trading plan answers three questions: which instruments, which contract size, and which hours. The answer should come from arithmetic before it comes from preference.
Start with the dollar value of a point. Per CME Group's contract specifications, E-mini S&P 500 futures (ES) move $50 per index point, and Micro E-mini S&P 500 futures (MES) move $5 per index point, one tenth of the size. Both have a minimum tick of 0.25 index points, worth $12.50 on ES and $1.25 on MES. Then look at how far your stop normally sits. In a twenty-year breakout study run for this guide on Yahoo Finance's continuous ES daily data, a stop of one average true range (ATR) ran from 12.6 index points at the narrow end to 92.6 at the wide end, with a median of 27.4.
Multiply those together and you have the dollar risk of one contract. If one contract of a market costs more than your risk budget at a normal stop distance, that market belongs in a later version of the plan, not this one.
Market checklist for a trading plan
- Dollar risk per contract at your usual stop distance, at the narrow and wide ends of its range.
- Liquidity during your hours, so a stop fills close to where you placed it.
- Session hours that overlap the time you can actually sit at the screen.
- Scheduled events that move it, such as economic releases and inventory reports, so you know which days the plan treats differently.
Why fewer markets is a feature
A plan that covers eight markets has eight sets of habits, eight volatility regimes and eight event calendars. It also spreads your journal so thin that no market reaches a readable sample. One or two related markets let the journal fill up fast enough to tell you something.
Related lesson: How to pick the first market for a plan
Trading Style and Time Commitment in a Trading Plan
Your trading style decides how long you hold a position, and the honest starting point is the hours you have, not the style you admire. A trading plan that assumes six free hours a day breaks the first week your job or family needs one of them.
| Trading style | Typical hold | Screen time it asks for | Plan line it changes most |
|---|---|---|---|
| Scalping | Seconds to minutes | Continuous during a short window | Costs per trade and maximum trades per day |
| Day trading | Minutes to hours, flat by the close | A fixed session window | Daily loss limit and flat time |
| Swing trading | Days to weeks | Short daily check and order placement | Overnight gap risk and position size |
| Position trading | Weeks to months | Weekly review | Stop width and capital per position |
Write the style into the plan as a window, not a mood. "I trade the first two hours after the cash open, Monday to Thursday" can be followed and audited. "I trade when the market looks good" cannot.
Work-life balance and the trading window
A fixed trading window does a second job: it ends the session. Without an end time, the plan quietly allows the extra hour after a loss, the late session after dinner and the check-in at midnight, and those are where tired decisions happen. Burnout in trading rarely looks dramatic. It looks like skipped journal entries, a stop moved because you wanted the day to be over, and a plan that stops being read.
Put the stop time, the days off and the maximum screen hours in the commitment half of the plan. They are not about edge. They protect the person who has to execute the edge.
Related lesson: How the main trading styles differ in practice
Entry Rules a Trading Plan Should Spell Out
An entry rule in a trading plan is written well when a stranger could take the same trade from the text alone. If the rule needs you to explain what you meant, the market will get a different version of it every time.
A complete entry rule has five parts.
- Setup. The condition that makes a trade possible, such as a close above the highest high of the prior 20 sessions.
- Trigger. The exact moment you act, such as the next session's open.
- Filter. The conditions that cancel a valid setup, such as a major scheduled release in the next 30 minutes or a stop distance wider than your budget allows.
- Order type. Market, limit or stop entry, and where the protective stop goes when the entry fills.
- No-trade rule. What you do when the setup appears and you missed it.
The missed-entry clause in a trading plan
The missed-entry clause says what you do when a valid setup triggers without you. Most plans skip it, and it is where a lot of damage happens. When price runs without you, the next price is not a late version of the same trade. It is a different trade with a worse location and a stop that no longer makes sense. Write it plainly: if the entry is missed by more than a stated distance, there is no trade.
Observation versus confirmation
Entry rules also need to separate what you notice from what you act on. Price approaching an old high is an observation. A close above it is the confirmation the rule asks for. Treating the first as the second is how a plan quietly turns into anticipation trading.
Building the Trading Strategy Inside the Plan
The strategy section of a trading plan holds the method you use to find trades, written as an if-then rule with a clear invalidation. How you create a trading strategy matters less than whether you can state it that way.
Most retail strategies fall into a few families.
- Trend following and breakouts. Buy strength above a prior high or sell weakness below a prior low, accept a low win rate, and rely on larger winners.
- Pullbacks in a trend. Wait for a move against the trend toward a moving average or prior level, then enter in the trend's direction.
- Mean reversion and range trading. Fade moves to the edges of a range when the market is not trending, with tight targets.
- Support and resistance reactions. Trade the first test of a level that has turned price before, with the stop beyond the level.
- News and event trading. Trade the reaction to a scheduled release, which needs a plan for wider spreads and slippage.
How to create a trading strategy you can write down
Start from a market behavior you can describe in one sentence, then turn it into the five parts of an entry rule plus an exit rule. Test it on historical data with the rules frozen first, then on a simulator or very small size in real time. A strategy that only works when you describe it loosely is not a strategy yet.
Add one more line: what would prove the idea wrong. "A breakout that closes back inside the range within two sessions" is a usable invalidation. Without one, every loss gets explained away and the strategy never gets judged.
One strategy per plan, at first
A first trading plan should carry one strategy. Two strategies split your journal into two samples, each of which takes twice as long to read. Add a second only after the first has a sample large enough to judge.
Exit Rules and Profit Targets in a Trading Plan
Exit rules decide most of what a trading plan earns, and they need to cover four cases: the stop, the target, the time limit and the gap.
- Stop exit. Where you are wrong, set at entry, never widened.
- Profit target. A fixed multiple of the stop, a prior level, or a trailing rule. Pick one and write it as a number.
- Time exit. If neither stop nor target is hit within a set number of bars or sessions, the trade closes. Dead trades tie up risk you could use elsewhere.
- Gap or slippage case. If price opens beyond your stop, the exit fills at the open, not at your stop. The plan should expect it.
How exits played out in a breakout study
In a twenty-year study run for this guide on Yahoo Finance's continuous ES daily data, a 20-session breakout rule used a stop of one average true range and a target of two. Its 590 trades closed as 343 stops, 203 targets, 40 time exits and 4 opens beyond the stop. The win rate was 40.3%.
With a target twice the stop, the breakeven win rate before costs is 33.3%, because one winner pays for two losers. That is the arithmetic every exit rule should be checked against: the target you choose sets the win rate you need. A tighter target raises the win rate and lowers the payoff, and a wider one does the reverse.
Profit targets and the urge to take profits early
A written target exists for the moment the trade is working and every tick back toward entry feels like money leaving your pocket. Closing early feels safe, but if the plan's math assumes winners reach two times the stop, every early exit quietly lowers the payoff the win rate was counting on. If you want to manage winners actively, write a trailing rule into the plan and test it as its own setting.
Related lesson: How the target and stop set the win rate you need
Risk Management Rules for a Trading Plan
The risk section of a trading plan is the part that keeps you in the game long enough for the strategy to show whether it works. It covers four lines: where the stop goes, how much one trade may lose, how much one day and one week may lose, and how many positions can be open at once.
- Stop placement. At the point where the trade idea is wrong, not at a dollar amount you would like to lose. Then size the position to fit the stop.
- Risk per trade. A fixed percentage of the current balance. This defines one R.
- Loss limits. A daily stop and a weekly stop in R. For a plan that risks $500 per trade, a daily stop of 2R is $1,000 (2% of a $50,000 account) and a weekly stop of 4R is $2,000 (4%).
- Exposure. Maximum open positions and maximum correlated positions, so two trades in related markets do not become one trade at double size.
Risk per trade and the drawdown it buys
Risk per trade cannot improve a strategy. Every result is measured in R, so halving the risk halves every win and every loss together, and the average result per trade stays exactly where it was. What it changes is how deep the drawdowns get.
A twenty-year breakout study run for this guide on Yahoo Finance's continuous ES daily data shows the effect. It applied four risk levels to the same 229 trades a single-position trader could have taken, each as a fixed fraction of the current balance.
| Risk per trade | Worst drawdown | Total return over 20 years |
|---|---|---|
| 0.25% | 4.4% | 6.0% |
| 0.5% | 8.7% | 12.1% |
| 1% | 16.7% | 24.3% |
| 2% | 31.0% | 47.6% |
Doubling the risk roughly doubles both columns. The return column is the one people look at. The drawdown column decides whether you and the account are still trading the plan when the recovery comes, and most first plans leave it blank. Pick the risk level by the drawdown you can sit through, not by the return you want.
Related lesson: The session-ending limits that sit in the commitment half
Position Sizing in a Trading Plan With a Worked Futures Example
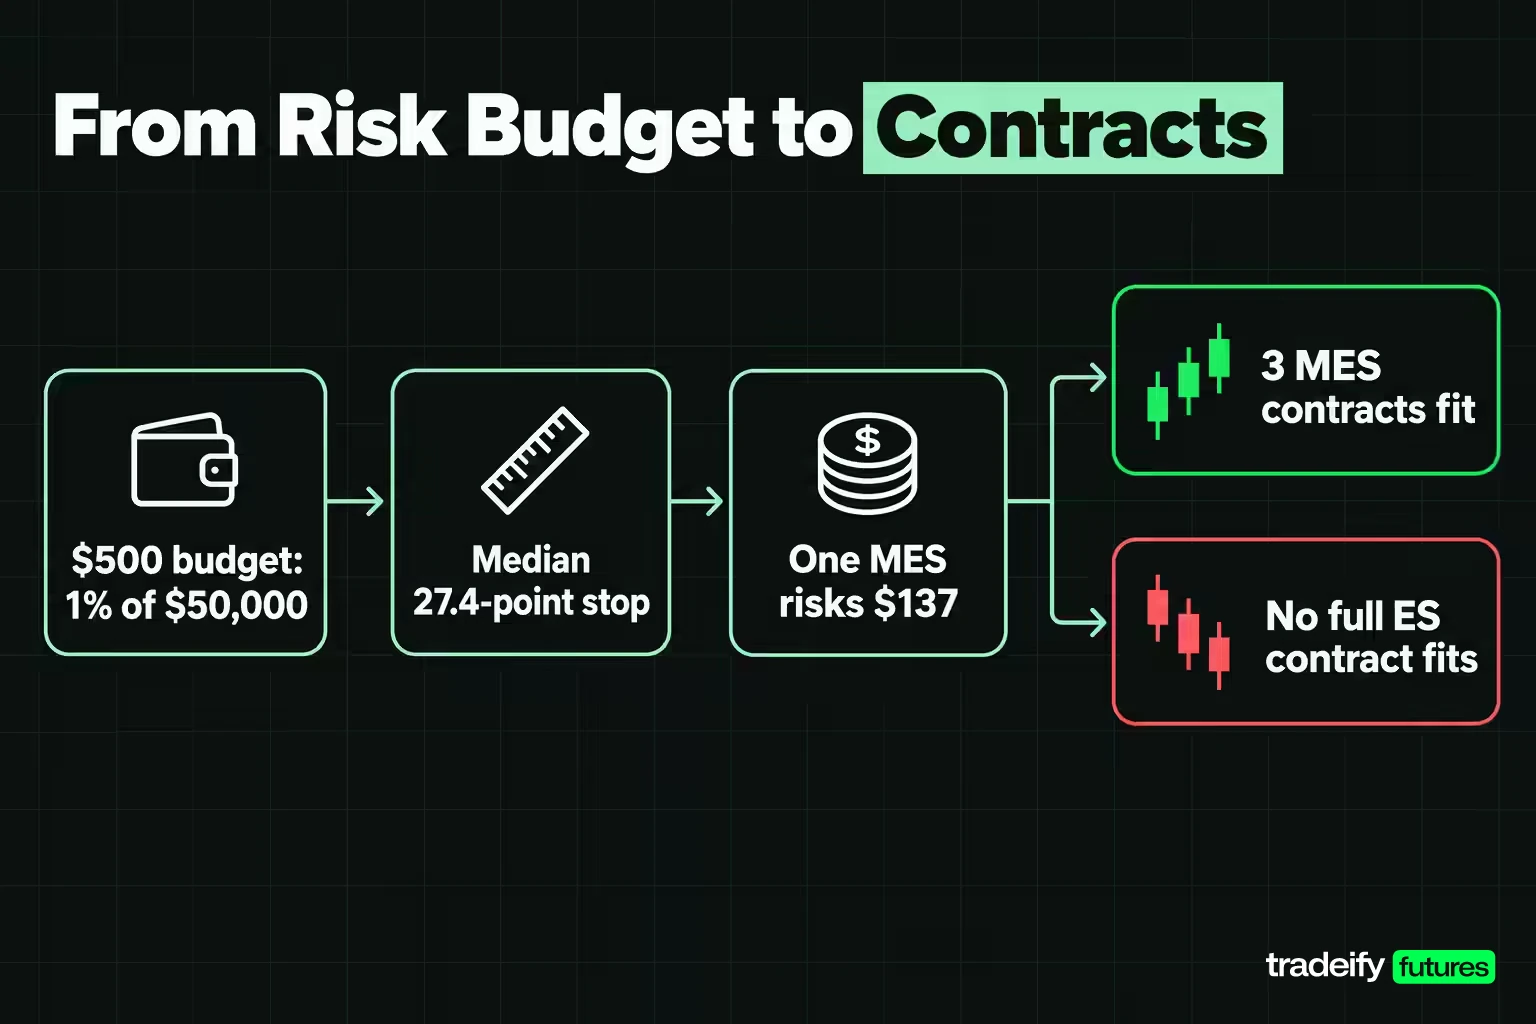
Position sizing is the line in a trading plan that turns a risk percentage into a number of contracts. It is arithmetic, so you can finish it today, before you have any evidence about your edge.
The formula is short: risk budget divided by the dollar risk of one contract, rounded down. The dollar risk of one contract is the stop distance in points times the dollar value of a point. The stop distance is what moves. In a twenty-year breakout study run for this guide on Yahoo Finance's continuous ES daily data, a one-ATR stop (one average true range) ran from 12.6 index points at the 5th percentile to 92.6 at the 95th, with a median of 27.4.
Worked example on a $50,000 account
Take an illustrative $50,000 account risking 1% per trade, a budget of $500. Per CME Group's contract specifications, ES moves $50 per index point and MES moves $5.
| Stop distance | One MES risks | One ES risks | MES that fit at 1% | MES that fit at 0.5% |
|---|---|---|---|---|
| 12.6 points (narrow) | $63 | $630 | 7 | 3 |
| 27.4 points (median) | $137 | $1,370 | 3 | 1 |
| 92.6 points (wide) | $463 | $4,630 | 1 | 0 |
A single ES contract does not fit a $500 budget at any of the three stop distances. At the wide end, one ES risks $4,630, which is 9.3% of the account, more than nine times what the plan allows.
Three sizing rules to copy into the plan
- Size from today's stop, not the average one. The same number of contracts becomes a very different percentage of the account on a volatile day.
- Round down. You cannot hold part of a contract, and rounding up breaks the risk rule on every trade.
- Zero is a valid answer. If the stop is wider than the budget allows for even one contract, the plan says no trade, not one contract anyway.
Related lesson: The sizing method this example uses
Trading Capital Rules Your Plan Needs
The capital section of a trading plan decides what money is allowed in the account and what happens to it as the balance moves. It is separate from risk per trade, and it is often missing.
- Risk capital only. The plan names the amount you can lose without changing your life: no rent money, no borrowed money, no emergency fund.
- Sizing from the current balance. A 1% rule means 1% of today's balance. After a drawdown the dollar risk shrinks, which slows the damage. Plans that keep sizing from the starting balance quietly raise the percentage as the account falls.
- Withdrawals. A written rule for when profit leaves the account, such as a fixed share of each month's net gain, so that profit taking does not depend on mood.
- Compounding. Whether profits raise the risk unit, and how often. Recalculating once a month is easier to audit than recalculating after every trade.
- Top-ups. Whether you will ever add money after a loss. A plan that answers no in advance removes one of the most expensive decisions a trader makes under stress.
- Records. Keep statements and the journal in a form an accountant can use. Tax treatment depends on the product and your country, so confirm it with a tax professional rather than with the plan.
Which Trading Plan Settings You Can Actually Test
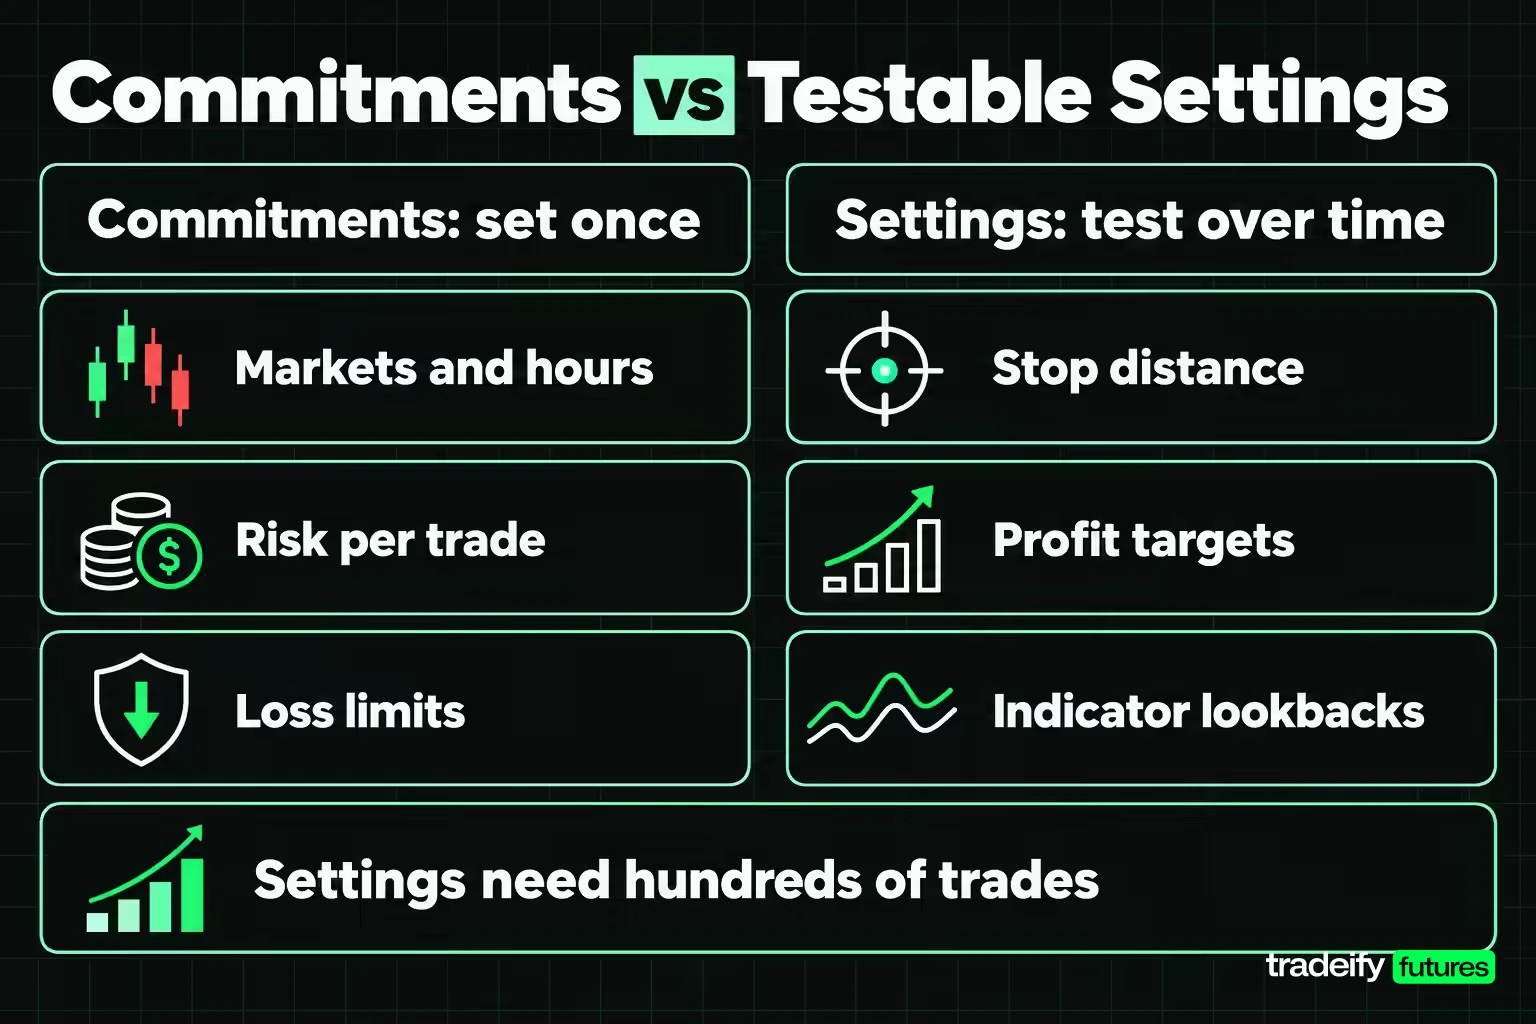
Some lines in a trading plan can be tested, and most traders overestimate how quickly. To show the scale, the study took one stated rule and varied the four settings plans usually write with the most confidence, one at a time.
The data, run for this guide, was Yahoo Finance's front-month continuous ES daily bars from September 18, 2006 to September 16, 2026: 5,032 completed sessions. The base rule buys at the next open after a close above the highest high of the prior 20 sessions, with a stop of one average true range (14-session Wilder ATR at the signal bar), a target of two, a 20-session time cap, and a cost of 0.5 index points per round trip. It produced 590 signals averaging 0.134R per trade, with a bootstrap 95% interval of 0.024R to 0.247R.
The four settings, varied one at a time
| Setting varied | Values tested | Average R per trade | Spread best to worst | Shuffle matches the spread |
|---|---|---|---|---|
| Stop distance (ATR) | 0.5, 1.0, 1.5, 2.0 | 0.099R, 0.134R, 0.077R, 0.093R | 0.057R | 91% |
| Profit target (ATR) | 1.0, 1.5, 2.0, 3.0, 4.0 | 0.054R, 0.080R, 0.134R, 0.125R, 0.135R | 0.081R | 87% |
| Breakout lookback (sessions) | 10, 20, 40, 60 | 0.202R, 0.134R, 0.066R, 0.063R | 0.139R | 38% |
| Time cap (sessions) | 5, 10, 20, 40 | 0.048R, 0.104R, 0.134R, 0.142R | 0.093R | 61% |
The last column is the test. For each setting, all the trades were pooled, shuffled at random and dealt back into groups of the same sizes 5,000 times. If the setting had no real effect, a random deal would produce a spread as wide as the real one fairly often. It did, for every setting. Even the lookback, which looks like the clearest winner, was matched by pure chance 38% of the time.
Why one breakout study cannot rank plan settings
In the twenty-year ES breakout study, each setting's own 95% interval was roughly plus or minus 0.075R to 0.169R, wider than most of the gaps between neighboring stop, target, lookback and time-cap values. Moving a stop from 1.0 to 1.5 ATR on that evidence is not choosing a better number. It is choosing a different number and paying for it in consistency.
None of this says stops and targets do not matter. It says one rule on one market over twenty years of daily bars cannot rank them, and a personal journal with far fewer trades cannot either. The practical move is to pick sensible settings once, freeze them, and spend your evidence on the question that matters first: does the rule make money at all?
This is a study of one rule on one historical price series, presented as an illustration. It is not a recommendation of the rule or a forecast.
Related lesson: How much a sample has to say before a backtest means anything
Using a Trading Journal to Review the Plan
The trading journal is how a trading plan gets audited. Without it, the review is memory, and memory keeps the dramatic trades and loses the ordinary ones that make up most of the sample.
Log the same fields for every trade:
- Date, market, direction and setup name.
- Planned entry, stop and target, and the actual fills.
- Result in R as well as in dollars.
- Whether every plan rule was followed, as a yes or no.
- One line on what you saw and how you felt at entry.
How many trades a journal needs before it can judge a plan
The spread of results decides the answer. In a twenty-year breakout study run for this guide on Yahoo Finance's continuous ES daily data, a single trade's result had a standard deviation of about 1.42R. With that spread, a 95% interval around your average result needs about 125 trades to exclude zero if your true edge is 0.25R per trade, and about 780 trades if it is 0.10R.
Set that beside a realistic trade rate. Taking one position at a time, the study rule produced about 11.5 trades a year. At that pace, 125 trades is about 11 years of journaling. A strategy that trades several times a day reaches the same count in months, which is one of the real advantages of shorter time frames.
A 50-trade journal with that spread carries an interval of about plus or minus 0.39R around its average, and 100 trades about plus or minus 0.28R. Both are wider than any gap the same study found between different stop, target, lookback and time-cap settings on 590 signals. So a 50-trade journal can tell you whether you followed the plan. It usually cannot tell you which setting is better.
A weekly trading journal review routine
Review the trading journal on a fixed day each week. Score rule adherence first, because a plan you did not follow has not been tested. Then check average R and drawdown against the plan's limits. Write down one observation and no more than one proposed change, and park the change until the change rule allows it.
Related lesson: The record that has to exist before any setting can be tested
When to Update a Trading Plan and When to Leave It
A trading plan should change on a schedule you wrote in advance, not on the morning after a bad week. The update rule belongs in the plan itself.
Write the change rule before you need it
A trading plan's change rule has three parts:
- A minimum count. No setting in the testable half changes until the journal holds a stated number of trades taken under that setting.
- One change at a time. Change one setting, record the date, and run it for the same count again. Two changes at once make it impossible to tell which one did the work.
- A fixed review question. Decide in advance what the review is checking, such as whether average R is still above zero with the interval taken into account, so the review cannot turn into a hunt for the best-looking setting.
Why searching for the best setting fools you
Searching across many versions of a plan almost guarantees one will look good. To measure the effect on the twenty-year breakout study run for this guide (Yahoo Finance's continuous ES daily data), the rule's edge was removed entirely so every trade averaged zero, then dealt the trades into equal random groups and kept the best group. With 4 groups the best averaged 0.12R. With 8 it averaged 0.24R. With 20 it averaged 0.50R. None of those groups had any edge at all. That is what testing twenty variations and keeping the winner looks like.
What justifies changing a trading plan
The commitment lines of a trading plan (markets, hours, risk per trade, loss limits) can change for life reasons: a new job changes your hours, an account change changes your loss limits. Those are allowed any time, as long as you write the date. Testable settings such as stops, targets and lookbacks change only once the journal reaches the trade count the change rule sets. And a strategy is broken, rather than having a bad month, when the journal holds enough trades for its interval to sit below zero, or when the market behavior the strategy relies on has plainly changed, such as a contract's trading hours or a rule that removes your setup.
A losing streak alone is not evidence. In the 590-trade breakout study run for this guide on Yahoo Finance's continuous ES daily data, the longest losing run was 15 trades in a row, from a rule whose average stayed positive.
Related lesson: The review that turns a log into a decision
Trading Psychology Rules to Write Into the Plan
Trading psychology belongs in the plan as rules, not as reminders to stay calm. The feelings will show up regardless. The plan decides what you do when they do.
- After a loss. The next trade uses the same size and the same checklist. If you notice the urge to win it back, take a stated break, such as 15 minutes away from the screen, before the next order.
- After a run of losses. Every rule produces losing runs. A breakout rule on twenty years of ES daily bars kept a positive average and still lost 15 trades in a row at one point. The plan can allow a smaller size after a set number of losses, but never a larger one.
- After a run of wins. Size does not step up on a hot streak. It changes only on the scheduled capital review, because a streak feels like skill whether or not it is.
- Hesitation. If you skip valid setups, log each skipped one with its result. Skipped trades are part of the sample, and they often turn out to be the ones you needed.
- Boredom. A quiet session with no valid setup is the plan working, not failing. Write that sentence into the plan, because a slow day is when invented trades happen.
Each rule turns a feeling into a pre-decided action. You do not have to win the argument with yourself in the moment, with a position open and your pulse up. You only have to read the line.
Sticking to a Trading Plan When It Is Inconvenient
Discipline with a trading plan is mostly a design problem. The fewer decisions the plan leaves for the moment, the less discipline the moment needs.
- A pre-trade checklist. Five or six yes-or-no lines taken from the entry rule. If any answer is no, there is no trade.
- Brackets at entry. Place the stop and target with the entry order, so the exit plan exists before the trade can tempt you.
- Platform loss lockouts. Many trading platforms let you set your own daily loss limit that closes positions and blocks new orders once it is hit. Set it to the plan's daily stop.
- An adherence score. Count the share of trades where every rule was followed. A rising adherence score is a result you control, even in a losing month.
- A written reason for any break. If you break a rule, write which one and why the same day. A list of reasons shows the rule that needs better design.
Following the plan through an inconvenient stretch is also the only way the plan gets tested. A plan that changes every time it is uncomfortable produces a journal of many plans, each with too few trades to judge.
Related lesson: The habits that keep a plan in force
How to Create a Trading Plan on One Page
The finished trading plan should fit on one page you can read before every session. Fill in each line with a number, a direction and a time wherever possible.
| Plan line | Half | Example answer (illustrative) |
|---|---|---|
| Markets | Commitment | MES only |
| Trading window | Commitment | First two hours after the cash open, Monday to Thursday |
| Risk per trade | Commitment | 0.5% of the current balance, rounded down to whole contracts |
| Daily and weekly stop | Commitment | 2R daily, 4R weekly, platform lockout set to match |
| Maximum open positions | Commitment | One |
| Entry rule | Setting | Setup, trigger, filter and order type written so a stranger could follow it |
| Stop rule | Setting | One ATR beyond entry, placed with the entry order |
| Exit rule | Setting | Target of two times the stop, time exit after a set number of bars |
| Missed entry | Commitment | No trade if price has moved more than a set distance past the trigger |
| Journal fields | Commitment | Planned and actual prices, result in R, rules followed, one note |
| Review day | Commitment | Every Friday after the close |
| Change rule | Commitment | No setting changes before a stated trade count, one change at a time |
Writing it takes an afternoon. Keeping it unchanged for the next hundred trades is the hard part, and it is exactly what makes the plan testable.
Writing a Trading Plan Around Prop Firm Rules
A trading plan for a prop firm account keeps the same structure, but the firm's rules become the outer limits of the commitment half. A daily loss limit, a trailing drawdown, a contract cap and a required flat time are all fixed constraints, and your own limits should sit inside them with room to spare.
Write the firm's limits in R. If a daily loss limit equals four of your planned losses, your own daily stop belongs at two or three, so a slipped stop or a fast market does not take the account to the edge. A trailing drawdown also changes sizing: the room you have is the distance to the drawdown floor, not the account balance, so size from that distance.
On our accounts at Tradeify, every position must be closed by 4:45 PM ET, so a plan written for one of our accounts is an intraday plan with no overnight or weekend holds. A 50K Growth account allows up to 4 minis or 40 micros, has a $1,250 daily loss limit and a $2,000 trailing max drawdown measured end of day. Our funded accounts are simulated.
Trading Plan FAQ
What should a trading plan include?
A trading plan should include your markets, trading hours, entry rules, exit rules, risk per trade, daily and weekly loss limits, position sizing method, journal fields, review day and a rule for when the plan may change. CME Group's version groups these into an objective, a methodology, risk management, trading strategies and a trader log.
How long should a trading plan be?
A trading plan should be short enough to read before every session, usually one page. Length matters less than precision: every line should name a number, a direction or a time, so it cannot be reinterpreted under pressure.
How often should a trading plan be reviewed?
Review the journal against the trading plan on a fixed weekly day, but change testable settings such as stops and targets only after a trade count you set in advance, often 100 trades or more. Reading results weekly is useful. Editing settings weekly fits the plan to noise.
What is the 90-90-90 rule for traders?
The 90-90-90 rule is a popular saying that ninety percent of new traders lose ninety percent of their money within ninety days. It is folklore, not a statistic published by any exchange or regulator. The research that does exist is still sobering: Barber, Lee, Liu and Odean's study of Taiwan day traders from 1992 to 2006 found that less than 1% of the day-trading population predictably earned profits.
Can I make $100 a day day trading?
Some days you might, and many days you will not, because daily results swing far more than any average. On one Micro E-mini S&P 500 contract, $100 is a 20-point move. A better plan goal is an average result per trade over 100 or more trades, since a daily dollar target pushes you to force trades on days your setup never appears.
Should you change your plan after a losing streak?
Not because of the streak alone. Losing runs are normal, and a breakout rule tested on twenty years of ES daily bars kept a positive average while still losing 15 trades in a row. If the streak pushes you toward a change, cut size or tighten the daily loss limit, and leave entry, stop and target settings until the journal has enough trades to judge them.
Your First Week With a Testable Trading Plan
Start your trading plan by writing the fixed commitments in one sitting this week: markets, trading window, risk per trade, daily and weekly stop, maximum positions, review day and the rule for when settings may change. It will feel plain. Plain is fine, because these lines are supposed to stay put.
Then do the sizing arithmetic for your own market. Take your balance, your risk percentage, the point value and the stop distance your setup uses, and write the whole number of contracts at a narrow stop, a typical stop and a wide stop. If the wide-stop answer is zero, write zero and mean it.
Finally, count the trades in your journal. If the count is below the number your change rule sets, freeze the testable settings and date them. For the next stretch, the job is collecting clean trades under one version of the plan, not improving it.
Trading futures involves substantial risk of loss, and because futures are leveraged, losses can exceed what you expect or deposit. The study in this guide describes one rule on one historical price series; it is an illustration, not a prediction, a performance record or a recommendation. Prop firm evaluation and funded accounts are simulated, and their rules differ from a live brokerage account. This guide is educational and is not individual investment, financial, legal or tax advice.


