




TL;DR: Kelly criterion for trading sets risk per trade at the share of equity that maximizes long-run growth for your win rate and payoff. On 222 historical ES and NQ breakout trades, the two textbook Kelly forms gave 3.88% and 2.24% of equity per trade. At those sizes the worst drawdowns ran from 59% to 79%. Treat Kelly as a ceiling, size at half or less, and check the answer against whole contracts and your drawdown limit.
The Kelly criterion answers one narrow question: if a trade has a real, repeatable edge, how much of the account should ride on it so the account compounds as fast as possible over many trades? It does not tell you whether the edge is real. That second question turns out to be the hard one, and it is where most Kelly mistakes start: a strong month goes into the formula, the formula prints a big number, and the big number feels like permission.
This guide works through the formula, then runs it on a real record of 222 breakout trades on E-mini S&P 500 and E-mini Nasdaq-100 futures. The record shows what textbook examples hide: the two common Kelly formulas disagree, the inputs are shakier than they look, and full Kelly produces drawdowns very few traders would sit through.
What the Kelly Criterion Computes
The Kelly criterion is a sizing rule. It returns the fraction of current capital to commit to a bet so that the expected logarithm of wealth, and therefore the long-run compound growth rate, is as high as it can be.
It comes from John L. Kelly Jr.'s 1956 paper "A New Interpretation of Information Rate" in the Bell System Technical Journal (volume 35). Kelly was working on information theory at Bell Labs. He showed that a gambler with an edge on a repeated bet grows capital fastest by betting a fixed fraction of current wealth, and that the maximum growth rate is tied to the information the gambler has.
Three things follow for a trader:
- Kelly sizes the bet, not the setup. It assumes the edge exists. Feed it a strategy with no edge and it will still print a number.
- Kelly maximizes growth, not comfort. The growth-optimal fraction comes with deep drawdowns, and that is a feature of the math, not a bug in your spreadsheet.
- Bigger is not better past the optimum. Betting more than the Kelly fraction lowers long-run growth even when every trade still has a positive average. Push far enough past it and the account shrinks while the edge is still there.
That last point surprises people. A trade with positive expectancy can still lose money over time if you size it too large, because a 50% loss needs a 100% gain to recover. Compounding punishes losses more than it rewards gains of the same size, and Kelly finds the size where that penalty is balanced against the edge.
Related lesson: Trading expectancy
The Kelly Formula and How to Calculate It

The Kelly formula in its original betting form is f* = (bp - q) / b, where b is the net odds received on a win, p is the probability of winning and q is the probability of losing (1 - p).
Traders usually rewrite it with trading inputs:
- W = win rate, the share of trades that make money.
- R = win/loss ratio, the average winning trade divided by the average losing trade.
- Kelly % = W - (1 - W) / R
The result is the fraction of equity to risk on the trade, meaning the amount you lose if the stop is hit. It is not the size of the position.
Worked Kelly examples by hand
The Kelly formula is short enough to check on a phone. Each row below uses the trader form W - (1 - W) / R.
| Win rate | Win/loss ratio | Kelly fraction | What the Kelly answer says |
|---|---|---|---|
| 40% | 2 to 1 | 10% | Risk 10% of equity per trade at full Kelly |
| 50% | 1.5 to 1 | 16.67% | A large answer from modest-looking inputs |
| 60% | 2 to 1 | 40% | Far too large to trade in practice |
| 33.33% | 2 to 1 | 0% | Break-even, no edge to size |
| 25% | 2 to 1 | -12.5% | Negative edge, do not take the trade |
The 40% and 2 to 1 row is the classic example: 0.40 minus 0.60 divided by 2 equals 0.10. On a $50,000 account that is $5,000 at risk on one trade, which already shows why practitioners rarely run full Kelly.
The continuous Kelly form for trade results
A trading record is not a set of identical bets. Winners come in many sizes and a few losers are larger than planned. The continuous form handles that by using the whole distribution: Kelly % = mean result / variance of results, with each trade measured in the same unit (usually R, the planned risk).
This mean-over-variance version comes from a Gaussian approximation of log growth. It is the form quant traders tend to use, and it often gives a smaller answer than the trader form on skewed records.
What a Kelly fraction means on a futures trade
On a futures contract, a Kelly fraction is the share of equity you lose if the stop fills, not the share of equity tied up in the position. An E-mini S&P 500 contract is $50 per index point. At an illustrative price of 7,000, one contract controls $350,000 of notional value, but a 30-point stop risks $1,500, about 0.43% of notional.
So a Kelly answer of 2.24% on a $50,000 account means about $1,120 of risk per trade. How many contracts that buys depends on the stop distance, not on the price of the index.
Estimating the Win Rate for a Kelly Calculation
The win rate is the share of closed trades that finished above zero. It is the easiest Kelly input to measure and the easiest to overtrust, because it is an estimate from a sample, and samples wobble.
The standard error of a measured win rate is the square root of W x (1 - W) / n, where n is the number of trades. At a win rate of 26.13%, the standard error shrinks slowly as the record grows:
| Trades in the record | One standard error on the win rate | Win-rate range at plus or minus one standard error |
|---|---|---|
| 30 | 8.02 points | 18.11% to 34.15% |
| 50 | 6.21 points | 19.92% to 32.34% |
| 100 | 4.39 points | 21.74% to 30.52% |
| 222 | 2.95 points | 23.18% to 29.08% |
| 500 | 1.96 points | 24.17% to 28.09% |
| 1,000 | 1.39 points | 24.74% to 27.52% |
Even a thousand trades leaves a band of almost three points. That matters because the Kelly formula is sensitive to the win rate when the win/loss ratio is large. Most discretionary traders log a few hundred trades a year at most, so for them the honest Kelly input is a range, not a number.
A few rules make the win-rate estimate more honest:
- Use closed trades from one rule. Mixing setups gives you an average of strategies you will not trade in that mix.
- Decide what a scratch counts as before you count. A break-even exit after costs is a loss for Kelly purposes, because it adds no growth and still costs commission.
- Use the same market conditions you plan to trade. A win rate measured only in a strong trend is not the win rate of the next range.
- Report the sample size next to the win rate. "60% on 20 trades" and "60% on 500 trades" are different claims.
Measuring the Win/Loss Ratio in R for Kelly
The win/loss ratio is the average winning trade divided by the average losing trade, in the same unit. For Kelly sizing, the cleanest unit is R, the distance from entry to the planned stop. A trade that hits its stop is -1R. A winner that travels three stop-widths is +3R.
R matters because the Kelly answer is a fraction of equity at risk. If the loss side of the ratio is measured as the stop distance, the output translates directly into "risk this share of equity to the stop." Mixing units breaks that link. A ratio built from dollar results on varying position sizes, or from percentage moves of the underlying, gives a Kelly number that is neither a risk fraction nor a position size.
In the 222-trade breakout study on ES and NQ daily bars (2006 to 2026), the average winner was 3.27R and the average loser 0.99R, a win/loss ratio of 3.32. The median winner was only 2.35R. The average is pulled up by a few large trends, with a largest single winner of 10.56R.
That concentration is the payoff-ratio trap. The ten largest winners in the study added 81.81R. The whole record made +28.17R. Without those ten trades it would have lost 53.64R. A win/loss ratio that leans on a handful of outliers will swing hard as the record grows or shrinks, and the Kelly answer swings with it.
Practical checks for the payoff side of Kelly:
- Measure every trade in R from the stop you actually placed, not from where price went.
- Compare the mean winner to the median winner. A large gap means a few trades carry the ratio.
- Recompute the ratio without the top five or ten winners. If the edge disappears, so does the case for sizing near Kelly.
- Include costs. Commission and slippage come off every winner and add to every loser.
How the 222-Trade Kelly Study Was Built
The 222-trade Kelly study is a historical, mechanical test on daily futures data, built so the Kelly inputs come from one fixed rule rather than from a hand-picked set of examples.
- Data. Front-month continuous daily bars for E-mini S&P 500 (ES) and E-mini Nasdaq-100 (NQ) from Yahoo Finance, September 20, 2006 to September 16, 2026, 5,030 usable sessions per product.
- Entry. Go long when the daily close is above the highest high of the previous 55 sessions, or short when it is below the lowest low. The entry price is that close.
- Stop. One average true range away from entry, using Wilder's 20-session ATR. That distance is 1R.
- Exit. At the stop; otherwise at a daily close beyond the opposite 20-session channel; otherwise after 250 sessions. If a bar touches the stop and the channel on the same day, the trade counts as stopped. If price gaps through the stop, the fill is the open.
- One trade at a time per product, no re-entry on the exit bar, results pooled across both products in entry-date order.
The study produced 222 closed trades: 116 on ES and 106 on NQ, 142 long and 80 short, from December 2006 to August 2026. 159 ended at the stop (156 at exactly -1R and 3 slightly worse after gaps, the worst at -1.20R), 63 ended at the channel exit and none reached the 250-session limit.
The limits are worth stating plainly. The study ignores commissions and slippage outside gap fills, uses continuous contract data rather than individual contract months, and treats each trade as if it were sized on equity after the previous trade closed, even though ES and NQ trades often ran at the same time. It is a worked example on real prices for learning how Kelly behaves, not evidence that this breakout rule should be traded.
Kelly Criterion for Trading on 222 Measured Trades
Run on the 222-trade breakout study, the Kelly inputs are a 26.13% win rate (58 winners, 164 losers) and a win/loss ratio of 3.32. The average result was 0.127R per trade with a standard deviation of 2.38R.
Three ways of computing Kelly give three answers on the same trades:
| Kelly form | Inputs used | Fraction of equity risked per trade |
|---|---|---|
| Binary (trader) form | Win rate 26.13%, win/loss ratio 3.32 | 3.88% |
| Mean over variance | Mean 0.127R, variance 5.66 | 2.24% |
| Exact growth optimum | Search of all 222 results for the highest average log growth | 2.57% |
The binary form asks for 1.73 times as much risk as the mean-over-variance form. The exact optimum, found by testing fractions directly on the 222 results, lands between them and closer to the smaller answer.
The reason is the shape of the record. The binary form assumes every win is the same size and every loss is the same size. This record has many -1R stops and a long tail of large winners: a skew of 2.42 and excess kurtosis of 5.22. Averaging that tail into one win/loss ratio overstates how reliably the big winners arrive, so the binary form oversizes.
Before trusting any of the three numbers, look at the edge underneath them. An average of 0.127R with a 2.38R standard deviation over 222 trades gives a t statistic of 0.79. The 95% interval for the true average runs from -0.19R to +0.44R. In plain terms, the record cannot rule out zero edge. The products disagreed too: ES averaged -0.06R per trade and NQ +0.33R.
That is a normal situation for a real trading record, and it is the situation Kelly handles worst. The formula takes the inputs as known. A trader has to remember they are not, and size as if the smaller answers might be the true ones.
How Far the Kelly Fraction Moves With Its Inputs
The Kelly fraction is only as stable as the win rate and payoff fed into it, and on a real trading record both inputs move more than the gap between the formulas. In the 222-trade breakout study the binary Kelly answer is 3.88%, and small, realistic input errors move it a long way:
| Input change | Win rate used | Win/loss ratio used | Binary Kelly answer |
|---|---|---|---|
| Measured inputs | 26.13% | 3.32 | 3.88% |
| Win rate one standard error lower | 23.18% | 3.32 | 0.04% |
| Win rate one standard error higher | 29.08% | 3.32 | 7.72% |
| Win rate two standard errors lower | 20.23% | 3.32 | -3.80% |
| Win/loss ratio 20% lower | 26.13% | 2.656 | -1.68% |
| Win/loss ratio 20% higher | 26.13% | 3.984 | 7.59% |
One standard error on the win rate, which is ordinary sampling noise, spans a Kelly answer from almost nothing to 7.72%. A win/loss ratio 20% lower than measured flips the answer negative, which is the formula saying the edge is gone.
Resampling the Kelly inputs
Resampling gives a fuller view of Kelly uncertainty. Drawing 222 trades with replacement from the study's own results, 5,000 times, produced these binary Kelly answers: a 5th percentile of -4.49%, a median of 3.71% and a 95th percentile of 10.89%. In 22.16% of the resamples the answer was zero or negative. In 17.82% it was more than twice the point estimate.
So the same record supports "do not trade this" about one time in five and "risk over 7.76% per trade" about one time in six. Nothing about the market changed between those draws, only which trades happened to land in the sample. If your sizing plan would flip between "stand aside" and "size up" on a reshuffle of your own history, the plan is reading noise.
Kelly answers from short trade records
Short records make Kelly far worse. Computing the binary Kelly answer on the first trades of the 222-trade study, in the order they happened:
| Trades measured | Win rate | Win/loss ratio | Kelly answer |
|---|---|---|---|
| First 25 | 28.00% | 1.51 | -19.68% |
| First 50 | 30.00% | 3.58 | 10.44% |
| First 75 | 32.00% | 3.31 | 11.46% |
| First 100 | 28.00% | 3.26 | 5.93% |
| First 150 | 25.33% | 3.53 | 4.20% |
| All 222 | 26.13% | 3.32 | 3.88% |
After 25 trades the rule looked broken. After 75 it looked good enough to risk over 11% per trade. Neither reading was the one 222 trades gave, and the later number is still an estimate. Splitting the record into its two halves of 111 trades gave closer answers (3.43% for 2006 to 2016 entries and 4.25% for 2016 to 2026 entries), which is about what a longer sample buys you: less noise, not certainty.
Related lesson: Risk of ruin
Kelly Assumptions That Trading Records Break
The Kelly criterion rests on assumptions that hold for a casino game with known odds and fail in different ways on a trading record. Knowing which ones break tells you which way your Kelly answer is likely to be wrong.
- The probabilities are known. Kelly's derivation treats p and the payoff as facts. A trader only has estimates, and the Kelly answer moves a lot inside their error bands. Estimation error makes the true optimal fraction smaller than the measured one, because sizing above the real optimum costs more growth than sizing the same distance below it.
- Outcomes are independent. Trades in the same market regime cluster. The 222-trade study had a longest losing run of 18 trades, and losing runs on trend rules tend to bunch in choppy years.
- Conditions are stable. The edge that produced the win rate has to persist. Markets change volatility, structure and participants, and a rule's win rate drifts with them.
- Payoffs are fixed. The binary form assumes every win and every loss has one size. Real results have fat tails and occasional gap losses beyond the stop.
- Bets happen one at a time. Kelly sizes each bet on the wealth left after the previous one settles. Traders often hold several positions at once.
Correlated trades and the Kelly fraction
The one-bet-at-a-time assumption fails hardest on correlated positions, and ES and NQ show it clearly. Over the 222-trade study window, the daily returns of the two contracts had a correlation of 0.92. 94 of the 116 ES trades were open at the same time as an NQ trade, and 106 of the 111 overlapping pairs pointed the same direction.
Sizing each of those trades at a 2.24% Kelly fraction puts 4.48% of equity at risk on what is close to a single bet. The portfolio version of Kelly accounts for this through the covariance between positions, which in practice means the combined risk of correlated trades should stay near the single-trade Kelly figure, not double it. If you trade several strategies or several highly correlated markets, apply the Kelly limit to the total open risk, not to each position separately.
Why Full Kelly Is Too Volatile for Most Traders
Full Kelly maximizes long-run growth, and the price of that growth is drawdown. Running the 222-trade breakout study at each Kelly answer, compounding on current equity in entry order, gives these worst peak-to-trough declines:
- Binary Kelly, 3.88% per trade: worst drawdown 79.32%.
- Exact growth optimum, 2.57% per trade: worst drawdown 64.08%.
- Mean-over-variance Kelly, 2.24% per trade: worst drawdown 58.87%.
- Twice that Kelly, 4.48% per trade: worst drawdown 84.06%.
Even the "best" fraction on this record lost almost two-thirds of the account at its low point. And past the optimum the account gets worse on every count: from 5.36% per trade upward, the record ended below its starting balance despite a positive average trade.
This is the overbetting cliff. Underbetting costs you some growth. Overbetting costs you growth and adds drawdown. Since the true Kelly fraction is never known exactly, a trader aiming at full Kelly will overshoot about half the time.
A ten-trade Kelly path on $25,000
The first ten trades of the 222-trade study show what Kelly sizing feels like in dollars. They started with seven straight losses, then a +0.96R and a +3.57R winner, then another loss. Here is the same ten-trade sequence on a $25,000 account at four fractions:
| After trade | Trade result | Equity at 3.88% | Equity at 2.24% | Equity at 1.12% | Equity at 1% |
|---|---|---|---|---|---|
| 1 | -1R | $24,030 | $24,440 | $24,720 | $24,750 |
| 3 | -1R | $22,203 | $23,357 | $24,169 | $24,257 |
| 7 | -1R | $18,953 | $21,332 | $23,104 | $23,302 |
| 9 | +3.57R | $22,380 | $23,534 | $24,286 | $24,365 |
| 10 | -1R | $21,512 | $23,006 | $24,014 | $24,121 |
Seven straight losses at 3.88% took the account down 24.19%, from $25,000 to $18,953. At 1.12% the same seven losses cost 7.58%. The trades were identical. Only the fraction decided whether the start of the record was a rough month or a crisis.
That is the part a formula leaves out. The trader at 3.88% has to keep taking the eighth signal after losing almost a quarter of the account. Many will skip it, change the rule or size up to win it back, and the real-world result then has nothing to do with Kelly.
Related lesson: Maximum drawdown
Fractional Kelly and the Half Kelly Tradeoff
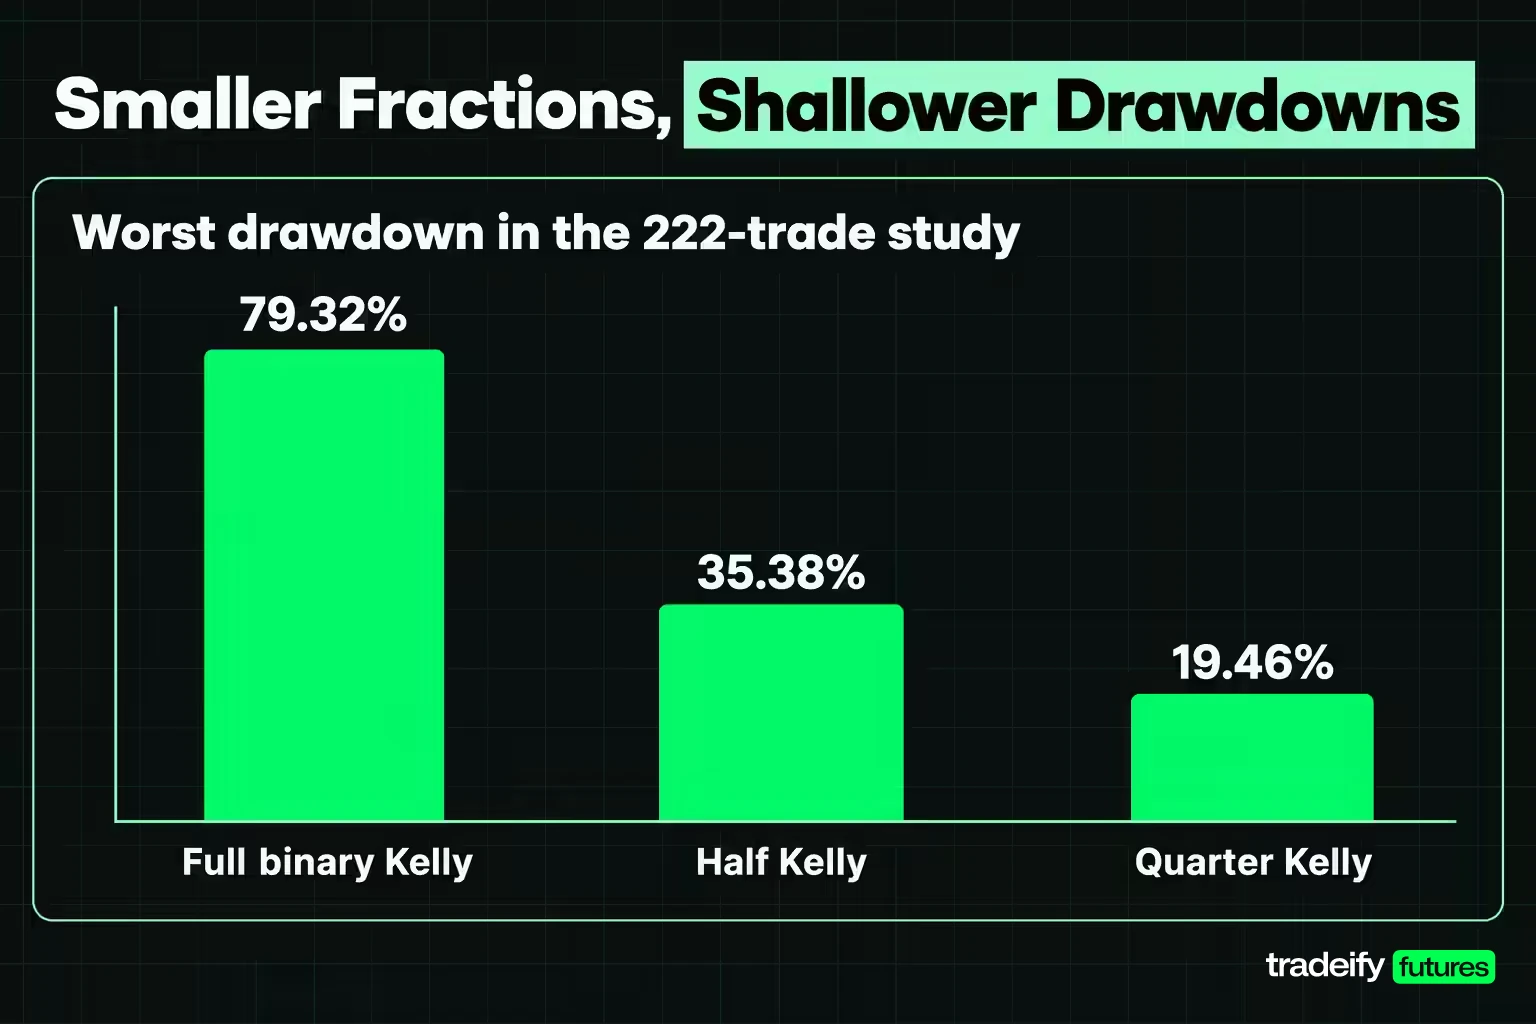
Fractional Kelly means risking a set share of the Kelly answer, most often half or a quarter. It is the standard practical response to Kelly's drawdowns and to the uncertainty in its inputs.
The math explains why half Kelly is popular. In the Gaussian approximation, growth at c times the Kelly fraction is (2c - c²) of the maximum. Half Kelly keeps 75% of the best growth rate. Quarter Kelly keeps 43.75%. Drawdowns shrink much faster than growth does, roughly in proportion to the fraction itself.
The 222-trade breakout study follows the same pattern:
| Sizing choice | Risk per trade | Ending multiple | Worst drawdown | Share of best growth rate |
|---|---|---|---|---|
| Binary Kelly | 3.88% | 1.30x | 79.32% | 77.05% |
| Exact growth optimum | 2.57% | 1.41x | 64.08% | 100% |
| Mean-over-variance Kelly | 2.24% | 1.41x | 58.87% | 98.49% |
| Half Kelly | 1.12% | 1.27x | 35.38% | 69.45% |
| Quarter Kelly | 0.56% | 1.15x | 19.46% | 40.09% |
Half of the mean-over-variance Kelly kept 69.45% of the best growth rate while cutting the worst drawdown from 58.87% to 35.38%. Quarter Kelly kept 40.09% of the growth with a worst drawdown of 19.46%.
Notice the binary Kelly row. It risked more than the optimum and got less growth, 77.05% of the best rate, with the deepest drawdown. Oversizing is never a trade of risk for return past the peak. It is only risk.
Choosing a Kelly fraction on purpose
The fraction of Kelly you pick should come from two things: how much you trust the inputs and how much drawdown you can actually execute through.
- A short or noisy record argues for a quarter Kelly or less, because the true optimum may be far below the measured one.
- A long, stable record with an edge that clears statistical noise can justify something nearer half Kelly.
- A hard drawdown limit overrides both. If the account cannot survive a 35% decline, half Kelly on this record is still too large.
Kelly vs Fixed Percentage Position Sizing
Fixed percentage sizing risks the same share of equity on every trade, usually 1% or 2%, without estimating the edge at all. Kelly sizing derives the share from the edge. Both are fixed-fraction methods once the number is chosen; the difference is where the number comes from.
On the 222-trade breakout study:
- 1% per trade: ending multiple 1.25x, worst drawdown 32.24%, 64.00% of the best growth rate.
- 2% per trade: ending multiple 1.39x, worst drawdown 54.64%, 95.42% of the best growth rate.
- Half Kelly (1.12%): ending multiple 1.27x, worst drawdown 35.38%, 69.45% of the best growth rate.
On this record a 1% rule landed close to half Kelly, and a 2% rule landed close to full Kelly. That is a coincidence of this sample, not a general law. On a record with a bigger edge, 2% would be conservative. On a record with no edge, any positive fraction loses.
Fixed percentage rules survive because they do not depend on a fragile estimate. Kelly is useful next to them as a check: if your fixed percentage is above the Kelly answer for your own record, you are oversizing by your own numbers. If it is far below a Kelly answer you trust, you may be giving up growth, though most traders are better served by giving it up.
Related lesson: Fixed fractional position sizing
Turning a Kelly Fraction Into Futures Contracts
A Kelly fraction is a continuous number, but futures trade in whole contracts. The step from "2.24% of equity" to an actual order often changes the answer more than the choice of Kelly formula does.
In the 222-trade breakout study, the median risk to the stop was $1,482.60 per full-size contract (ES at $50 per point, NQ at $20 per point) and $148.26 per micro contract. Risk per contract ranged from $677.68 at the 5th percentile to $7,673.56 at the 95th, because the ATR stop widened in volatile years.
Converting Kelly budgets into whole contracts at the median stop:
| Account size | Kelly 2.24% budget | Contracts at Kelly 2.24% | Half Kelly budget | Contracts at half Kelly |
|---|---|---|---|---|
| $25,000 | $560 | 0 full or 3 micros | $280 | 0 full or 1 micro |
| $50,000 | $1,120 | 0 full or 7 micros | $560 | 0 full or 3 micros |
| $100,000 | $2,240 | 1 full or 15 micros | $1,120 | 0 full or 7 micros |
| $150,000 | $3,360 | 2 full or 22 micros | $1,680 | 1 full or 11 micros |
The 2.24% Kelly fraction needed a $66,188 account to buy one full-size contract at the median stop. Below that, the choice is micros or skipping the trade. Above it, rounding down to whole contracts quietly cuts the real fraction, and rounding up quietly raises it.
The temptation on a small account is to round up to one full contract because the trade "deserves" it. The rule is simple: always round down, and recompute the real risk after rounding. The fraction you trade is the contract count times the stop in dollars, divided by equity, not the number the formula printed.
Related lesson: Mini and micro futures contracts
Zero, Negative and Oversized Kelly Results
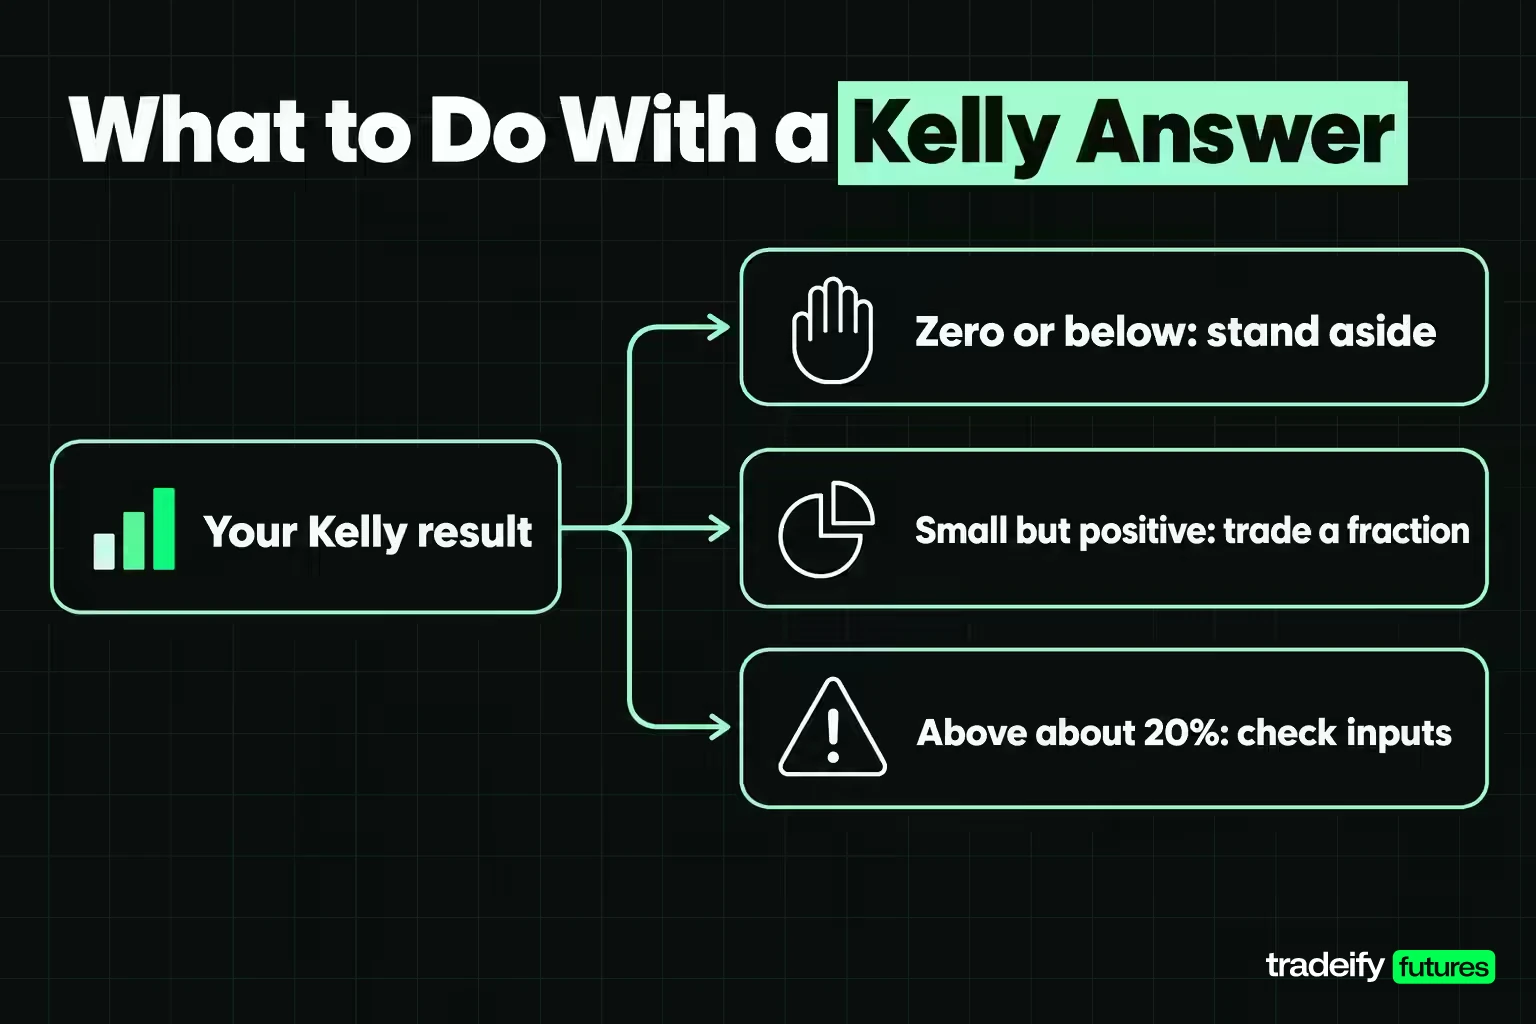
Kelly can return three kinds of results that need a decision rather than a position size: zero, a negative number, or a number too large to trade.
A Kelly result of zero means the measured edge is exactly break-even. With a 2 to 1 win/loss ratio, that happens at a 33.33% win rate. There is nothing to size, and costs will turn a zero edge negative.
A negative Kelly result means the measured expectancy is below zero. In betting terms it says take the other side. In trading terms it says do not take the trade with this rule. The first 25 trades of the 222-trade breakout study returned -19.68%. Do not clip a negative Kelly to zero and keep trading at a minimum size. Treat it as a signal to stop and investigate: a short sample, a broken rule or a changed market.
An oversized Kelly result is any answer above roughly 20% to 25% of equity at risk per trade. A 60% win rate with a 2 to 1 ratio returns 40%. Results like that almost always mean the inputs are wrong: too few trades, a backtest fitted to its own data, costs left out, or a win/loss ratio held up by a few outliers. A large Kelly number should raise your suspicion of the inputs, not your size.
A practical response to all three:
- Below zero or at zero: stand aside and re-measure.
- Small but positive: trade a fraction of it, and only if the sample is large.
- Above about 20%: assume an input error, cap the fraction at your normal fixed percentage, and test the inputs out of sample.
Kelly Risk Guardrails for a Trading Account
Kelly risk guardrails turn a growth formula into a sizing rule an account can live with. The formula optimizes growth with no regard for drawdown limits, losing streaks or the trader's tolerance, so the guardrails have to supply those.
Size Kelly from a drawdown limit
If the account has a maximum drawdown it may not cross, size from that limit first and use Kelly only as a ceiling. On the 222-trade breakout study, the largest fractions that kept the worst drawdown under each limit were:
| Worst drawdown allowed | Largest fraction per trade | Share of best growth rate |
|---|---|---|
| 20% | 0.57% | 40.69% |
| 10% | 0.27% | 20.70% |
| 5% | 0.13% | 10.29% |
A 10% drawdown limit allowed about one-eighth of the Kelly fraction on this record. That is the honest shape of the choice for a trader whose account has a hard loss limit: growth is no longer the goal; staying inside the limit is.
Kelly guardrails for caps, correlation and reviews
- A hard cap. Never risk more than a set percentage per trade (many traders use 1% to 2%), whatever Kelly says.
- A total open-risk cap. Correlated positions share one Kelly budget, so cap total risk across ES and NQ, or across strategies, at the single-trade figure.
- A minimum sample. No Kelly-based size until the rule has a few hundred trades behind it, with the standard error written next to the win rate.
- A fixed review block. Hold the fraction for a set number of trades, then re-measure. Resizing after every good or bad week turns sampling noise into position size.
- A drawdown step-down. Cut the fraction by a set amount when the account is a set distance below its peak, and restore it only by rule.
Kelly sizing on a drawdown-limited account
A trailing or fixed drawdown limit changes what Kelly's "fraction of equity" means. On an account that fails at a set dollar loss, the capital that matters is the room left before the limit, not the nominal balance. A fraction sized on the nominal balance can spend that room in a few trades.
On our accounts, size is capped by contract limits rather than margin: a 50K account can hold up to 4 minis or 40 micros. A 50K Growth funded account has a $2,000 end-of-day trailing drawdown, which is 4% of the starting balance, so a full-Kelly fraction of the nominal $50,000 would put most of that room on one or two trades. Positions are closed by 4:45 PM ET with no overnight holds, so the multi-week trades in this study are not something our accounts allow. Funded accounts are simulated.
Putting the Kelly Criterion Into a Trading Plan
Putting the Kelly criterion into a trading plan works best as a fixed procedure, written down before the numbers come back, so you are not choosing the formula that gives the answer you hoped for.
- Collect one rule's closed trades in R. Use the stop you actually placed as 1R, include costs, and keep one setup per record.
- State the sample. Write the trade count, date range and market next to every number.
- Compute all three Kelly answers. Binary form, mean over variance and an exact search for the highest average log growth. A wide spread between them is information about the inputs.
- Price the input error. Recompute Kelly at the win rate plus and minus one standard error and at a win/loss ratio 20% lower. If any version is near zero or negative, the edge is not established.
- Pick a fraction of Kelly. Start at a quarter, or at half if the record is long and the edge clears noise, and take the smallest answer from the previous steps as the base.
- Apply the drawdown limit. Run the chosen fraction through the record and check the worst drawdown. Cut until it fits inside what the account and you can take.
- Convert to whole contracts. Divide the risk budget by the dollar stop, round down, and recompute the actual fraction.
- Hold and re-measure on a schedule. Keep the fraction fixed for a block of trades, such as 50, then repeat from step 1.
Related lesson: Position sizing
Common Kelly Criterion Mistakes
The common Kelly criterion mistakes come from treating an estimate as a fact or treating a growth formula as a risk plan.
- Using optimistic inputs. A backtest win rate tuned on the same data, a recent hot streak, or results without costs all inflate Kelly. Inflated inputs push you past the optimum, where growth falls and drawdowns rise.
- Treating full Kelly as the target. Full Kelly is the upper edge of sensible sizing. On the 222-trade breakout study, the growth-optimal fraction still had a 64.08% drawdown.
- Trusting a short record. The first 25 trades of that study gave -19.68%; the first 75 gave 11.46%. A short sample produces a confident number either way.
- Ignoring a zero or negative result. A negative Kelly is a stop sign for the rule, not a reason to trade at minimum size.
- Sizing correlated trades separately. Two same-direction positions in ES and NQ are close to one bet. Give them one Kelly budget.
- Mixing units. A win/loss ratio in dollars with losses measured as a percentage of the account gives a number that means nothing.
- Resizing after streaks. Raising the fraction after wins and cutting it after losses feeds sampling noise straight into size.
- Forgetting contract rounding. The traded fraction is the contracts you can actually buy, not the decimal the formula returned.
Kelly Sizing Across Futures, Stocks, Options and Crypto
Kelly sizing works the same way mathematically in every market, but each asset class changes what the "loss" in the formula means.
| Asset class | What the Kelly fraction means | Main complication |
|---|---|---|
| Futures | Equity lost if the stop fills | Whole contracts, gap risk past the stop, high notional per contract |
| Stocks | Equity lost to the stop on a share position | Overnight gaps and earnings moves can far exceed the stop |
| Options (long) | Premium paid, which can be lost in full | Payoffs are non-linear, so win rate and ratio change with strike and time |
| Forex and crypto | Equity lost to the stop at the chosen leverage | Leverage and around-the-clock gaps can push losses past the stop |
| Systematic strategies | Risk budget per signal or per strategy | Correlation across strategies and overfitted backtest inputs |
For futures, the fraction applies to risk, and contract granularity often decides the real size, as the ES and NQ contract math shows. Gaps past a stop make the true loss slightly larger than 1R, which argues for sizing a little under the measured Kelly.
Kelly inputs for stocks, options, forex and crypto
For stocks, a position held overnight can gap well beyond its stop, so the loss side of the ratio needs the gap history, not just the planned stop.
For long options, the premium is the maximum loss, so the binary form fits better than it does on a stop-based trade. But the probability of profit depends on strike and time to expiry, so each structure needs its own inputs.
For forex and crypto, leverage is a separate setting from the Kelly fraction. Kelly says how much equity to lose at the stop; leverage only decides how much margin that position ties up. Treating high available leverage as a reason to size up is how traders end up past the overbetting cliff.
For systematic strategies, Kelly is often applied at the portfolio level using the covariance of strategy returns. The input-error problem gets worse, because every strategy's edge is an estimate and the correlations are estimates too.
Kelly Criterion for Trading FAQ
Is the Kelly criterion good for trading?
It is a good ceiling and a poor target. Kelly gives the fraction that maximizes long-run growth if your inputs are right. On 222 historical ES and NQ trades, its answers of 2.24% to 3.88% per trade came with worst drawdowns of 59% to 79%, so most traders use a fraction of it.
What are the limitations of the Kelly criterion?
The inputs are estimates, so the true optimum is uncertain. On 222 trades, one standard error on the win rate moved the Kelly answer from 0.04% to 7.72%. The formula also assumes independent, one-at-a-time bets with stable odds, which trading records rarely provide.
Why do traders use half Kelly?
Half Kelly keeps about 75% of the maximum growth rate in theory while cutting drawdowns roughly in half. On the 222-trade study it kept 69.45% of the best growth with a worst drawdown of 35.38% instead of 58.87%. It also leaves room for an overestimated edge.
Is Kelly better than the 1% rule?
They answer different questions. The 1% rule caps risk without estimating the edge, while Kelly derives size from the edge. Many traders use a fixed rule like 1% and check that it stays below a conservative Kelly estimate for their own record.
What does a negative Kelly percentage mean?
A negative Kelly percentage means the measured expectancy is below zero, so the formula recommends no position. Treat it as a reason to stop trading the rule and investigate, not as a size to round up to the minimum.
How many trades do you need for a Kelly calculation?
A few hundred trades from one consistent rule is a sensible minimum before Kelly guides real size. At 100 trades the win-rate standard error is still about four points, enough to swing the Kelly answer from near zero to double the estimate.
This article is educational and is not trading, investment or financial advice. The 222-trade study is a historical, mechanical test of one rule on daily bars with simplified fills and no costs, and past results do not predict future results. Futures are leveraged, losses can exceed what you expect, and no sizing formula prevents large drawdowns. Results on simulated or evaluation accounts are simulated and are not the same as results on a live brokerage account.


