




TL;DR: Fixed fractional position sizing risks the same percentage of current equity on each trade, so the real decision is the fraction. On 224 rule-based ES and NQ trades from 2006 to 2026, 1% of equity meant a 32.35% worst drawdown and 2% meant 54.77%. Above about 2.75% the ending balance fell while the drawdown kept rising. One full-size contract on every trade, with no risk cap, took a $50,000 account below zero.
Picking a number for fixed fractional position sizing takes a second. Living with it through a 14-trade losing streak is the hard part, and most traders choose 1% or 2% without ever seeing what the difference costs.
This guide covers the method and the math, then runs one set of 224 historical trades through every fraction from 0.25% to 40%. Same trades, same start, one number changed. You can see the tradeoff instead of taking it on faith.
What Fixed Fractional Position Sizing Means
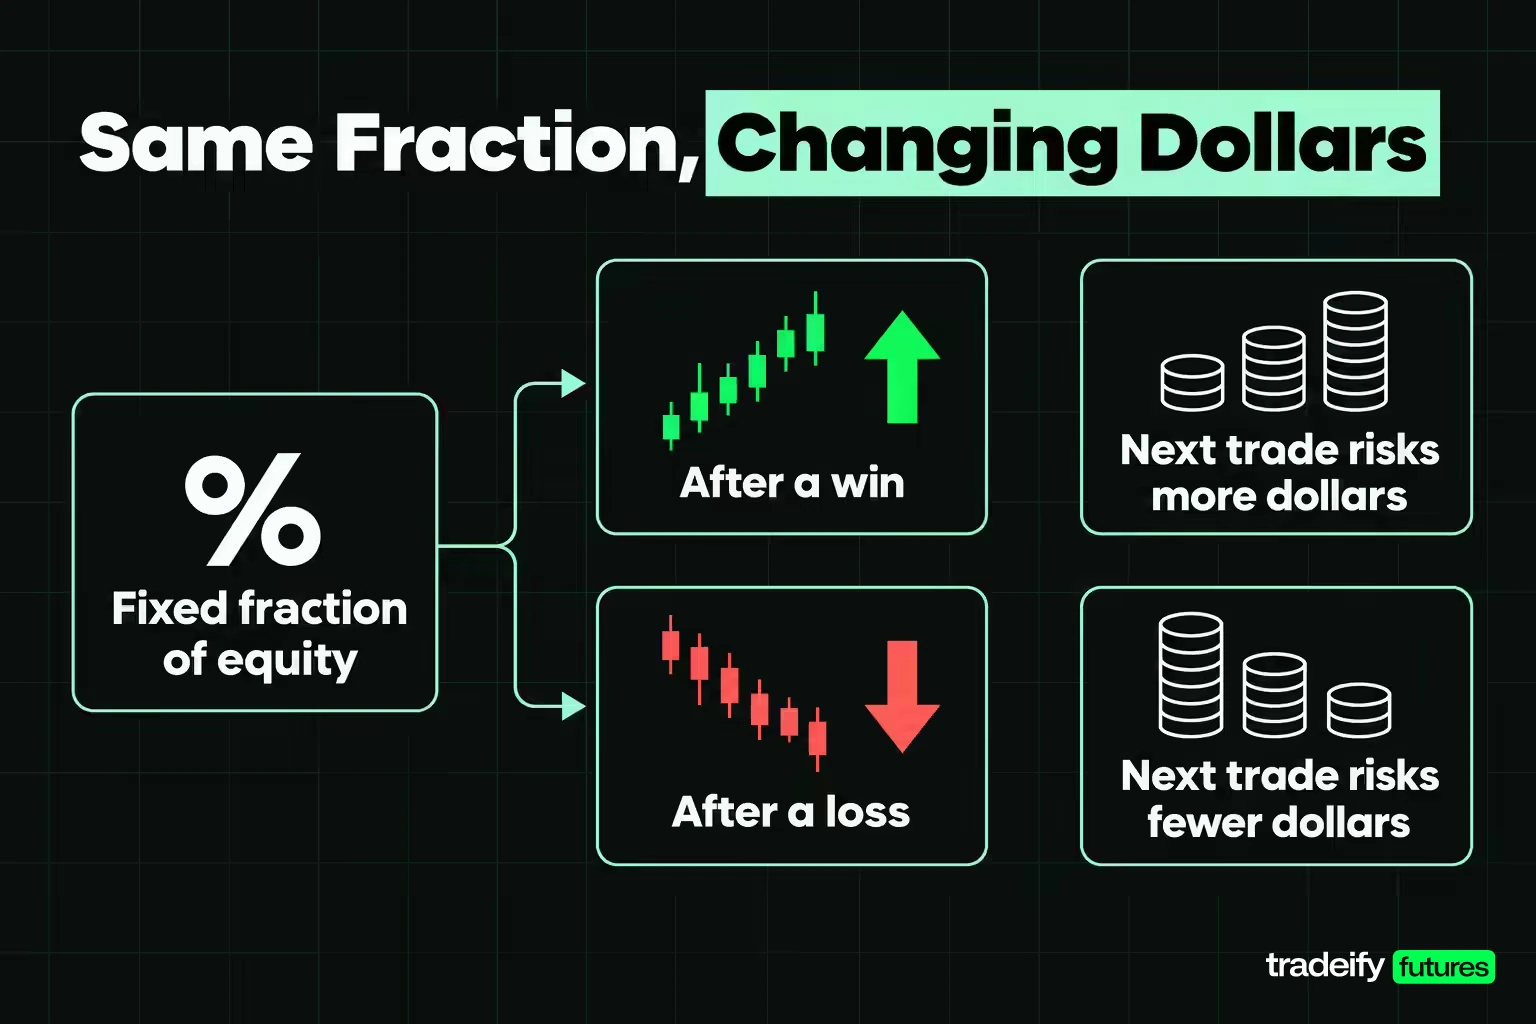
Fixed fractional position sizing sets the size of each trade from two inputs: a fixed fraction of current account equity, and the dollar loss per contract if the stop is hit. Divide the first by the second and you get the number of contracts. Your conviction, the chart pattern and how the last trade went do not enter the calculation.
The fraction is fixed. The dollars are not. After a loss the equity base is smaller, so the next trade risks fewer dollars. After a win it risks more. That feedback loop is what separates fixed fractional sizing from risking a flat $500 on every trade, and it is why the drawdown path looks different from what most traders expect.
Two points cause most of the confusion around fixed fractional position sizing:
- Risking 1% means losing 1% of equity if the stop fills. It does not mean putting 1% of the account into the position. The position size depends on how far away the stop is.
- "Fixed percentage" is sometimes used to mean committing a fixed share of capital to each position. Fixed fractional sizing fixes the risk, not the capital, so position size changes every time the stop distance changes.
Ralph Vince popularized the fractional approach in his work on portfolio mathematics and "optimal f", the fraction that maximizes compounded growth for a given trade history. Most traders now use a much smaller fraction than optimal f, for reasons the drawdown figures in this article make obvious.
Related lesson: Position sizing
Why Position Sizing Decides How Long an Account Survives
Position sizing decides whether a trading account survives long enough for its edge, if it has one, to show up. The entry rule decides which trades you take. The size decides how much each one can hurt.
The clearest example from the study in this article: the same 224 trades, the same $50,000 starting balance, two sizing rules. Holding one full-size E-mini contract on every trade, whatever the stop distance, took the account below zero on trade 154 and to a low of minus $59,374.60 on trade 189. Risking exactly 1% of equity on the same trades ended at $63,786.14 and never came close to zero.
Nothing about the trades changed. One rule sized against the risk of each trade and the other ignored it. That was the whole difference between a growing account and a dead one.
That is the core job of position sizing:
- Keep any single loss small enough that a normal losing streak cannot end the account.
- Keep the dollar risk consistent when stop distances and volatility change.
- Turn a measured edge into growth without turning ordinary bad luck into a drawdown you cannot sit through.
None of that creates an edge. Sizing multiplies whatever the trades carry, including a negative or zero edge.
The Math Behind Fixed Fractional Sizing
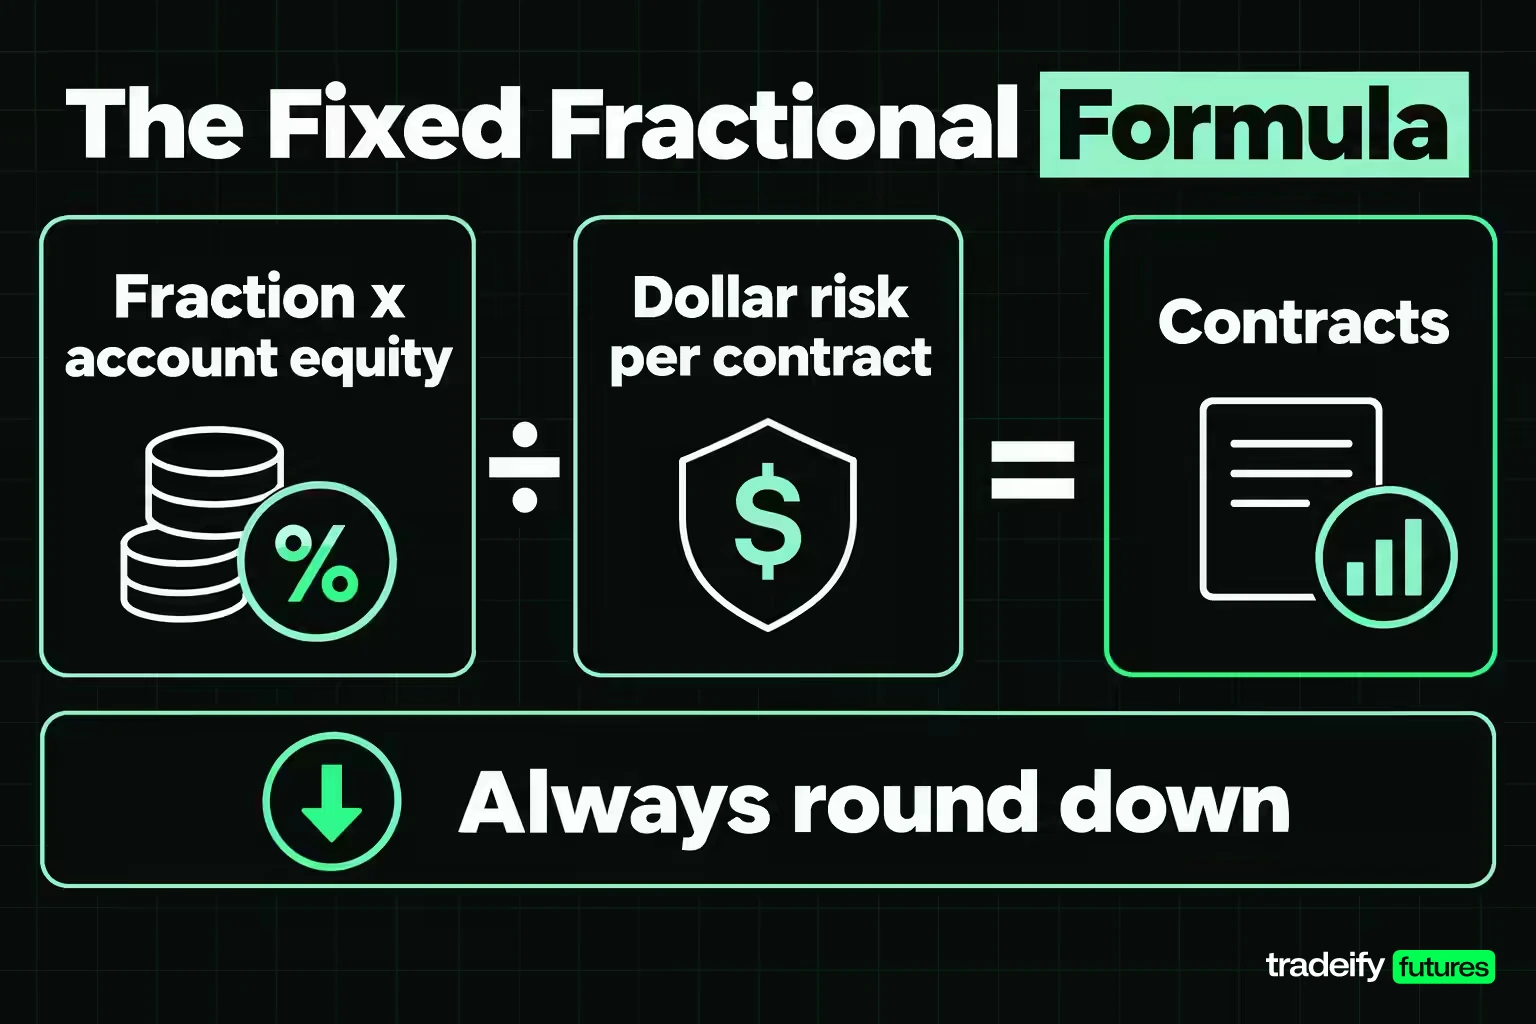
The fixed fractional formula is short:
Contracts = (fraction × account equity) ÷ dollar risk per contract
Dollar risk per contract is the stop distance in points multiplied by the contract's dollar value per point. For the E-mini S&P 500 (ES) that value is $50 per index point, and for the Micro E-mini S&P 500 (MES) it is $5. Always round down to a whole contract, because rounding up breaks the risk limit you just set.
Worked fixed fractional example on ES and MES
Take the first trade in the study below, an ES long entered on December 5, 2006 at 1,416.75 with a stop 11.1126 points away.
- Risk budget at 1% of a $50,000 account: $500.
- Risk on one ES contract: 11.1126 points × $50 = $555.63, which is more than $500. The fraction buys 0.90 of a contract, so the honest answer on ES is zero contracts.
- Risk on one MES contract: 11.1126 points × $5 = $55.56. $500 ÷ $55.56 = 8.999, rounded down to 8 contracts.
- Actual risk on 8 MES: $444.50, a little under the $500 budget, which is what rounding down should do.
That one example already shows the method's biggest practical problem. The fraction says what you may risk. The contract size decides whether you can actually take the trade.
Losing streaks under a fixed fraction
Because each loss shrinks the base, a fixed fraction never takes an account to zero on paper. It still takes it a long way down. This table is pure arithmetic: a run of full 1R losses in a row at each fraction.
| Fraction risked | 5 losses in a row | 10 losses in a row | 14 losses in a row | 20 losses in a row |
|---|---|---|---|---|
| 1% | 4.90% | 9.56% | 13.13% | 18.21% |
| 2% | 9.61% | 18.29% | 24.64% | 33.24% |
| 5% | 22.62% | 40.13% | 51.23% | 64.15% |
A 14-trade losing run is not exotic. The 224-trade sample below contains one.
The recovery math behind every drawdown
Losses and gains are not symmetric. Recovering from a drawdown needs a gain of 1 ÷ (1 − drawdown) − 1:
| Drawdown | Gain needed to get back to even |
|---|---|
| 10% | 11.11% |
| 20% | 25% |
| 25% | 33.33% |
| 50% | 100% |
| 75% | 300% |
That asymmetry is why the drawdown column matters more than the ending balance when you compare fractions.
How the 224-Trade Sizing Study Was Built
The sizing study uses one mechanical rule on daily bars so that every fraction is tested on exactly the same trades. It is an illustrative study of one rule over one window, not a strategy recommendation and not a forecast.
- Data: Yahoo Finance continuous front-month daily bars for the E-mini S&P 500 (ES=F) and E-mini Nasdaq-100 (NQ=F), September 18, 2006 to September 16, 2026. After dropping bars with a missing price, each product has 5,032 usable sessions. Continuous series are not roll-adjusted, so roll days can distort a bar.
- Entry: long when a session closes above the highest high of the previous 55 sessions, short when it closes below the lowest low. Entry at that close. One trade per product at a time.
- Stop: fixed at entry, one average true range (ATR) away, using a 20-session simple average of true range.
- Exits, in order: the stop if a later bar touches it; otherwise a close beyond the opposite 20-session channel; otherwise 250 sessions after entry.
- Measurement: results in R, where 1R is the stop distance. A stopped trade is −1R. Pooled trades are ordered by entry date, ES before NQ on the same day.
- Costs: none in the headline figures; slippage and commission are priced separately in R.
The rule produced 116 ES trades and 108 NQ trades, 224 in total. The first was entered on December 5, 2006 and the last on August 4, 2026.
These are multi-week holds on daily bars. The study measures sizing math, not an intraday method.
Related lesson: Trading expectancy
What the 224 Trades Showed Before Any Sizing
Before any fraction is applied, the 224 trades have their own profile, and it decides how much any sizing result can be trusted.
- Win rate: 25.89% (58 winners).
- Average result: 0.1371R per trade, a total of 30.72R.
- Standard deviation per trade: 2.4360R.
- Average winner: 3.33R. Average losing or flat trade: −0.98R.
- 159 of the 224 trades ended at the stop.
That is a typical trend-following shape: frequent small losses, occasional large winners.
Is the edge in the 224-trade sizing sample real?
Not provably. The t statistic is 0.84, and the 95% confidence interval for the average runs from −0.1819R to +0.4561R, which includes zero. At this standard deviation, roughly 1,212 trades would be needed for an edge of 0.1371R to clear zero at that confidence level. The 20-year window produced less than a fifth of that.
The products disagree too. ES lost 0.0533R per trade over 116 trades at a 24.14% win rate. NQ made 0.3416R per trade over 108 trades at 27.78%.
The winners are concentrated. The largest single winner was 12.26R, 6.35% of all winning R. The ten largest winners were 44.08% of it, and without those ten the sample goes from +30.72R to −54.38R.
A random-direction control for the 224 trades
A fixed fraction multiplies whatever edge is present, so it helps to compare the rule with a control. The control keeps every entry date and the same one-ATR stop and exit logic, but picks long or short by a hash of the date and session instead of the breakout. Five draws:
| Control draw | Average result per trade | Win rate |
|---|---|---|
| Draw 1 | −0.1043R | 16.07% |
| Draw 2 | +0.1272R | 21.43% |
| Draw 3 | −0.0706R | 16.07% |
| Draw 4 | −0.0582R | 16.07% |
| Draw 5 | −0.1060R | 16.07% |
The average of the five draws is −0.0424R, and the real rule's 0.1371R beats four of them. One random draw came within 0.01R of it. That frames every sizing result from these 224 trades: they show what a fraction does to a sequence, not proof that this particular breakout rule works.
Fixed Fractional Sizing Results From 0.25% to 40%
Hold the 224 trades fixed, in the order they happened, start at $50,000 and change only the fraction.
| Fraction of equity risked | Ending balance | Worst peak-to-trough drawdown | Gain needed to recover that drawdown |
|---|---|---|---|
| 0.25% | $53,769.54 | 9.20% | 10.14% |
| 0.5% | $57,360.60 | 17.62% | 21.39% |
| 1% | $63,786.14 | 32.35% | 47.81% |
| 1.5% | $68,880.37 | 44.60% | 80.52% |
| 2% | $72,346.91 | 54.77% | 121.11% |
| 3% | $73,852.29 | 70.11% | 234.61% |
| 4% | $68,520.46 | 80.47% | 412.08% |
| 5% | $58,245.80 | 87.38% | 692.33% |
| 10% | $8,474.55 | 99.03% | more than 10,000% |
| 20% | $2.30 | above 99.99% | not recoverable in practice |
| 40% | under $0.01 | above 99.99% | not recoverable in practice |
Three things in the ladder are worth slowing down for.
- Ending balance and drawdown do not rise together. Moving from 1% to 2% added about $8,561 of ending balance and raised the gain needed to recover from 47.81% to 121.11%.
- Between 3% and 5% the ending balance falls while the risk per trade rises. More fraction bought less money.
- At 10% and above the same trades that grew the account at 1% effectively wipe it out.
Where fixed fractional sizing stops adding return
A single rung means little on its own, so the fraction was also stepped in 0.25-point increments around the peak.
| Fraction in the fine grid | Ending balance on the grid | Worst drawdown on the grid |
|---|---|---|
| 1.75% | $70,830.89 | 49.93% |
| 2.25% | $73,411.31 | 59.18% |
| 2.5% | $74,015.60 | 63.18% |
| 2.75% | $74,159.84 | 66.82% |
| 3% | $73,852.29 | 70.11% |
| 3.5% | $71,952.33 | 75.81% |
| 4.5% | $63,841.34 | 84.28% |
| 5.5% | $52,077.42 | 89.89% |
| 5.75% | $48,881.99 | 90.97% |
| 6% | $45,663.47 | 91.93% |
The ending balance peaks at 2.75%, but the neighbors are so close that the exact peak means nothing. From 2.25% to 3.5% the ending balance only ranges from $71,952.33 to $74,159.84, while the drawdown climbs from 59.18% to 75.81%. By 5.75% the account finishes below its $50,000 start.
That is the shape of the decision. Past roughly 1%, each extra point of fraction buys a shrinking amount of return and pays for it with a fast-growing drawdown. A trader who could not keep executing through a 55% drawdown has no business at 2%, even though 2% finished higher than 1% on this sequence.
Related lesson: Maximum risk per trade
Drawdown Bands From Reshuffled Trade Order
The fraction ladder uses one order of trades, the order history happened to deliver. To see how much of each drawdown was luck, the 224 results were reshuffled 5,000 times (Python's random module, seed 196) and every fraction was rerun on each shuffle.
| Fraction in the reshuffle test | 5th percentile drawdown | Median drawdown | 95th percentile drawdown | Historical drawdown | Shuffles with a drawdown of 40% or more |
|---|---|---|---|---|---|
| 0.5% | 8.44% | 12.45% | 18.98% | 17.62% | 0% |
| 1% | 16.41% | 23.65% | 34.70% | 32.35% | 0.78% |
| 2% | 30.98% | 42.79% | 58.31% | 54.77% | 63% |
| 3% | 43.81% | 58.00% | 74.13% | 70.11% | 98.54% |
| 5% | 64.54% | 78.98% | 90.76% | 87.38% | 100% |
At 1% the historical drawdown was worse than about 90% of the reshuffles, so the real order was an unlucky one. That cuts both ways. The 32.35% you would have lived through was not a freak, and a trader planning around the 23.65% median would have been badly surprised.
At 2%, 63% of the reshuffled sequences hit a drawdown of 40% or more. At 5%, all of them did.
The practical rule: read a drawdown as one draw from a band. If a fraction only fits your tolerance because the trades arrived in a kind order, your tolerance is not protecting you.
Related lesson: Maximum drawdown
Fixed Lot vs Fixed Fractional Sizing on the Same Trades
Fixed lot sizing trades the same number of contracts every time. Fixed dollar sizing risks the same dollar amount every time. Fixed fractional sizing risks the same share of current equity. Here are those policies on the identical 224 trades, all starting at $50,000.
| Sizing policy | Ending balance | Worst drawdown | Trades skipped |
|---|---|---|---|
| One full-size contract every trade | Below zero on trade 154 | Account wiped out | 0 |
| One micro contract every trade | $49,523.89 | 26.11% | 0 |
| Fixed $500 risk in whole micros | $63,796.51 | 19.98% | 36 |
| 1% of equity in whole full-size contracts | $51,665.00 | Only one trade taken | 223 |
| 1% of equity in whole micros | $67,709.15 | 23.99% | 20 |
| 1% of equity at exact fractional size | $63,786.14 | 32.35% | 0 |
What fixed lot and fixed fractional results show
Simple is not the same as safe, and the fixed lot policies fail in opposite ways. One full-size contract ignores how far away the stop is, so a trade with a $13,158.25 stop gets the same size as one with a $410.75 stop. One micro is survivable but stays tiny forever and finished slightly below the start.
The risk-based policies (fixed $500 risk, and 1% of equity in micros or at exact size) finished close to each other, and the differences are not a verdict. The whole-micro versions show lower drawdowns partly because rounding down skipped the trades with the widest stops. With a sample t statistic of 0.84, a few points between two variants of one rule is noise. The warning is 1% of equity in whole full-size contracts: on a $50,000 account that fraction almost never bought a single ES or NQ contract, so the plan existed on paper and took exactly one of the 224 trades.
The useful conclusion is narrow. Sizing against the risk of each trade, by fixed dollars or fixed fraction, survived. Sizing by a fixed contract count with no cap did not.
Related lesson: Risk of ruin
Fixed Ratio vs Fixed Fractional Sizing
Fixed ratio sizing, introduced by Ryan Jones in his book "The Trading Game", grows size from profit instead of equity. Its one setting is the delta, the profit per contract needed to add one more contract. Adaptrade's write-up of the method gives the contract count as:
Contracts = 0.5 × [1 + √(1 + 8 × profit ÷ delta)]
With a $5,000 delta, you need $5,000 of profit to go from one contract to two, another $10,000 to reach three, and so on. Size rises more slowly as profit grows, which is the point: fixed ratio adds contracts faster than fixed fractional on small accounts and slower on large ones.
The catch for this comparison is that fixed ratio ignores the stop. It sizes the same whether the next trade risks $410.75 or $13,158.25 per contract.
On the 224 trades, using micros and starting at one contract:
- Delta $1,000: ending balance $48,440.24, worst drawdown 29.75%, never more than 3 contracts.
- Delta $250: ending balance $46,887.31, worst drawdown 30.25%, never more than 4 contracts.
Both finished below the $50,000 start with drawdowns close to the 1% fixed fractional path, which finished at $63,786.14. On this sequence, sizing from the stop did more work than sizing from the profit curve. That reflects a low-win-rate, high-variance sample, and a smoother system could rank them differently.
Whole Contracts and Micros in Fractional Sizing
Every fixed fractional result assumes you can hold any size. You cannot. The gap between the size the fraction calculates and the whole contracts you can hold is where many fractional plans quietly stop working.
Take a $1,000 risk cap, 2% of a $50,000 account. The median stop in the 224 trades cost $1,581.39 on one full-size contract. Rounding down to whole contracts, that cap allowed zero contracts on 163 of the 224 trades. On those 163 skipped trades the rule produced −35.42R. On the 61 it could take, +66.14R. One skipped trade was a 9.84R winner.
Micro contracts change the arithmetic. With MES and MNQ, each one tenth of its full-size contract, the median trade risk per contract fell to $158.14, and the same $1,000 cap allowed a position on 220 of the 224 trades.
The rule of thumb: if your fraction at a typical stop buys less than one contract, the plan is not sizing. It is skipping. Check whether micros close that gap before you decide the fraction works.
Related lesson: Mini and micro futures contracts
Volatility-Based Sizing With ATR Stops
Volatility-based sizing sets the stop from how much the market is moving, then lets the fixed fraction do the rest. The study's stop is one average true range (ATR), so when volatility doubles the stop doubles and the contract count halves. The dollar risk stays at the fraction.
That pairing matters because dollar risk per contract swings far more than most traders assume. Across the 224 trades, the risk on one full-size contract at a one-ATR stop was:
- 5th percentile: $645.51
- Median: $1,581.39
- 95th percentile: $7,298.79
- Largest: $13,158.25
The 95th percentile was 11.31 times the 5th, and the largest was 8.32 times the median. The median ES stop was 29.47 points, worth $1,473.44 per contract. The median NQ stop was 81.44 points, worth $1,628.75.
A fixed contract count applied to those stops would have produced dollar risk that varied elevenfold from calm markets to volatile ones. Fixed fractional sizing with an ATR stop held it constant. The tradeoff is that in quiet markets the fraction may call for more contracts than the trader is comfortable holding, which is where a hard contract cap belongs in the plan.
Related lesson: Volatility-based position sizing
Kelly Criterion and the Growth-Optimal Fraction
The Kelly criterion comes from John L. Kelly Jr.'s 1956 paper "A New Interpretation of Information Rate" in the Bell System Technical Journal. It gives the fraction that maximizes long-run compounded growth for a known edge. The common trading version is:
Kelly fraction = W − (1 − W) ÷ R
where W is the win rate and R is the average win divided by the average loss.
On the 224 trades, W is 25.89% and the payoff ratio is 3.40, so the simple formula gives 4.12%. A version that uses the full spread of results, mean divided by variance, gives 2.31%. The actual peak on the fine grid was 2.75%, with a 66.82% drawdown.
Why traders use a fraction of the Kelly criterion
Three problems keep most traders well below a full Kelly fraction.
- The inputs are estimates. In the 224-trade breakout study, the edge of 0.1371R per trade has a 95% confidence interval that includes zero, so the "optimal" fraction could be anywhere from zero to several percent.
- Full Kelly accepts very deep drawdowns. At 2.75%, the growth peak for those 224 trades, the account fell 66.82% from its high.
- Overestimating the edge costs far more than underestimating it. On the same trades, risking 5% per trade finished at $58,245.80, below the $63,786.14 reached at 1%.
Many traders size at a half or a quarter of their Kelly estimate. Half of the study's 2.31% mean-variance estimate is about 1.16%, close to the 1% fraction that produced a 32.35% worst drawdown on those trades.
Related lesson: Kelly criterion for trading
Risk Budget Allocation Across Open Positions
A per-trade fraction is not the same as total risk. If you hold several positions at once, the risk budget is the sum of every open stop, and correlated positions behave like one bigger trade.
In the study, 89 of the 224 trades were entered while the other product already had a trade open, and 84 of those were in the same direction. Daily returns on ES and NQ had a correlation of 0.92 over the window. So at 1% per trade, the real exposure on those 84 occasions was close to 2% on what was nearly one bet on US equity indexes.
A simple risk budget handles this:
- Set a per-trade fraction, for example 1%.
- Set a total open-risk cap, for example 2%, across all positions.
- Count highly correlated positions together toward the cap, or size each at half.
- When a new signal would breach the cap, skip it or reduce it, and write down which.
Scaling into a position under one risk budget
Scaling in means building a position in pieces. Under a fixed fraction, the whole position, not each piece, gets the budget. If the plan risks 1% and you enter in three parts, the combined loss at the shared stop should be 1%, not 3%. Scaling out works in reverse: taking partial profits reduces the open risk and frees budget, but it does not change the fraction you started with.
Related lesson: Portfolio heat and total exposure
Cutting the Sizing Fraction During a Drawdown
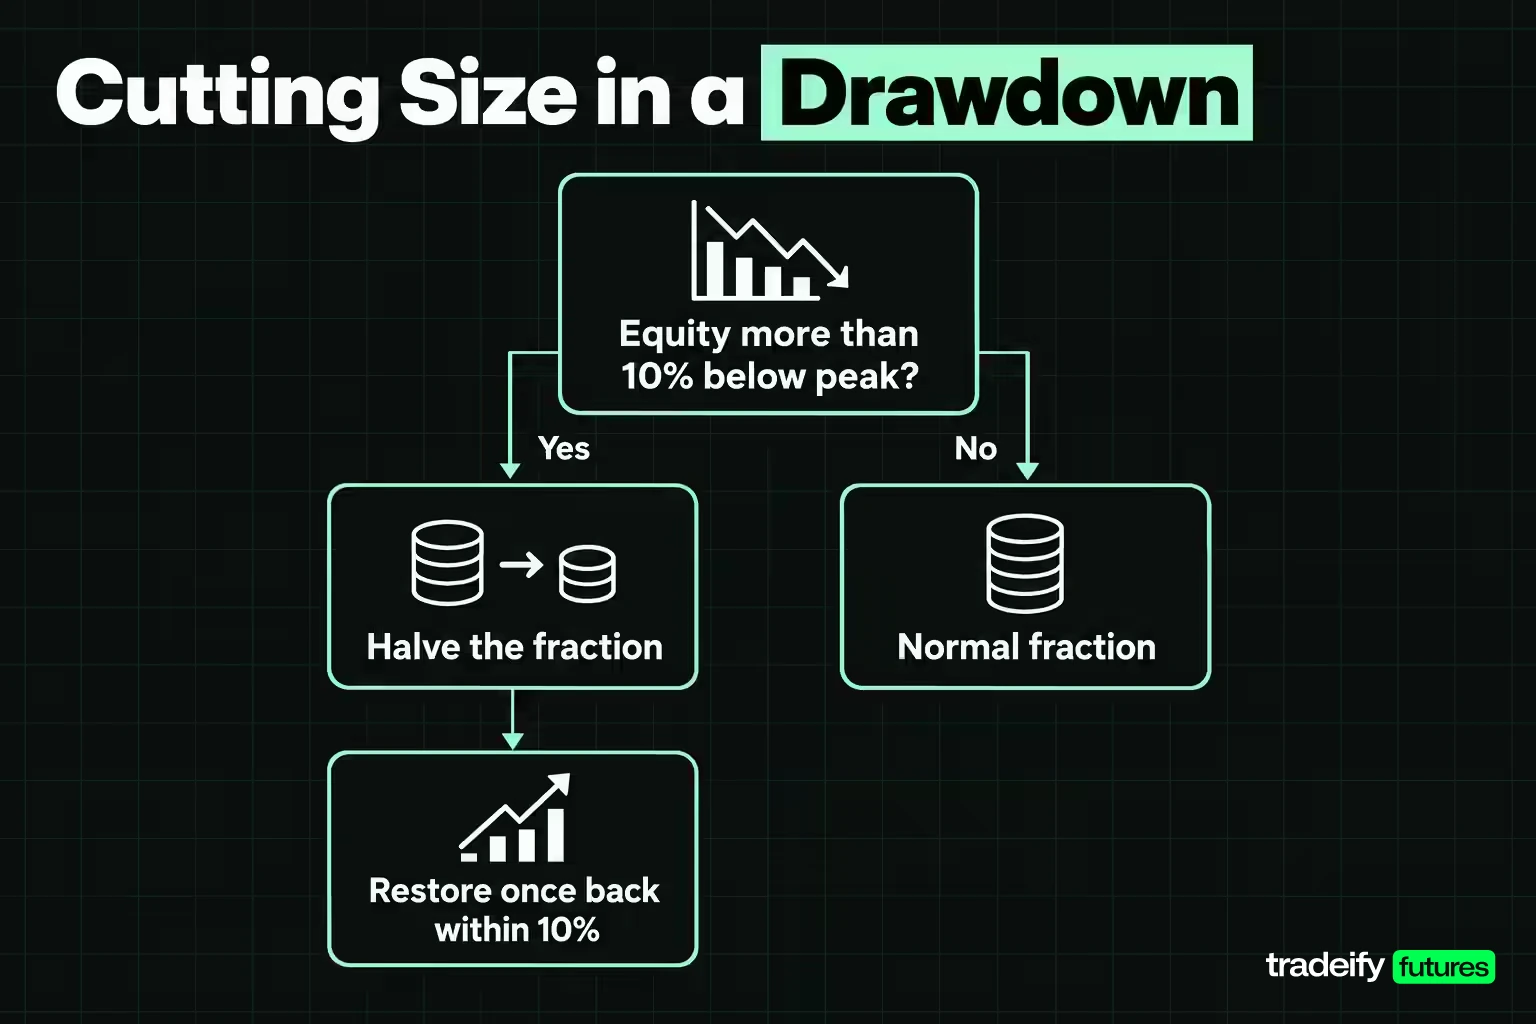
Fixed fractional sizing already reduces dollar risk after losses. Some traders add a second brake: cut the fraction itself when equity falls a set distance below its peak.
The study tested one version: risk the normal fraction, but halve it whenever equity is more than 10% below its high, and restore it once equity is back within 10%.
| Drawdown sizing rule | Ending balance with the cut rule | Worst drawdown with the cut rule |
|---|---|---|
| 1% throughout | $63,786.14 | 32.35% |
| 1%, cut to 0.5% when 10% below peak | $61,456.86 | 21.90% |
| 2% throughout | $72,346.91 | 54.77% |
| 2%, cut to 1% when 10% below peak | $72,380.11 | 36.07% |
On this sequence the cut rule lowered the worst drawdown by about a third at both fractions, and at 2% it finished with almost the same balance. The cost shows up when a recovery starts while the fraction is still reduced, which is why the 1% version ended a little lower.
The value is mostly behavioral. A trader who knows the fraction will drop automatically at −10% has less reason to abandon the plan, or to double up, during the stretch where most plans break.
Related lesson: Recovering from a drawdown
Trading Costs Inside the Sizing Calculation
A fixed fraction divides a risk budget by the stop distance. Costs scale with the number of contracts, so tight stops, which buy more contracts, are where costs bite hardest.
ES and NQ both trade in 0.25-point ticks, worth $12.50 and $5.00 on the full-size contracts and $1.25 and $0.50 on MES and MNQ. For an illustrative cost model, assume two ticks of slippage on every trade plus a round-turn commission of $4.00 on full-size contracts and $1.00 on micros. These are assumptions, not anyone's published rate.
On that model the average cost was 0.0155R per trade on full-size contracts and 0.0197R on micros. That is 11.28% and 14.37% of the 0.1371R gross edge, leaving about 0.1217R and 0.1174R. Micros cost more in R because a fixed commission is large relative to a small tick value.
How stop distance changes cost in fractional sizing
The same $29.00 of cost on one ES contract (two ticks plus $4.00) takes a very different share of the risk depending on the stop:
| ES stop distance | Dollar risk per contract | Cost as a share of the risk |
|---|---|---|
| 5 points | $250 | 11.60% |
| 10 points | $500 | 5.80% |
| 20 points | $1,000 | 2.90% |
| 29.47 points (study median) | $1,473.44 | 1.97% |
Costs do not change the shape of the fraction ladder, but they lower every rung, and they lower tight-stop strategies much more than wide-stop ones.
The Psychology of Position Size During Losing Streaks
Position size changes how a trader behaves long before it changes the account balance. A size that looks fine on a spreadsheet can feel very different on the eighth loss in a row.
The pooled sample had a longest run of 14 losing trades, and 4 of its 41 losing runs reached 10 or more. At 1% of equity, the worst drawdown ran from a peak after a trade entered in October 2017 to a trough after a trade entered in March 2023, about 70 trades. That is years of being below a high-water mark with a rule that was, on average, still positive.
Here is where traders usually get caught:
- Cutting size right before the winners. In a low-win-rate system, a handful of large winners carry the result. Abandoning the plan at minus 25% often means missing them.
- Raising size to get back faster. The recovery table shows why it feels tempting and why it is dangerous: a deeper hole needs a bigger gain, and a bigger fraction makes the next streak deeper too.
- Reading a streak as a verdict. Fourteen losses in a row looks like proof that something broke. In this sample it was part of the normal distribution of a positive-average rule.
A precommitted fraction exists to take those decisions out of the moment. Decide three numbers before the streak starts: the fraction, the drawdown level that cuts it, and the level that pauses trading for a review. If you know the rule before you trade, it does not surprise you on loss number nine.
Choosing a Position Sizing Method and Fraction
Choosing a sizing method and a fraction comes down to a few questions you can answer from your own records.
- Is the edge measured? If you cannot state an average result per trade with a sample behind it, start with a small fraction. A small fraction buys time to find out whether the edge exists.
- What drawdown can you keep executing through? Rerun your trades in shuffled order and look at the 95th percentile drawdown, not the historical one. If it is beyond what you would sit through, the fraction is too large.
- How many contracts does the fraction buy at a typical stop, and at a wide one? If the answer at the median is zero, move to smaller contracts or a wider risk budget before trusting the plan.
- Do your stops vary a lot? If so, use fixed fractional or fixed dollar sizing. Fixed lot sizing only makes sense when stop distances barely change.
- Is the account small and growing? Fixed ratio adds contracts faster at small sizes. Fixed fractional keeps risk proportional throughout.
Then write the rule down: the fraction, the equity figure it applies to, the method that sets the stop, the total open-risk cap, and the drawdown level that cuts the fraction.
Tracking position size in a trading journal
A journal is how you find out whether the sizing rule is being followed. For every trade, record the planned risk, the actual risk after rounding, the contract count and the stop distance. Review it monthly. The common findings are trades sized above plan after a win, trades skipped because the size rounded to zero, and a creeping fraction nobody decided on.
Related lesson: How to keep a trading journal
Automating Fixed Fractional Position Size Calculations
Fixed fractional sizing is simple enough to calculate by hand, which is exactly why it gets done wrong with a fast market and a setup forming. A spreadsheet, a calculator or a platform's position-size tool should handle it.
A useful calculator should:
- Take account equity, the fraction, the stop distance and the contract's dollar value per point.
- Round down to whole contracts and show the actual dollar risk after rounding.
- Flag when the result is zero contracts, rather than silently returning one.
- Add a cost estimate in dollars and as a share of the risk.
- Respect any hard contract cap or open-risk cap you set.
Fractional Sizing Against a Trailing Drawdown
Fractional sizing on an account with a hard loss floor, such as a prop-firm evaluation, needs one change: apply the fraction to the room left above the floor, not to the nominal balance.
Imagine a hypothetical $50,000 account with a $2,500 trailing drawdown. Risking 1% of the nominal balance is $500 per trade, which is 20% of the real room. Five full losses in a row at 1% of a shrinking balance would use about $2,450 of that $2,500, while the same streak costs 4.90% of a normal account. Sizing at, say, 10% of the remaining room would start at $250 and shrink as the room shrinks, which is fixed fractional logic pointed at the number that actually matters.
On our accounts, size is capped by contract limits rather than margin: a 50K account can hold up to 4 minis or 40 micros, and a 50K Growth funded account has a $2,000 end-of-day trailing drawdown, so a $500 risk would use a quarter of that room on one trade. Positions must be closed by 4:45 PM ET with no overnight holds, so multi-week trades like the ones in this study are not something our accounts allow. Funded accounts are simulated.
Fixed Fractional Position Sizing FAQ
What is the difference between fixed fractional and fixed percentage sizing?
Fixed fractional sizing fixes the share of equity you lose if the stop is hit, so position size changes with the stop distance. Fixed percentage of capital puts the same share of the account into each position, so the dollar risk changes with the stop instead. The names are often used loosely, so check which one a source means.
Is fixed fractional position sizing the same as the 2% rule?
No. The 2% rule, which caps risk at 2% of equity per trade, is one choice of fraction, while fixed fractional sizing is the method that fraction feeds into. On the 224 trades in this study, 2% of equity produced a 54.77% worst drawdown, against 32.35% at 1%.
Does fixed fractional sizing reduce risk?
Partly. It shrinks the dollar risk after each loss because risk stays proportional to current equity, but it does not lower the chance of another loss. A 14-trade losing streak at 2% still costs 24.64% of the account.
What fraction should a beginner use for fixed fractional sizing?
A small fraction, at or below 1% of equity, is the cautious starting point until the edge is measured, though no single number suits every account. CME Group's education course on the 2% rule treats 2% as a ceiling and calls that threshold arbitrary. On this sample, 1% already meant a 32.35% historical drawdown, so a new trader with an unmeasured edge has good reason to start below that.
How does contract size affect fixed fractional sizing?
It decides whether the plan runs at all. On a $50,000 account, 1% of equity in whole full-size ES or NQ contracts allowed exactly one trade out of 224, while whole micros allowed 204. If the calculated size rounds to zero, you are skipping trades, not sizing them.
This article is educational and is not trading, investment or financial advice. The study is a historical, mechanical test of one rule on daily bars with no discretion and simplified fills; past results do not predict future results. Futures are leveraged, losses can exceed what you expect, and a fixed fraction does not prevent large drawdowns. Results on simulated or evaluation accounts are simulated and are not the same as results on a live brokerage account.


