



TL;DR: MACD measures how fast a 12-period and a 26-period EMA are separating, so it describes momentum after price has moved. Its signal line crossovers whipsaw in ranges so they need a trend filter, a written stop and a fixed setting. On the S&P 500 in 2026, only 4 of 11 daily crossovers held their direction 20 sessions later.
MACD is one of the first indicators most traders add to a chart, and one of the first they misread. The lines cross, the histogram flips color, and it feels like the chart just told you what to do. It didn't. MACD is a measurement of two moving averages that have already reacted to price.
This guide covers how MACD is built, what each signal means, where it fails, and how to turn it into rules you can test. The examples use real S&P 500 closes from 2026, calculated from scratch, so every number can be checked.
What MACD Measures
MACD stands for moving average convergence divergence. Gerald Appel created it in the late 1970s to show changes in the strength, direction and duration of a trend using two moving averages instead of one.
The idea is simple. A fast average reacts quickly to new prices and a slow average reacts slowly. When price starts trending, the fast average pulls away from the slow one (divergence of the averages). When the trend tires, the two drift back together (convergence). MACD plots that gap.
That makes MACD a trend-following and momentum tool at the same time. It tells you which average is on top, which is trend direction, and how quickly the gap is changing, which is momentum.
What MACD does not tell you matters as much:
- It does not predict the next bar. Every input is a closing price that already printed.
- It does not tell you whether a reading is large or small for that market, because it has no fixed range.
- It does not tell you where to put a stop. That comes from price structure and your risk budget.
Because it is built from moving averages, MACD is a lagging indicator. By the time it confirms a trend, part of the move is already gone. That is the trade you make with it: fewer surprises, later entries.
Related lesson: Moving averages SMA vs EMA
How the MACD Indicator Is Calculated
The MACD indicator is three series drawn from closing prices. The standard settings are 12, 26 and 9.
| MACD component | Formula | What it shows |
|---|---|---|
| MACD line | 12-period EMA of closes minus 26-period EMA of closes | Which average is on top and by how much |
| Signal line | 9-period EMA of the MACD line | A smoothed version of the MACD line, so turns are easier to spot |
| Histogram | MACD line minus signal line | Whether the MACD line is pulling away from or closing in on its signal line |
| Zero line | MACD line equals 0 | The point where the 12 and 26 EMAs are equal |
An exponential moving average (EMA) weights recent prices more heavily than older ones. Each new EMA value moves toward the latest close by a smoothing factor of 2 divided by (period plus 1). For the 12-period EMA that factor is 0.1538, and for the 26-period EMA it is 0.0741, which is why the 12-period line does most of the moving.
Most charting software seeds the first EMA value with a simple average of the first full period of closes, then applies the smoothing from there. Platforms that seed differently can show slightly different values on the earliest bars of a chart. The difference fades as more bars load.
What 12, 26 and 9 Mean on MACD
The three numbers are periods, not price levels. On a daily chart, 12 is the fast EMA length, 26 is the slow EMA length, and 9 is the length of the EMA applied to the MACD line to make the signal line.
The values come from a time when the trading week had six days. Twelve periods was two weeks, 26 was about a month and 9 was a week and a half. They survive mostly because they are the shared default on almost every platform, not because research found them to be the best values.
On a 5-minute chart the same settings mean 60 minutes, 130 minutes and 45 minutes. The indicator does not know what timeframe it is on. It only counts bars.
A Worked MACD Example on the S&P 500
This MACD example uses daily closes of the S&P 500 index from February 2026. The values come from a calculation on 211 daily closes between 2 January and 3 November 2026, with each EMA seeded from the simple average of its first full period. Numbers are rounded to two decimals.
| Date | Close | 12 EMA | 26 EMA | MACD line | Signal line | Histogram |
|---|---|---|---|---|---|---|
| 2026-02-20 | 6909.51 | 6890.02 | 6904.05 | -14.03 | -9.43 | -4.60 |
| 2026-02-23 | 6837.75 | 6881.98 | 6899.14 | -17.16 | -10.98 | -6.19 |
| 2026-02-24 | 6890.07 | 6883.22 | 6898.47 | -15.25 | -11.83 | -3.42 |
| 2026-02-25 | 6946.13 | 6892.90 | 6902.00 | -9.10 | -11.28 | 2.19 |
| 2026-02-26 | 6908.86 | 6895.36 | 6902.51 | -7.15 | -10.46 | 3.31 |
| 2026-02-27 | 6878.88 | 6892.82 | 6900.76 | -7.94 | -9.95 | 2.02 |
| 2026-03-02 | 6881.62 | 6891.10 | 6899.34 | -8.24 | -9.61 | 1.37 |
| 2026-03-03 | 6816.63 | 6879.64 | 6893.21 | -13.57 | -10.40 | -3.17 |
Reading the MACD Crossover Bar by Bar
The 25 February 2026 MACD crossover on the S&P 500 shows how the signal forms. On 24 February the MACD line is at -15.25 and the signal line at -11.83, so the histogram is negative. On 25 February the index closes 56.06 points higher. The fast EMA jumps, the MACD line rises to -9.10, it crosses above the signal line, and the histogram flips to 2.19. That is a bullish signal line crossover, and one strong day produced it.
Three things in this example are easy to miss on a chart:
- Both lines are still below zero at the crossover. The signal says downside momentum is fading, not that an uptrend has started.
- The histogram peaks the day after the crossover at 3.31 and then shrinks. The crossover bar is not the moment of strongest momentum.
- Four sessions later, on 3 March, the histogram flips negative again. The index closed at 6816.63, 129.50 points below the crossover close. On one E-mini S&P 500 (ES) contract at $50 per point, that is $6,475.
Price moved first, the fast average followed, the slow average lagged, and the crossover printed last. Then the move failed. That sequence is the normal life of a MACD signal, not a defect in this one. The temptation after a miss like this is to tweak the settings until the chart would have avoided it, which only fits the indicator to a past you can no longer trade.
Reading the MACD Histogram
The MACD histogram is the gap between the MACD line and its signal line, drawn as bars. Thomas Aspray developed it to warn of signal line crossovers before they happen, because crossovers of two moving averages arrive late.
Reading it comes down to three questions:
- Which side of zero is it on? Positive bars mean the MACD line is above its signal line. Negative bars mean it is below.
- Are the bars growing or shrinking? Growing bars mean momentum is expanding in that direction. Shrinking bars mean the two lines are converging toward a crossover.
- How big are they relative to recent bars? The histogram has no fixed scale, so size only means something compared with the same chart's history.
The 2026 S&P 500 data shows what a strong signal looks like next to a weak one. After the 2 April bullish crossover, the histogram grew from 4.25 to 46.51 in five sessions. After the 3 August crossover, it grew from 3.54 to 33.48. After the 25 February crossover, it peaked at 3.31 the next day and then shrank. Expanding bars right after a cross were the difference between a move that ran and a cross that died.
The catch is noise. StockCharts describes the histogram as the fourth derivative of price: price, then two EMAs, then the MACD line, then its signal line, then the gap between them. Each step adds sensitivity. A shrinking bar is an early warning, not a reason to exit by itself, because the histogram can shrink and expand again several times inside one trend.
A practical way to use it: if you are already in a trade, a histogram that stops expanding is a cue to check your stop and plan. It is not a new entry signal on its own, and it is not a reason to grab a small profit out of nerves when your exit rule hasn't triggered.
MACD Signal Line Crossovers
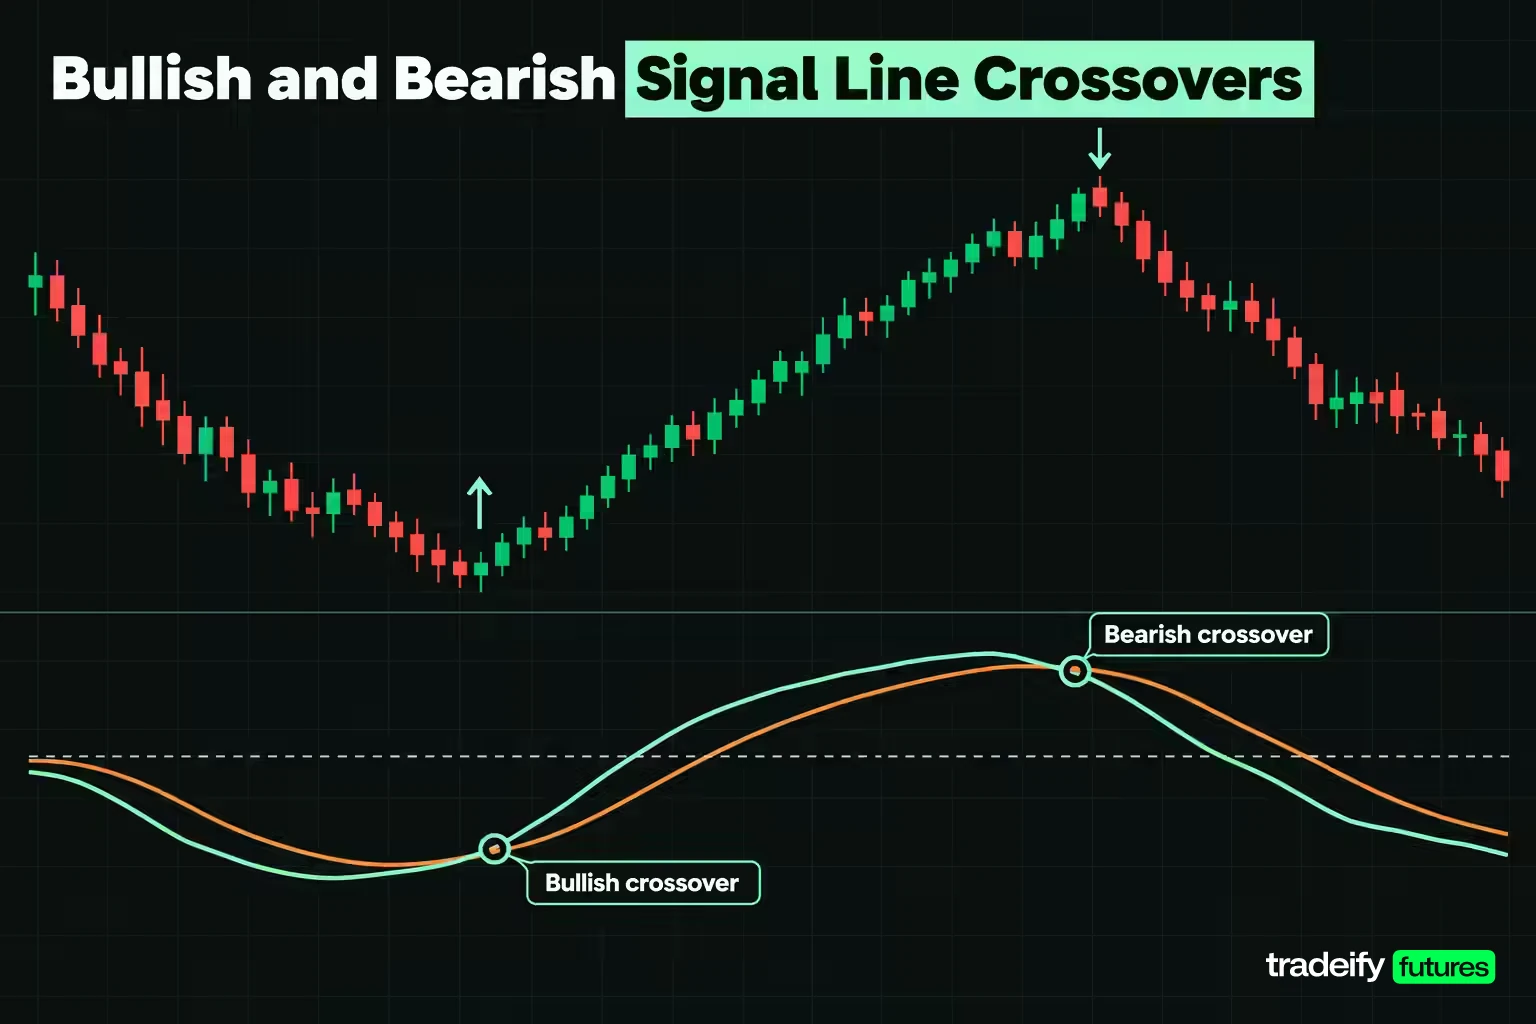
A MACD signal line crossover happens when the MACD line crosses its signal line. Crossing up is bullish; crossing down is bearish. It is the most common MACD signal, and the histogram changing sign is the same event seen from a different angle.
The standard reading is that a bullish crossover means upside momentum is building and a bearish one means downside momentum is building. What matters is how often that reading holds, and what the misses cost.
How Often MACD Crossovers Held in 2026
This audit counts every MACD(12,26,9) signal line crossover on the S&P 500 daily chart from 2 January to 3 November 2026, then measures the index's move 10 and 20 sessions later in the signal's direction. A positive number means price moved the way the signal pointed. It is an illustrative study on one index and one year, not a measure of edge.
| Crossover date | Signal | Close | MACD line | Move after 10 sessions | Move after 20 sessions |
|---|---|---|---|---|---|
| 2026-02-25 | Bullish | 6946.13 | -9.10 | -170.33 | -354.23 |
| 2026-03-03 | Bearish | 6816.63 | -13.57 | 100.54 | 288.11 |
| 2026-04-02 | Bullish | 6582.69 | -85.59 | 543.37 | 647.43 |
| 2026-05-18 | Bearish | 7403.05 | 141.45 | -206.73 | -108.30 |
| 2026-07-06 | Bullish | 7537.43 | 23.65 | -94.15 | 63.07 |
| 2026-07-17 | Bearish | 7457.69 | 28.79 | -32.03 | -328.07 |
| 2026-08-03 | Bullish | 7600.50 | 3.96 | 144.56 | 85.64 |
| 2026-08-20 | Bearish | 7641.16 | 60.56 | -106.55 | -9.34 |
| 2026-09-21 | Bullish | 7764.70 | 3.97 | 9.25 | -73.97 |
| 2026-09-30 | Bearish | 7651.54 | 10.11 | -67.40 | -92.44 |
| 2026-10-05 | Bullish | 7773.95 | 17.18 | -83.22 | -232.55 |
| 2026-10-15 | Bearish | 7744.06 | 28.00 | 23.67 | Not yet measurable |
These counts come from this guide's own calculation on S&P 500 daily closes published in the St. Louis Fed's FRED database. There were 12 crossovers in 211 sessions, about one every 18 sessions. Ten sessions later, 5 of 12 had moved in the signal's direction. Twenty sessions later, 4 of 11 had.
Why One MACD Crossover Carried the Year
In the same 2026 S&P 500 crossover audit, the distribution tells you more than the hit rate. At 20 sessions the winners totalled 1,084.25 points and the losers 1,198.90 points, a net of -114.65 points, or -$5,732.50 on one ES contract before any costs. One signal, the 2 April bullish crossover near the spring low, produced 647.43 points, about 60% of all the winning points.
That is the shape of a trend-following signal. Most crossovers lose a little, a few catch a real move, and the result depends heavily on whether you were still taking signals when the big one came. A string of losing crossovers does not prove the tool is broken, and one great crossover does not prove it works.
The fastest failure in the sample is worth remembering. A bearish crossover on 30 September was reversed by a bullish crossover on 5 October, three sessions later and 122.41 points higher. Anyone who sold the first signal and bought the second paid for both sides of the chop.
MACD Zero Line Crossovers
A MACD zero line crossover (also called a centerline crossover) happens when the MACD line moves from negative to positive or back. At that moment the 12-period EMA has crossed the 26-period EMA. Crossing above zero is read as bullish and crossing below as bearish.
A zero line cross says more about trend direction than about momentum. It is slower than a signal line crossover, because the MACD line has to travel all the way to zero rather than just cross its own average. That slowness filters some noise, but not all of it.
The 2026 S&P 500 daily chart had 10 zero line crossovers between 2 January and 3 November. Several were nearly useless:
- The MACD line crossed above zero on 11 February and back below on 12 February, one session apart.
- It crossed below zero on 23 October, above on 29 October and below again on 30 October.
Both clusters came while the index was going sideways and the two EMAs sat almost on top of each other. When the averages are that close, a single day can flip the sign. A zero line cross in that state is a coin landing on its edge.
Zero line crossovers work better as context than as triggers. A MACD line that has been above zero for weeks describes an uptrend; one hovering around zero describes a market without a clear trend. Many traders use that context to decide which signal line crossovers to take: bullish crosses only while the MACD line is above zero, bearish only while it is below.
MACD Divergence, Regular and Hidden
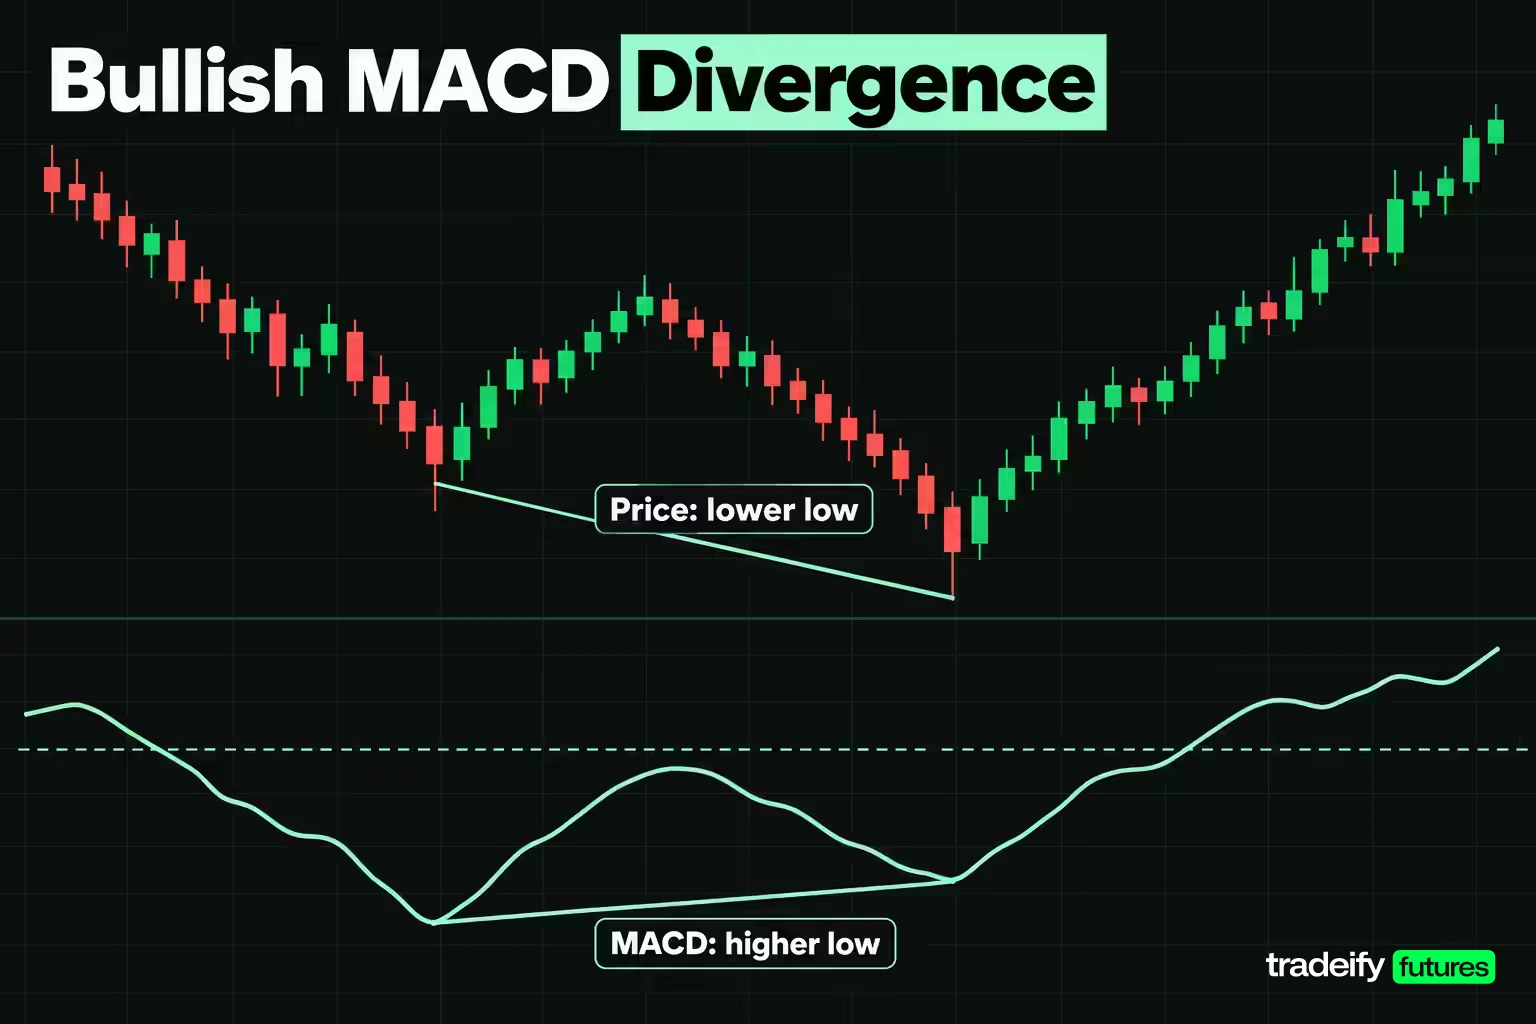
MACD divergence is when price and the MACD line disagree about an extreme. It is the most talked-about MACD signal and the least precise.
- Bullish divergence: price makes a lower low while the MACD line makes a higher low. Price is still falling, but downside momentum is weaker than last time.
- Bearish divergence: price makes a higher high while the MACD line makes a lower high. Price is still rising, but upside momentum is weaker.
- Hidden bullish divergence: price makes a higher low while MACD makes a lower low. Many traders read it as a pullback within an uptrend rather than a reversal.
- Hidden bearish divergence: price makes a lower high while MACD makes a higher high, read as a bounce within a downtrend.
A bullish MACD divergence means selling pressure is fading, not that buying has started. As long as the MACD line stays below zero, downside momentum still outweighs upside momentum. That is why divergence often appears several times before price turns, and sometimes never resolves into a reversal at all.
StockCharts makes two cautions worth carrying. Short and shallow divergences, the kind that form over a few days, are far more common than long and pronounced ones, and they are less reliable. And bearish divergences are common in strong uptrends, where momentum naturally slows as the move matures without the trend ending.
A workable rule for divergence: treat it as a reason to tighten your plan, not as an entry. If you are long and a bearish divergence forms, check your stop and how much open profit you are willing to give back. If you want to trade a divergence, wait for price itself to confirm it, such as a break of the last swing high or low, and put your stop beyond the extreme that formed it.
Why MACD Has No Overbought or Oversold Level
MACD overbought and oversold readings do not exist in the way they do on RSI or the stochastic oscillator. MACD is unbounded. There is no 70 or 30, no ceiling and no floor.
The size of a MACD reading also depends on the price of the market. MACD is an absolute price oscillator: it measures the gap between two averages in price units. A reading of 40 on the S&P 500, which trades in the thousands, means something very different from 40 on a stock priced at $20. The same market can also produce much larger readings at higher price levels or in more volatile periods.
What you can do is compare a reading with that chart's own history. If the MACD line is at a level it has rarely reached in the last year, momentum is stretched. StockCharts notes that signal line crossovers at these extremes deserve caution, because a strong move often slows and produces a crossover even if the trend continues. But during sharp moves, MACD can push past its old extremes and keep going.
If you want a momentum reading you can compare across markets or across years, the percentage price oscillator (PPO) divides the same gap by the slower average. That turns it into a percentage, so a PPO of 1% means the same thing on any chart. For true overbought and oversold levels, a bounded oscillator such as RSI is the better tool.
MACD Settings and Timeframes
There is no single best MACD setting. The right setting depends on the timeframe you trade, how often you want signals, and whether the setting holds up on data you did not use to choose it.
| MACD setting | Sensitivity | Typical use | Tradeoff |
|---|---|---|---|
| 12, 26, 9 | Standard | Daily charts and the default on most platforms | The setting most traders see, but not proven best |
| 5, 35, 5 | More sensitive | StockCharts suggests it may suit weekly charts | Earlier turns, more false signals |
| Longer than 12, 26, 9 | Less sensitive | Traders who want fewer, slower signals | Fewer whipsaws, later entries |
Shortening the fast EMA or the signal line makes MACD react sooner and cross more often. Lengthening them does the reverse. Neither is better in general. A faster setting gives earlier entries and more false starts; a slower one gives fewer signals and gives back more of each move before it turns.
What Research Says About Tuning MACD Settings
Two research findings show why chasing the perfect MACD setting is risky:
- A 2021 study by Kang in the Journal of Risk and Financial Management found that the standard 12, 26, 9 settings produced negative performance on Nikkei 225 futures from 2011 to 2019. After simulating 19,456 MACD models, it concluded that settings should be tuned for each market before adding filters for false signals.
- An independent published backtest on S&P 500 data (quant4free) let an optimizer search for the best periods. It picked 18 / 25 / 7, nothing like the default. That setting scored a Sharpe ratio of 0.76 on the data used to find it and 0.29 on data it had not seen.
Put those together and the lesson is clear. Settings matter, but a setting tuned on the same bars you grade it on will look better than it is. Pick a setting that fits your holding period, test it on a separate stretch of data, and keep it fixed once you start trading it. Changing settings after every losing streak is curve fitting in real time.
For timeframe fit, remember that the indicator counts bars. If you hold trades for an hour, a MACD on a 1-minute chart is measuring 12 to 26 minutes of momentum, which is far shorter than your trade. Match the chart to the holding period first, then decide whether the default reacts fast enough.
Related lesson: Backtesting a trading strategy
MACD Trading Strategies With Written Rules
MACD trading strategies only become testable when every step is written down before the signal appears: which bar counts, what filters apply, where the stop goes and when you exit. The three approaches here are starting points to test, not recommendations.
Trend-Filtered MACD Crossover
This MACD strategy takes signal line crossovers only in the direction of the zero line.
- Take bullish crossovers only when the MACD line is above zero, and bearish crossovers only when it is below zero.
- Enter at the close of the crossover bar.
- Place the stop beyond the most recent swing low (for longs) or swing high (for shorts) on the price chart, not at a MACD level.
- Exit at a target set from price structure, or when the opposite crossover prints, whichever comes first.
In this guide's own calculation on FRED's S&P 500 daily closes (211 closes, 2 January to 3 November 2026), 5 of the 12 crossovers met the zero line filter. Three of those 5 moved in their signal's direction 20 sessions later, for a net of 130.30 points. The 7 crossovers against the zero line side went 1 for 6 at 20 sessions, for a net of -244.95 points.
The failure mode is right there in the same data. The best signal of the year, the 2 April bullish crossover, came with the MACD line at -85.59, deep below zero. The filter would have skipped it. A trend filter cuts the counter-trend losers and also the early reversal entries that catch the biggest moves. Five signals is far too small a sample to call either version better.
MACD Histogram Pullback
This approach uses the MACD histogram to time entries inside an existing trend.
- Define the trend first: the MACD line above zero and price above a longer moving average for longs (reverse for shorts).
- Wait for the histogram to shrink toward zero during a pullback, showing momentum cooling.
- Enter when the histogram turns back up (for longs) while still in the trend, and price takes out the prior bar's high.
- Place the stop beyond the pullback's low.
The logic is that you are buying a pause in a trend, not calling a bottom. The risk is that a shrinking histogram can be the start of a reversal rather than a pause, which is why the stop belongs at a price level that would prove the trend wrong.
MACD Divergence With Price Confirmation
This approach treats divergence as a setup that needs price to agree.
- Mark a bullish or bearish divergence between two clear swing points on closing prices.
- Do nothing until price breaks the swing high between the two lows (bullish) or the swing low between the two highs (bearish).
- Enter on that break, with the stop beyond the extreme that formed the divergence.
- Size the trade so that stop distance fits your risk budget.
Without waiting for the price break, divergence trading means fighting a trend that is still in force. Skipping the wait is tempting, because the earliest entry looks like the best price. It is also the entry most often stopped out while the divergence keeps building.
What a MACD Confirmation Filter Costs
A common MACD filter is to wait for the histogram to keep its sign for three bars before acting. In this guide's own calculation on FRED's 2026 S&P 500 daily closes, all 12 crossovers passed that test, including the 25 February bullish signal that failed four sessions later. The filter rejected nothing. What it did was move the entry: waiting for the third bar made the average entry 10.06 points worse, about $503 per ES contract.
A filter is a different rule, not free protection. Test it the way you would test any rule, and check whether it removes bad signals or only delays good ones.
Related lesson: Stop loss orders and placement
Using MACD With RSI and Other Indicators
MACD is most useful when it answers one question inside a larger plan rather than every question at once. Pairing it with tools that measure something different gives you confirmation instead of the same signal twice.
| Indicator | What it measures | Range | How it pairs with MACD |
|---|---|---|---|
| MACD | Gap between two EMAs and its rate of change | Unbounded | Trend direction and momentum |
| RSI | Average gains versus average losses over 14 periods by default | 0 to 100, with 70 and 30 as common extremes | Stretched conditions MACD cannot show |
| Longer moving average | Average price over a long lookback | Follows price | Defines the trend MACD trades within |
| Support and resistance | Prior price levels where buying or selling appeared | Price levels | Entry location, stop placement and targets |
MACD versus RSI is a common question, and the answer is that they do different jobs. RSI, developed by J. Welles Wilder and published in his 1978 book, is bounded between 0 and 100, so it can describe overbought and oversold conditions. MACD is unbounded and better at describing whether a trend's momentum is building or fading. Neither is more accurate in general.
A sensible combination uses each for one job. For example, trade in the direction of a longer moving average, take MACD crossovers only on that side, avoid new longs when RSI is already above 70, and place the stop at a support or resistance level. Each tool filters a different kind of mistake.
The trap is stacking indicators that measure the same thing. MACD, a moving average crossover and a momentum oscillator built on similar lookbacks will often agree, and that agreement feels like confirmation when it is really one signal counted three times.
Related lesson: Relative strength index RSI
MACD Advantages and Limitations
MACD stays popular because it is simple, visual and does two jobs in one panel. It also has limits that no setting change fixes.
| MACD advantages | MACD limitations |
|---|---|
| Shows trend direction and momentum together | Lags price by construction |
| Same formula on every platform and timeframe | Whipsaws when price moves sideways |
| Histogram gives earlier warning of crossovers | No overbought or oversold levels |
| Easy to turn into written, testable rules | Default settings are a convention, not a finding |
MACD in Sideways Markets
MACD performs worst in a sideways market. When price chops inside a range, the 12 and 26 EMAs sit close together, and small moves push the MACD line back and forth across its signal line and across zero. Each cross looks like a signal and most go nowhere.
The 2026 S&P 500 study shows the pattern: zero line crosses one session apart in February and three crosses in six sessions in late October, both while the index moved sideways. The better fix is deciding before the session whether the market is trending at all, from the price structure and a longer average, and standing aside from crossovers when it is not.
What the Research Says About MACD
Published tests of MACD are mixed:
- Chong, Ng and Liew (2014) found that a MACD(12,26,0) rule generated significant abnormal returns on the Milan Comit General and S&P/TSX Composite indices, but not consistently across all five developed markets they tested.
- Kang (2021) found the default settings lost money on Nikkei 225 futures from 2011 to 2019, while settings tuned to that market did better.
- The quant4free backtest on SPY from 2007 to 2026, with costs of 10 basis points a side, found that a MACD long-or-cash rule cut the maximum drawdown from -55% to -25% but returned 4.0% a year against 10.7% for buy and hold, with a lower Sharpe ratio (0.41 versus 0.62).
- The quant4free backtest also tested MACD crossovers on S&P 1500 stocks from 2015 to 2026: 4,080 trades, a win rate of about 35%, and 7.9% a year against 13.5% for simply holding SPY.
The honest summary: MACD can describe momentum usefully and can reduce exposure during long declines, but as a standalone signal it has a weak record once costs are included. It earns its place as one part of a plan, not as the plan.
MACD on Intraday Futures Charts
MACD works the same way on a 5-minute futures chart as on a daily index chart, but the stakes are counted in ticks and dollars, so the math is worth doing before the first trade.
On the E-mini S&P 500 (ES), one index point is $50 and the minimum tick of 0.25 points is $12.50. On the Micro E-mini S&P 500 (MES), one point is $5 and one tick is $1.25.
Take an illustrative MACD trade with round numbers. A bullish crossover prints with the MACD line above zero at 6,000. The last swing low is at 5,980, so the stop goes there, and the target is the prior high at 6,040.
- Risk is 20 points: $1,000 on one ES or $100 on one MES.
- Reward is 40 points, a 2 to 1 ratio, so the trade breaks even over time at a win rate of 33.3%.
- Two ticks of slippage on the round turn add 0.50 points, $25 on ES or $2.50 on MES, before commissions.
Then compare that with how often your MACD signals actually win, measured from your journal or a backtest rather than from memory. If your journal shows crossovers on your chart winning 30% of the time at 2 to 1, the rule loses money even before costs, however clean the chart looks. If crossovers come every few bars on a short timeframe, costs and whipsaws add up fast, and a slower chart or a stricter filter may suit you better than a new indicator.
Futures are leveraged, so a MACD signal that fails can cost far more than the indicator's small numbers suggest. Size from the stop distance and your risk budget, never from how strong the histogram looks.
Daily MACD Signals and Session-Close Rules
A MACD crossover on a daily chart assumes you can hold a position for days or weeks. Under rules that close every position before the session ends, the same signal has to be traded on an intraday chart instead, with the daily MACD used only as background context.
On our accounts, every position must be closed by 4:45 PM ET on regular trading days, with no overnight or swing holds, so a daily-chart MACD crossover cannot be held as a multi-day trade there; MACD is used on intraday charts within one session. MACD is in the Standard Indicators list on WealthCharts, one of our supported platforms, and its Chart Replay lets you rewind past sessions to practise reading crossovers. Our funded accounts are simulated.
Related lesson: Risk reward ratio
MACD FAQ
What does a MACD of 12-26 mean?
It means the MACD line is the 12-period EMA minus the 26-period EMA of closing prices. The 9 that usually follows is the length of the EMA used for the signal line. The numbers date from a six-day trading week, when 12 periods was two weeks and 26 was a month.
What is the meaning of the MACD indicator?
MACD stands for moving average convergence divergence. It measures how far a fast EMA has moved away from a slow EMA, and how quickly that gap is changing. In plain terms, it shows trend direction and momentum after price has moved.
Which MACD setting is best?
No setting is best for every market or timeframe. The 12, 26, 9 default is the most widely used, but Kang's 2021 study of Nikkei 225 futures found tuned settings did better, and a tuned S&P 500 setting in the quant4free backtest fell apart on new data. Choose a setting that fits your holding period, test it on unseen data, and keep it fixed.
What does a bullish MACD divergence mean?
A bullish MACD divergence means price made a lower low while the MACD line made a higher low. Downside momentum is fading, but it has not reversed. Wait for price to confirm, such as a break of the last swing high, before treating it as a buy signal.
Is MACD a leading or lagging indicator?
MACD is a lagging indicator. Every part of it is built from moving averages of closes that already happened, so crossovers print after price has turned. The histogram gives somewhat earlier warning, at the cost of more noise.
Is MACD good for day trading?
MACD can work on intraday charts if the settings fit your holding period and you trade it with a written stop and a trend filter. Short timeframes produce more crossovers, so costs and whipsaws weigh more. Test the exact rule on your instrument and timeframe first.
MACD Trading Risk
This article is general education about how the MACD indicator works, not investment advice or a recommendation to trade any product. Futures and other leveraged products can lose money quickly, and losses can exceed what you expect from a single signal. The S&P 500 figures are a historical, illustrative calculation on one index over one year, and past indicator behaviour does not predict future results. Evaluation and funded accounts are simulated, and simulated results do not represent live trading.


