




TL;DR: Strategy timeframes decide how often your rules fire, how wide your stop sits and how many contracts your risk buys. On ES, the median ATR was 5.77 points on a 5-minute chart and 21.88 on an hourly one. That turned a $250 risk into 8 MES contracts on the fast chart and 2 on the slow one. Use a higher chart for direction, a lower one for timing, and test that exact pairing.
Most traders pick a chart the way they pick a seat: whatever felt comfortable the first time. Then a strategy that looked clean on someone else's 15-minute chart gets run on a 5-minute chart, the losses stack up, and the rule takes the blame.
Strategy timeframes are the bar intervals your rules read, and choosing them is a design decision, not a viewing preference. The chart sets how often your condition appears, how far away your stop has to sit and how much each trade costs relative to that stop. This guide covers how to choose a timeframe for your style, how to combine timeframes with top-down analysis, and what an original E-mini S&P 500 test shows when one rule runs unchanged on four charts.
What strategy timeframes are and what they change
A strategy timeframe is the period one bar or candle on your chart represents, such as 5 minutes, 1 hour or 1 day. Because your entry, stop and exit rules read those bars, the timeframe is also the clock your decisions run on.
Changing strategy timeframes moves four things at once:
- Signal frequency. The same condition fires far more often on a fast chart. A regular 9:30 AM to 4:00 PM ET stock-index session holds 78 five-minute bars, 26 fifteen-minute bars, 13 thirty-minute bars and 7 hourly bars.
- Stop distance. Normal noise grows with the bar size. On ES from August 27 to November 4, 2026, the median 14-bar average true range (ATR) was 5.77 points on the 5-minute chart, 10.13 on the 15-minute, 14.87 on the 30-minute and 21.88 on the hourly chart.
- Cost share. Commission and slippage are roughly fixed per trade, so a narrow stop gives them a bigger share of every loss.
- Position size. Contracts equal dollar risk divided by stop distance in dollars, so a wider stop buys fewer contracts.
None of these strategy timeframe effects is a matter of taste. They are arithmetic, and they decide whether a strategy can pay for itself before you read a single chart.
Related lesson: How to build a trading strategy
Choosing strategy timeframes for your trading style
Choosing strategy timeframes starts with how long you intend to hold a trade and how many hours you can actually watch the market. The chart sets follow from that, not the other way around.
| Trading style | Typical holding time | Common higher chart | Common execution chart |
|---|---|---|---|
| Scalping | Seconds to a few minutes | 15-minute or 5-minute | 1-minute or tick chart |
| Day trading | Minutes to hours, flat by the close | 60-minute or daily | 5-minute or 15-minute |
| Swing trading | Days to a few weeks | Weekly or daily | 60-minute or 4-hour |
| Position trading | Weeks to months | Monthly or weekly | Daily |
These strategy timeframes are conventions, not rules. No public survey settles which timeframe most traders use, but intraday traders commonly work between the 1-minute and 15-minute charts and almost everyone glances at the daily chart, because it is where the widely watched highs, lows and closes sit.
How the timeframe sets your stop and position size
Matching a chart to your style is the comfortable half of the timeframe choice. The harder half is what your risk budget can fund. Take an illustrative $25,000 account risking 1% per trade, which is $250, trading Micro E-mini S&P 500 (MES) futures at $5 per index point, with the stop placed one ATR from entry and an assumed cost of 0.50 points ($2.50) per round turn.
| Chart | Median ATR in points | 1-ATR stop per MES | MES contracts for $250 | Round-turn cost for that size | Cost as share of 1-ATR stop |
|---|---|---|---|---|---|
| 5-minute | 5.77 | $28.85 | 8 | $20.00 | 8.7% |
| 15-minute | 10.13 | $50.65 | 4 | $10.00 | 4.9% |
| 30-minute | 14.87 | $74.35 | 3 | $7.50 | 3.4% |
| 60-minute | 21.88 | $109.40 | 2 | $5.00 | 2.3% |
Read the last two columns together. The fast chart lets you hold more contracts, and those contracts eat 8% of the $250 budget in costs before the trade does anything. On the hourly chart the same budget holds 2 contracts for $5.00, or 2%. The ATR figures are medians from 48 ES regular-hours sessions between August 27 and November 4, 2026, so treat them as a snapshot, not a constant. When volatility changes, recalculate the stop and the contract count.
The ES contract is ten times MES at $50 per point, so one ES with a 1-ATR stop on the hourly chart risks $1,094, more than four times the $250 budget. That is the hidden constraint behind many timeframe choices. A trader who cannot fund a wide stop on the standard contract gets pushed to a faster chart, or to micros, whether or not the faster chart suits how they read price. Better to know that before the first trade than to learn it after a string of stop-outs.
Related lesson: Position sizing futures contracts
How multi-timeframe analysis works
Multi-timeframe analysis means reading the same market on two or three strategy timeframes that each have a different job. The higher chart answers "which direction and where are the important levels", the middle chart answers "is there a setup here", and the lower chart answers "when exactly do I get in and where is my stop".
The value comes from the division of labour. A 5-minute chart is full of short swings that look like trends and reverse within the hour. In 48 ES regular-hours sessions from August 27 to November 4, 2026, the 5-minute trend read (20-period moving average above or below the 50-period) flipped a median of once per session, and on some days several times. A higher chart smooths those swings out, so it can say which of the 5-minute moves runs with the larger flow and which runs against it.
The structure only works if the charts are not equal votes. If the hourly chart says down and the 5-minute chart says up, a trader treating them equally can justify either trade on the same morning, and usually picks whichever one matches the position they already want. Multi-timeframe analysis needs a hierarchy written into the rules: the higher chart sets the allowed direction, and the lower chart is only allowed to time entries in that direction or to say "not yet".
Related lesson: Multiple-timeframe analysis
The timeframe triad and the anchor timeframe
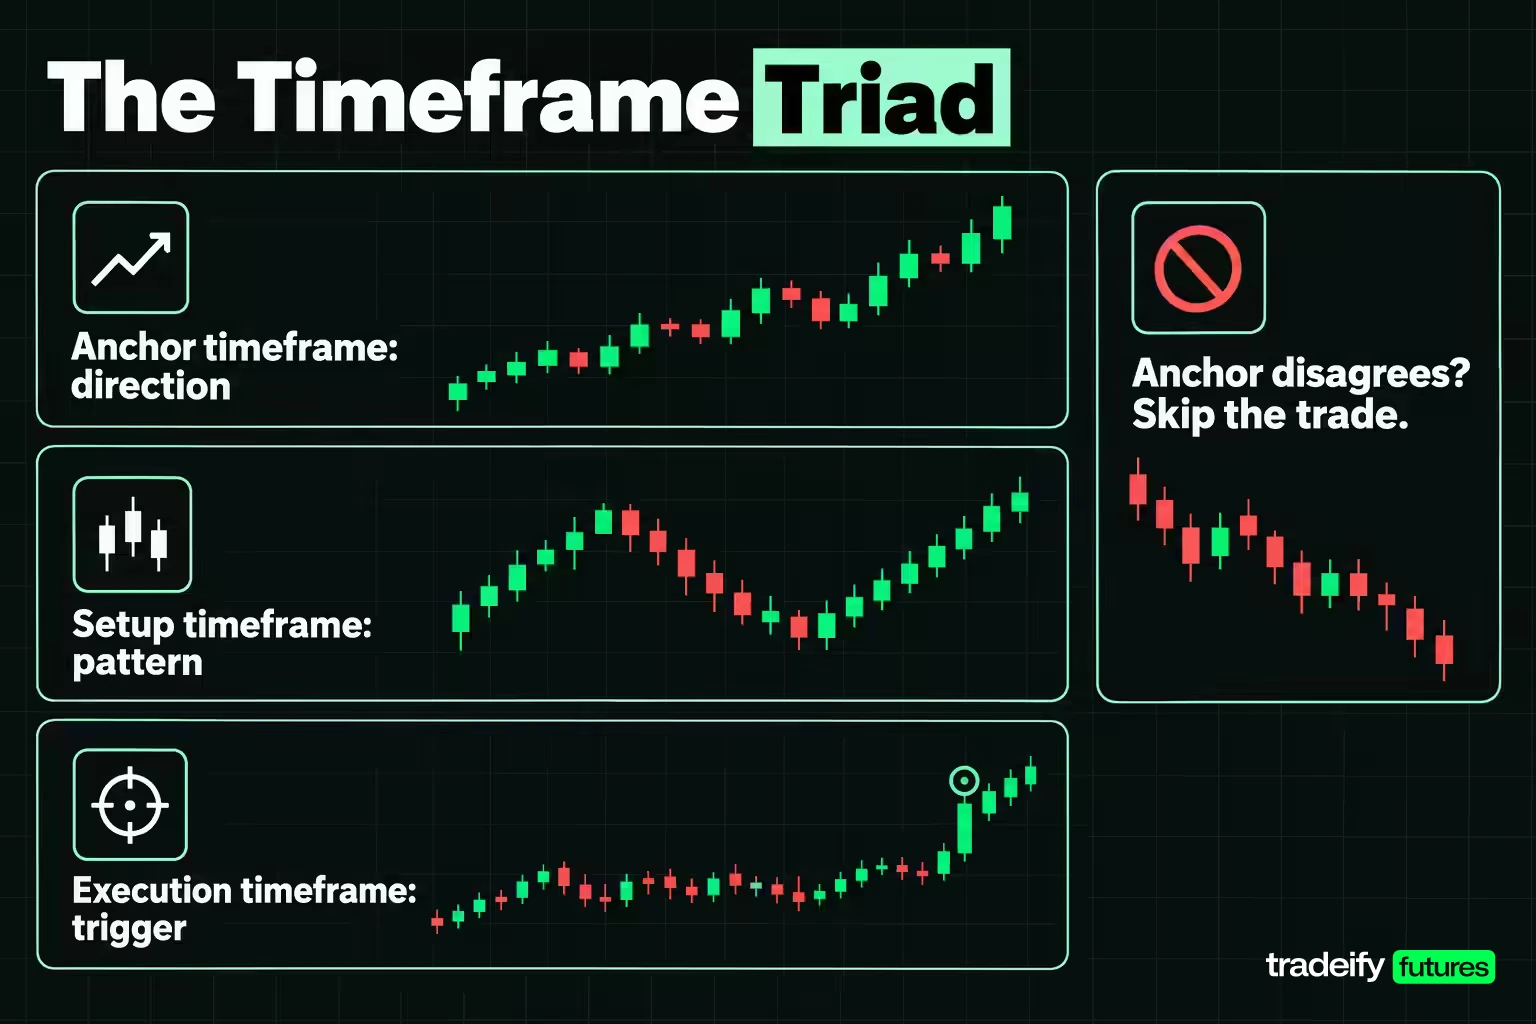
A timeframe triad is a set of three charts: an anchor timeframe for direction, a setup timeframe for the pattern, and an execution timeframe for the trigger. The anchor timeframe is the one you hold yourself accountable to; if it disagrees with your trade, you skip the trade.
Two published spacing conventions help keep the three charts far enough apart to say different things:
- The rule of four. Investopedia's multiple-timeframe guide suggests choosing an intermediate chart that matches your usual holding period, then a short-term chart at least one-fourth of it and a long-term chart at least four times it.
- The factor of five. Alexander Elder's Triple Screen system divides timeframes into units of about five, since there are five trading days in a week and five to six hours in a stock trading day.
In practice, a 60-minute anchor, a 15-minute setup chart and a 5-minute execution chart follow the rule of four for the first step (60 to 15) and a factor of three for the second (15 to 5). A daily anchor over a 60-minute setup chart is a step of 6.5 regular-hours bars. Charts closer together than about three times tend to show the same swings twice, which adds screens without adding information.
Pick the anchor first among your strategy timeframes, from your holding period, not from the chart that looks best today. A day trader who closes every position by the end of the session rarely needs a weekly anchor, while a swing trader who uses a 5-minute anchor will be shaken out of trades by noise their holding period should ignore.
Top-down analysis from the higher timeframe
Top-down analysis is the habit of reading charts in order from the highest timeframe to the lowest, so each chart narrows the decision the previous one made. The order matters because it stops the fast chart from setting the agenda.
A workable top-down sequence on any market looks like this:
- Anchor chart. State the direction with a written rule, such as price above a rising 20-period moving average, or a series of higher highs and higher lows. Mark the two or three nearest major levels. If there is no clear direction, write "range" and treat it that way.
- Setup chart. Look only for setups in the anchor direction, such as a pullback toward a level or a consolidation under resistance in an uptrend. If price sits in the middle of nowhere relative to the anchor levels, there is no setup.
- Execution chart. Wait for the trigger your rules name, place the stop where the setup is proven wrong, and size the position from that distance.
The point of the sequence is what it rules out. A strong 5-minute rally into a major daily resistance level is a weak long and a candidate short in a downtrend, and you only see that if you looked at the daily chart first. Bottom-up reading (spotting a pattern on the fast chart and then checking the higher chart to justify it) is where confirmation bias usually creeps in.
Trend identification across timeframes
Trend identification across timeframes works only when the word "trend" has a definition. Three definitions are common, and each should be applied the same way on every chart you use:
- Moving averages. For example, uptrend when the 20-period average is above the 50-period average and price is above the 20.
- Swing structure. Uptrend while the chart keeps making higher highs and higher lows; the trend is in question when a swing low breaks.
- Momentum indicators. RSI holding above 50, or MACD above its signal line, read on the anchor chart as context rather than as a trigger.
Indicators behave differently across strategy timeframes because their settings count bars, not minutes. A 20-period average on a 5-minute chart covers 100 minutes of trading; on a daily chart it covers about four weeks. The same RSI reading means a short burst on the fast chart and a sustained move on the slow one.
Expect the charts to disagree often. In the ES window from August 27 to November 4, 2026, the 5-minute trend at 10:30 AM ET agreed with the daily trend (prior close against its 20-day average) on 23 of 47 sessions and disagreed on 24. The hourly trend at the open agreed with the daily trend on 28 of 41 sessions. Disagreement is not a malfunction: it is the reason the anchor needs to be named in advance, so the conflict is settled before the trade rather than during it.
Support and resistance zones across timeframes
Support and resistance zones across timeframes carry different weight: a level drawn on the daily chart has usually been seen by more participants and tested over more sessions than a level drawn on a 5-minute chart. That is why most multi-timeframe methods take their key levels from the anchor chart and only use the lower charts to see how price behaves when it arrives.
Higher-timeframe levels should be drawn as zones, not single prices. A daily swing low might cover several points of ES once you include the wick, the close and nearby retests, and the zone width should scale with that chart's ATR. Drawing a daily level as a single tick-precise line invites stops that sit exactly where everyone else's sit.
Range trading uses the same split. When the anchor chart is sideways, its range high and range low become the boundaries, and the setup chart looks for rejection near those edges rather than breakouts in the middle. A typical sequence:
- Mark the range on the higher chart using at least two touches on each side.
- Ignore the middle third of the range, where neither side has a location advantage.
- Near an edge, use the lower chart for a sign of rejection, such as a failed push beyond the boundary that closes back inside.
- Put the stop beyond the boundary, and target the middle or the opposite edge.
The range is over when the higher chart closes and holds outside it, not when a fast chart pokes through.
Related lesson: Support and resistance
Entry timing on the lower timeframe
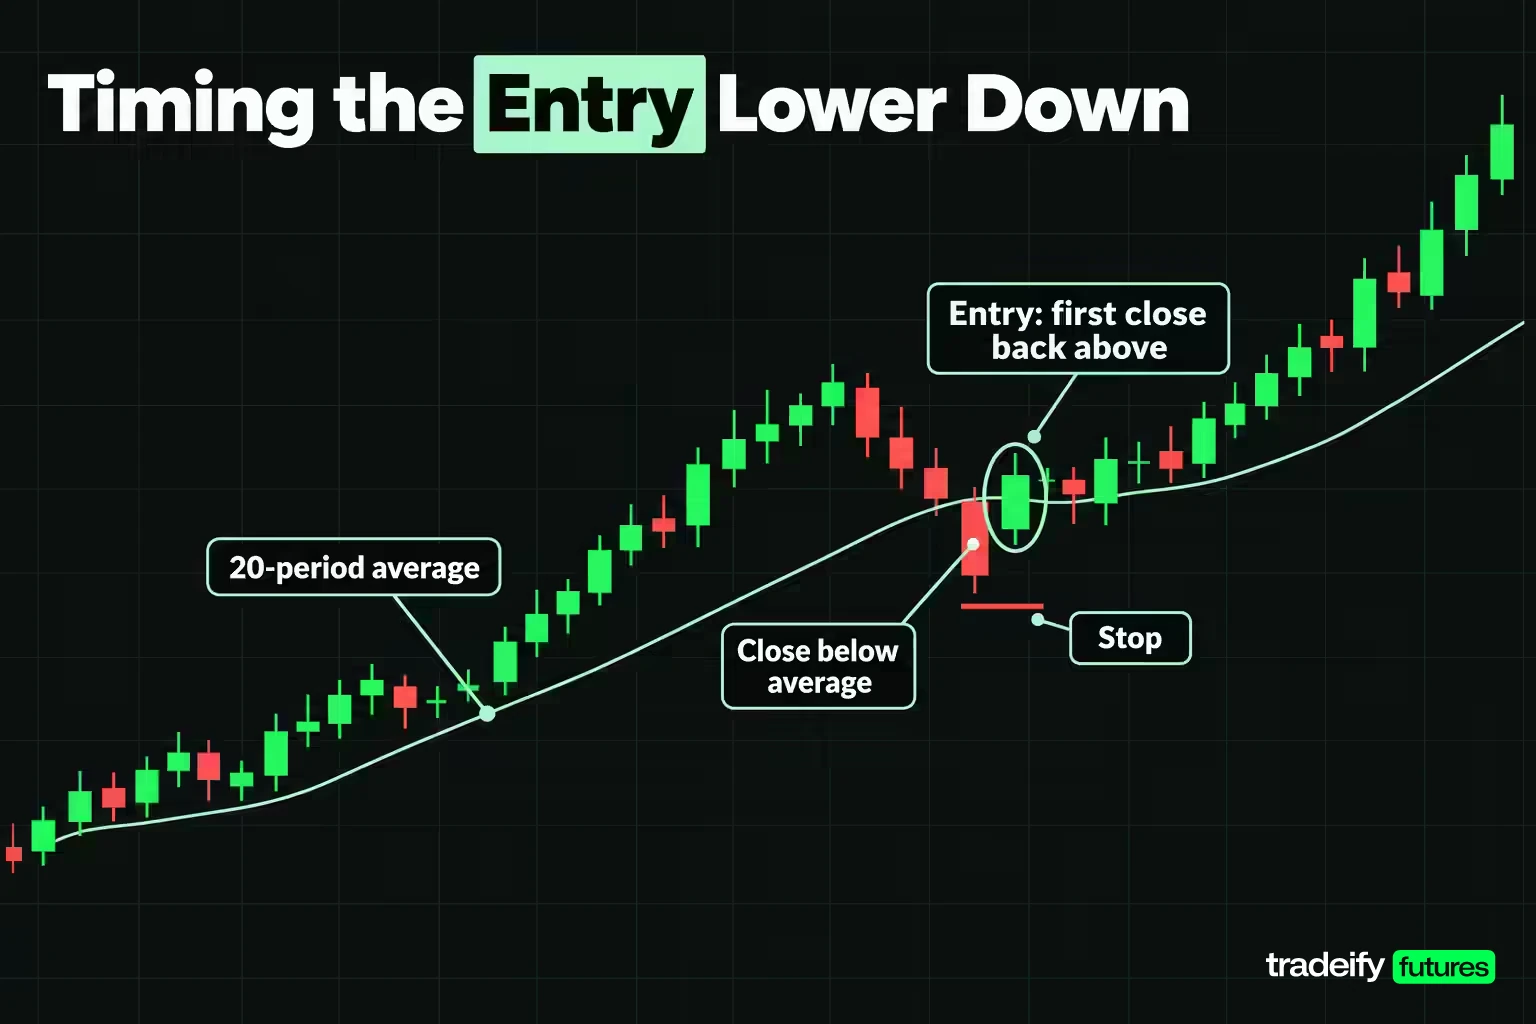
Entry timing on the lower timeframe is the execution chart's only job: the higher chart has already decided direction and location, and the lower chart decides the moment. A good trigger is specific enough to be tested, such as a close back above a moving average after a pullback, a break of the prior bar's high, or a reversal candle at a marked zone.
Candlestick patterns follow the same hierarchy. A hammer or bullish engulfing bar on a 5-minute chart at a daily support zone is a timing signal with context behind it; the same candle in the middle of a daily range is a 5-minute event and nothing more. A pattern on the higher chart (for example, a daily engulfing bar) is better treated as a setup, then timed on the lower chart.
A 15-minute ES entry timed bar by bar
On October 21, 2026, the ES 15-minute chart had its 20-period average above the 50-period average. The 10:00 AM bar closed at 7,754.75, below the 20-period average at 7,759.61. The 10:15 AM bar closed back above it at 7,761.00, which was the entry under a simple pullback rule: in an uptrend, buy the first close back above the 20-period average after a close below it, with a stop one ATR away and a target two ATRs away.
The 15-minute ATR at that bar was 10.71 points, so the stop sat at 7,750.29 and the target, two ATRs away, at 7,782.43. That stop is $535.50 of risk on one ES or $53.55 on one MES. The 11:00 AM bar traded to 7,782.75 and filled the target, a 20.93-point net gain after the assumed 0.50-point cost.
Here is the part worth noticing. Both the hourly trend and the daily trend pointed down at that moment. A strict top-down filter would have blocked the trade. That is not proof the filter is wrong, since one trade proves nothing, but it shows the real cost of every filter: it removes winners as well as losers, and only a larger sample says which it removes more of.
Related lesson: Entry and exit strategies
Breakouts and bounces with timeframe confirmation
At a higher-timeframe level, price either breaks through or bounces, and the lower timeframe is where you see which one is happening. The level comes from the anchor chart; the evidence comes from the execution chart.
Signs that favour a breakout:
- Price closes beyond the zone on the setup chart, not just on a 1-minute or 5-minute bar.
- The first pullback to the old level holds it from the other side (old resistance acting as support).
- The anchor trend points in the breakout direction.
Signs that favour a bounce or a failed breakout:
- Price pokes beyond the zone on the execution chart and closes back inside within a bar or two.
- The move into the level is against the anchor trend.
- Pushes beyond the level get smaller each time.
The common error is acting on the execution chart's first close beyond a daily level. On a fast chart, those closes happen often and reverse often. Waiting for the setup chart to confirm costs some entry price; the trade-off is fewer fakeouts, and whether that trade-off is worth it for your market is something only your own test data can answer.
Related lesson: Breakout trading
One ES rule tested on four strategy timeframes
To show what strategy timeframes do to a result, one ordinary pullback rule was run unchanged on four ES charts. The rule: when the 20-period simple moving average is above the 50-period (below, for shorts), wait for a bar to close below the 20-period average (above, for shorts), then enter on the first bar that closes back on the trend side. Stop one ATR away, target two ATRs, flat at the 4:00 PM ET close, no new entries after 3:30 PM ET, one position at a time, 0.50 points of cost per round turn.
The data: 48 complete regular-hours sessions of the front-month E-mini S&P 500 (continuous contract, 5-minute bars aggregated to 15, 30 and 60 minutes) from August 27 to November 4, 2026. If both stop and target fell inside one bar, the stop was assumed first.
| Timeframe tested | Trades | Winners | Net points per trade | 95% interval | Median hold |
|---|---|---|---|---|---|
| 5-minute | 105 | 30.5% | -1.15 | -2.85 to +0.55 | 20 minutes |
| 15-minute | 28 | 32.1% | -1.76 | -6.72 to +3.21 | 52.5 minutes |
| 30-minute | 7 | 71.4% | +6.88 | -12.31 to +26.07 | 90 minutes |
| 60-minute | 7 | 57.1% | +1.65 | -11.35 to +14.65 | 240 minutes |
What the ES timeframe test shows
In the ES pullback test on 5, 15, 30 and 60-minute charts, the 30-minute result of +6.88 points per trade looks like the winner. It is not evidence of anything. Its seven trades produce an interval from -12.31 to +26.07 points, which includes large losses and large gains. All four charts have intervals that include zero, so this window cannot separate the rule from no edge on any of them.
What the test does show is how much the timeframe changes the shape of the strategy while the rule text stays identical:
- Frequency. About 2.2 trades per session on the 5-minute chart against about 0.15 on the 30-minute and hourly charts.
- Break-even bar. With a 2:1 target and the 0.50-point cost, the win rate needed to break even is 36.2% on the 5-minute chart and 34.1% on the hourly chart, against 33.3% with no cost. The 5-minute rule won 30.5%, below its own bar; 71 of its 105 trades hit the stop.
How many trades a strategy timeframe needs
Sample size is the practical lesson of the ES test, and it is the one most traders skip. The 15-minute result has a standard deviation of 12.79 points per trade. Separating a -1.76-point average from zero would take about 417 trades, which is about 715 sessions, or roughly 2.8 years, at this rule's pace on that chart. A strategy timeframe that fires a few times a month cannot be judged from a month of results, and a fast timeframe that fires often can still be measuring mostly cost and noise. Record the timeframe as part of the strategy, test each candidate chart separately, and decide in advance how many trades you need before you judge it.
Related lesson: Backtesting a trading strategy
Benefits and risks of using multiple timeframes
Using multiple timeframes has clear benefits: it gives direction context to fast entries, puts major levels on the chart before price reaches them, and lets you size a trade off a tight execution-chart stop while trading in the direction of a larger move. It also has risks, and the biggest one is believing that adding a chart automatically adds edge.
An ES test checked that belief directly. A pullback rule (buy the first close back above the 20-period average in an uptrend, sell the mirror image in a downtrend, 1-ATR stop, 2-ATR target) ran on 48 regular-hours sessions from August 27 to November 4, 2026, first alone and then allowed to trade only in the direction of a higher-timeframe trend.
| Execution chart and filter | Trades | Net points per trade |
|---|---|---|
| 5-minute, no filter | 105 | -1.15 |
| 5-minute, daily trend filter | 45 | -1.69 |
| 5-minute, hourly trend filter | 37 | -1.04 |
| 15-minute, no filter | 28 | -1.76 |
| 15-minute, daily trend filter | 11 | +0.16 |
| 15-minute, hourly trend filter | 12 | +1.04 |
On the 15-minute chart the filters lifted the average, and on the 5-minute chart the daily filter made it worse. The intervals behind the filtered 15-minute rows are wide (the hourly-filter row runs from -8.11 to +10.20 points on 12 trades), so the honest reading is that the filters changed the result without proving anything. They also cut the trade count by more than half, which makes any later evaluation slower.
Practical benefits and risks of multiple timeframes
The practical benefits and risks of adding timeframes to a strategy line up like this:
- Benefit, context. The higher chart tells you which pullbacks run with the larger move and which levels price is heading into.
- Benefit, tighter stops. A lower-chart trigger can let you risk less per contract than an entry taken straight off the higher chart.
- Risk, fewer trades. Every filter removes trades, which slows learning and makes every result noisier.
- Risk, filtered winners. Filters remove good trades too. A 15-minute ES long on October 21, 2026 reached its 2-ATR target while both the hourly and daily trend reads pointed down, so either filter would have blocked it.
- Risk, analysis paralysis. Three charts that rarely agree can keep a trader out of every setup, or give them a reason to take any trade they already wanted.
A filter earns its place only when your own test shows it removes more losing trades than winning ones over a sample large enough to trust.
Common timeframe mistakes
Most mistakes with strategy timeframes come from the same impulse: changing the chart to change the answer. It feels like research. It is usually a way to avoid taking a loss you already planned for. The common ones:
- Switching charts mid-trade. Entering on a 5-minute signal, then widening to the hourly chart to justify holding a loser. The stop belonged to the 5-minute chart; when it is hit, the trade is over.
- Treating charts as equal votes. Without a named anchor, two charts that disagree let you take either side, which feels like analysis and works like guessing.
- Mismatched stop and chart. Using an hourly setup with a 5-minute-sized stop, so ordinary hourly noise stops the trade out before the setup has a chance to work.
- Too many charts. Five timeframes rarely say five different things. If a chart never changes a decision you would otherwise make, remove it.
- Copying a strategy without its timeframe. A rule from a video or forum post is incomplete until it states its chart; the same rule can behave very differently on another.
- Judging on a tiny sample. A week of results on a slow chart might be three trades. That is not enough to keep or drop the timeframe.
- Ignoring cost on fast charts. A strategy that looks fine before costs on a 1-minute or 5-minute chart can turn negative once realistic commission and slippage are counted.
Each of these is easier to catch in a trading journal that records the chart behind every entry, stop and exit decision.
Related lesson: How to keep a trading journal
How to choose your strategy timeframes step by step
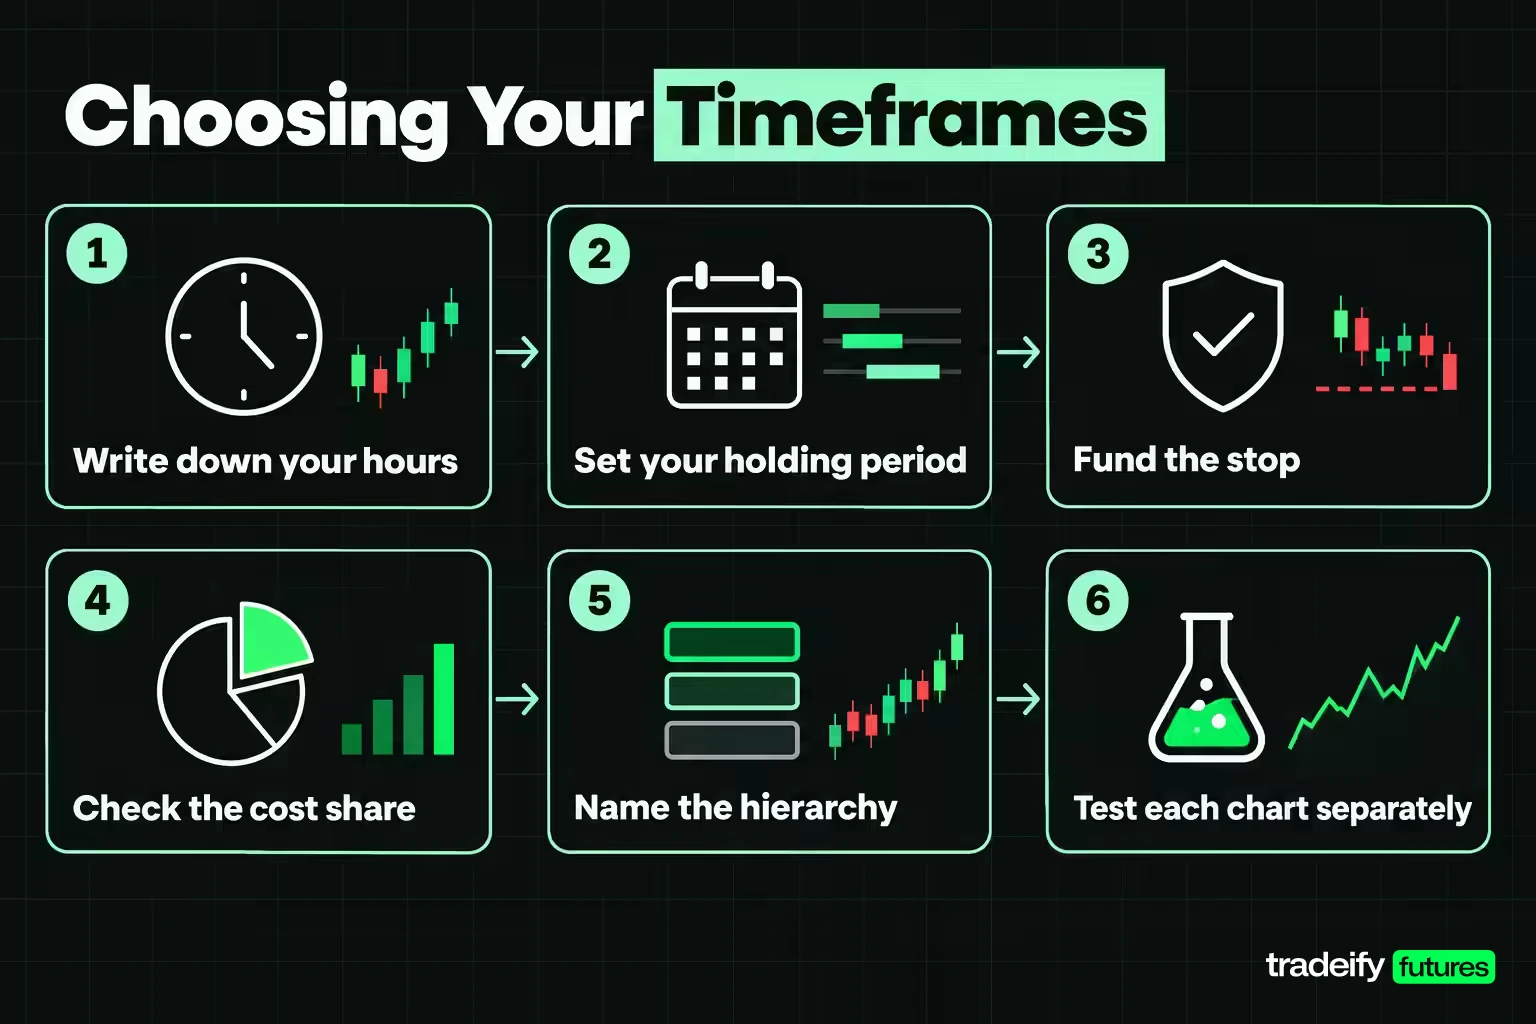
Choosing strategy timeframes comes down to working from your constraints to the chart, then testing the result:
- Write down your hours. Count the hours you can actually watch the market each week and the time of day. That rules out styles before any chart is opened.
- Set your holding period. Minutes, hours, days or weeks. This picks your anchor chart and setup chart.
- Fund the stop. Measure the typical ATR on your candidate execution chart, convert it to dollars per contract, and check how many contracts your fixed dollar risk buys. If the answer is zero, the chart is too slow for the account or the contract is too large.
- Check the cost share. Divide your round-turn cost by the stop. If cost takes a large share of a normal loss, the chart is too fast for the instrument.
- Name the hierarchy. Write which chart sets direction, which finds setups and which triggers entries, and what you do when they disagree.
- Test each candidate chart separately. Run the same rules on each, record the trade count, and calculate how many trades you need before the result means something.
- Commit for the sample. Stay on the chosen pairing until you reach that trade count, rather than changing charts after a few losses.
On our accounts, all positions must be closed by 4:45 PM ET and there are no overnight, weekend or swing holds, so a daily or weekly chart can serve as an anchor for direction but not as a holding period. Our accounts size positions by contract limits (for example, 10 micros or 1 mini on a 25K account, and 40 micros or 4 minis on a 50K account), so the contract count in step 3 also has to fit inside the account's limit. Funded accounts are simulated.
Related lesson: Day trading
Strategy timeframes FAQ
What is the 3-5-7 rule in trading?
The 3-5-7 rule says risk no more than 3% of the account on one trade, no more than 5% across all open trades, and make winners at least 7% larger than losers. It is an informal guideline, not an exchange or regulatory rule, and some versions read the 7 as a 7% profit target. It has nothing to do with chart timeframes, and many risk guides suggest a smaller per-trade figure, such as 1% to 2%.
What timeframe do most traders use?
Intraday traders most commonly execute on the 1-minute to 15-minute charts and check an hourly or daily chart for context. No reliable survey ranks timeframes by popularity, and the answer depends on the style. Swing traders lean on the daily and 4-hour charts, and position traders on the weekly and daily charts.
What is the 3-6-9 rule in trading?
The 3-6-9 rule usually means about 3% risk per trade, 6% total open risk and a 9% profit target. It is an informal guideline with no single definition, and other sources use the same numbers as drawdown limits. Treat it as a prompt to set your own limits in writing before trading.
What is the 5 8 13 21 EMA strategy?
It is a moving-average method built on exponential moving averages of 5, 8, 13 and 21 periods, all Fibonacci numbers. Traders read the averages fanned out in order (5 above 8 above 13 above 21) as an uptrend and the reverse as a downtrend, and use crossovers of the faster averages as entry or exit triggers. Because the periods count bars, the same settings describe very different time spans on a 5-minute and a daily chart.
How many timeframes should you use?
Two or three strategy timeframes is the usual range. Two charts (one for direction, one for timing) cover most strategies, and a third earns its place only if it changes a decision the other two would make. Space them at least three to four times apart so each chart shows something the others do not.
Can a strategy work on one timeframe and not another?
Yes. The same rule has a different trade count, stop size, cost share and holding time on each chart, so its results can differ sharply. In an autumn 2026 ES test, one pullback rule lost money per trade on the 5-minute and 15-minute charts and made money on the 30-minute and hourly charts, with every result inside its own uncertainty. That is why the timeframe belongs in a strategy's written rules.
Trading futures involves substantial risk of loss and is not suitable for everyone. Leverage means losses can exceed the amount you expected to risk, and fast markets can slip past stops. The study results in this guide describe past price behavior on one instrument over a short window; they are illustrative, carry the limits of any backtest, and do not predict future results. Funded and evaluation accounts are simulated. Nothing here is financial advice or a recommendation to take any trade.


