



TL;DR: Forward testing and walk-forward analysis both judge a rule only on data it never saw, so they catch backtests that only look good. Forward testing runs the rule on new prices; walk-forward analysis repeats an optimize-then-test cycle across history. One breakout rule run through 16 walks on 20 years of ES and NQ passed on NQ and failed on ES. Buying and holding the index beat the rule on both, and a 34-session forward test gave two trades per market.
You have a backtest that looks good, and part of you suspects it looks too good. That suspicion is healthy. A backtest you can rerun as often as you like will eventually look good, whether or not the rule has an edge.
Forward testing and walk-forward analysis exist to settle that doubt. Both methods judge a trading rule only on data it did not see when it was built.
They differ in where that unseen data comes from. Forward testing waits for new prices. Walk-forward analysis carves unseen blocks out of history, many times over, so you get a sample instead of a single observation.
This guide explains both methods and then runs them on one fully specified breakout rule, using 20 years of E-mini S&P 500 (ES) and E-mini Nasdaq-100 (NQ) daily bars. The results include a pass, a fail, and a forward test too short to mean anything. That is the realistic mix, and it is more useful than a clean win would be.
Forward Testing and Walk-Forward Analysis Compared
Forward testing means running a fixed rule on market data that did not exist when the rule was written. That can be a live account, a paper or simulated account fed real-time prices, or a prop-firm evaluation. Nobody, including you, knew the outcome when the rule was locked.
Walk-forward analysis is narrower. You optimize a rule's parameters on a block of history (the in-sample window), apply the winning parameters to the block that follows (the out-of-sample window), then slide both windows forward and repeat. Only the out-of-sample blocks count, stitched into one continuous record.
Robert E. Pardo presented walk-forward analysis in his 1992 book Design, Testing and Optimization of Trading Systems and expanded it in a 2008 second edition. The idea has not changed much since: an optimized result means little until it survives data the optimizer never touched.
Backtesting, forward testing and walk-forward analysis answer different questions.
| Method | Question it answers | Observations you get | Main weakness |
|---|---|---|---|
| Backtest | How did this rule do on data I already have | Many, but reusable and easy to overfit | Every rerun lets you fit the rule to the sample |
| Walk-forward analysis | Does an optimizing process pick settings that hold up on the next block | Many out-of-sample trades from one history | Still assumes history resembles the future |
| Forward test | How does the fixed rule do on prices that did not exist yet | One per signal, in real time | Slow, so samples stay small for months or years |
The practical difference is sample size. A rule that signals 13 times a year gives you 13 forward-test observations a year. Walk-forward analysis can produce 200 out-of-sample trades from 20 years of history in an afternoon, at the cost of trusting that the past is a fair test.
Related lesson: Backtesting a trading strategy
In-Sample and Out-of-Sample Data in Walk-Forward Testing
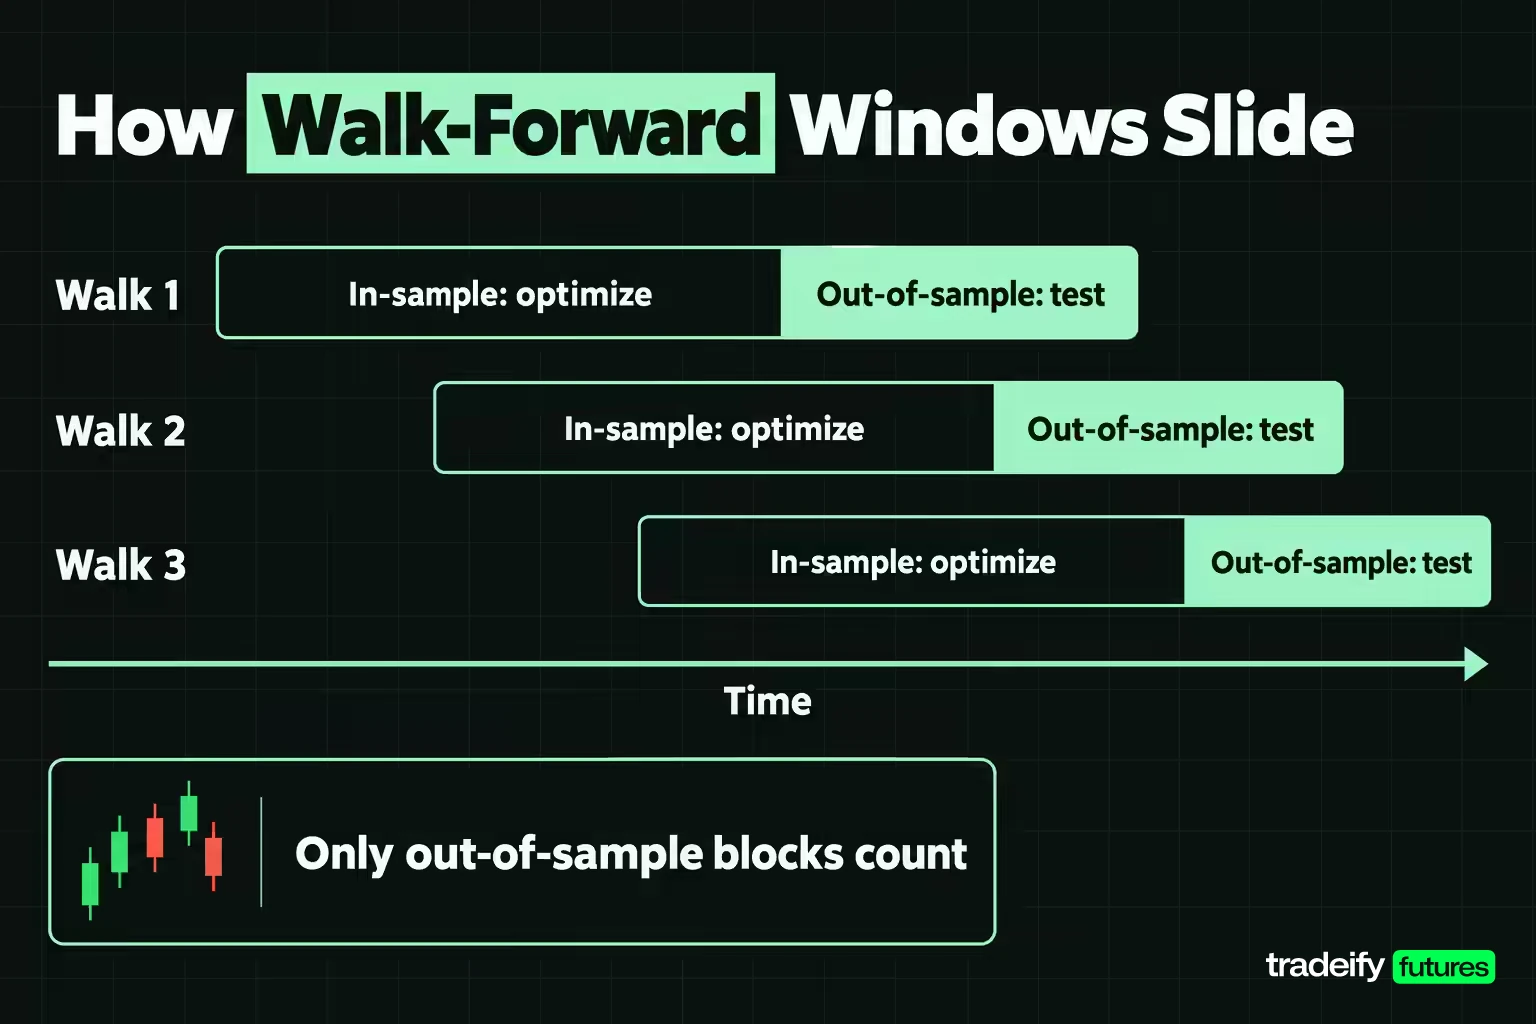
In-sample data is the history a rule is allowed to learn from, where you pick parameters, filters and stops. Out-of-sample data is history the rule is not allowed to see until those choices are frozen. Walk-forward testing is a disciplined way of producing many in-sample and out-of-sample pairs.
The split in walk-forward testing must be chronological. A random split, where some days from 2019 go to testing and the days around them go to training, lets the optimizer learn from prices that came after the ones it is tested on. The scikit-learn documentation for its TimeSeriesSplit tool makes the same point for any time-ordered data: ordinary cross-validation would train on future data and evaluate on past data.
How much data each side gets is a tradeoff:
- A longer in-sample window gives the optimizer more trades to choose from, so the chosen settings are less likely to be noise.
- A longer in-sample window also reaches further into market conditions that may no longer apply.
- A longer out-of-sample window gives each walk more trades to judge, but means fewer walks from the same history.
- A shorter out-of-sample window re-optimizes more often, which suits rules whose behavior drifts, and gives more walks.
One rule matters more than any ratio, and it is the one traders break most often. Out-of-sample data stays out of sample only until you look at it and change something. If you run a walk-forward test, dislike the result, adjust the rule and run it again, the out-of-sample blocks have now helped select the rule. They have become in-sample data, and the report no longer means what it says.
How to Design Walk-Forward Windows
Walk-forward window design comes down to five decisions, and each one moves the answer. Write them down before you run anything.
- In-sample length. It should hold enough trades for the optimizer to separate settings. A daily rule that trades about once a month needs years of in-sample data; an intraday rule may need weeks.
- Out-of-sample length. It should be long enough to contain a handful of trades and short enough that the market has not changed character by the end of it.
- Step size. Stepping by exactly the out-of-sample length makes the out-of-sample blocks touch without overlapping, so every out-of-sample bar is counted once.
- Objective function. What the optimizer maximizes (net profit, expectancy per trade, profit over drawdown) shapes which settings win. Maximizing net profit tends to favor settings that trade often.
- Boundary handling. Decide what happens to a trade still open on the last bar of a window. Either close it at that bar, or let it run into the next window and count it once. Never let it disappear.
The study in this guide uses a 1,000-session in-sample window, a 250-session out-of-sample window and a 250-session step. That is roughly four years of daily data to optimize on and one year to test, with a 4 to 1 ratio. On 5,032 sessions it produces 16 walks.
Those choices left only 7 to 21 trades in each out-of-sample year. That is far too few to judge any single walk, which is why the walks are pooled and why the walk-by-walk record matters as a check on concentration rather than as 16 separate verdicts.
Breakout Rule and Settings for the ES and NQ Walk-Forward Test
A walk-forward result is only useful if someone else could rebuild it. This is the complete specification of the daily breakout rule this guide tests on E-mini S&P 500 (ES) and E-mini Nasdaq-100 (NQ) futures.
- Data. Continuous front-month daily bars for ES and NQ from the Yahoo Finance chart API, September 18, 2006 to September 16, 2026. Each series has 5,041 sessions; 9 bars with missing prices were dropped, leaving 5,032 usable sessions per market.
- Contracts. ES is $50 per index point and NQ is $20 per index point, both with a 0.25-point tick, per CME's contract specifications.
- Signal. On the close of session t, the close is above the highest high of the previous N sessions. N is one of 10, 20, 40 or 60.
- Entry. At the open of the next session. One position at a time.
- Stop. Entry minus k times the 14-session average true range measured at the signal bar. k is one of 0.5, 0.75, 1.0 or 1.5. One R is that stop distance.
- Exits, checked in bar order. If a later session opens below the stop, the fill is that open, because a resting stop becomes a market order. Otherwise, if the low touches the stop, the fill is the stop. Otherwise the trade exits at the close of its H-th session, counting the entry session. H is one of 3, 5 or 10.
- Costs. An assumed 0.58 index points per round turn on ES ($29) and 0.70 points on NQ ($14). Each is 2 ticks of slippage plus $4 of commission, a stated assumption rather than a broker quote.
- Optimization. All 48 combinations of N, k and H are scored on each in-sample window by net expectancy in R. The single best combination trades the next out-of-sample window.
- Protocol. 1,000 sessions in sample, 250 out of sample, stepping 250, for 16 walks. Each walk starts flat; a trade still open on a window's last bar is closed at that bar's close.
The out-of-sample walks run from September 7, 2010 to July 31, 2026. The rule is long only, which matters later: an equity index that rises over time gives any long-only rule a tailwind.
Walk-Forward Performance Metrics to Report
A single walk-forward profit figure hides most of what you need. These are the walk-forward performance metrics worth reporting, with what each one tells you.
- Expectancy in R with a 95% interval and a trade count. Expectancy is the average result per trade in units of initial risk. The interval (mean plus or minus 1.96 standard errors) shows whether zero is a plausible true value. If the interval includes zero, the result is not distinguishable from noise.
- Decay ratio. Out-of-sample expectancy divided by the average in-sample expectancy of the chosen settings. Pardo's book discusses this family of measures as walk-forward efficiency. Below 1 is normal, because the in-sample figure is the best of many tries. At or above 1, suspect luck before skill.
- Random-entry control. Keep the stop, exit and costs, replace the signal with random entry days in the same windows, and match the trade count. If random entries do as well, the signal is not doing the work.
- Share of positive walks and best-walk share. How many walks made money, and how much of the total came from the best one.
- Result without the ten largest winners. A fragile result turns negative when a few outliers are removed.
- Same-window buy-and-hold. What simply holding the market would have done over the same out-of-sample windows.
- Trades needed. The trade count at which the interval would exclude zero, if the observed expectancy and spread held. Divide by trades per year to see how long that takes.
Related lesson: Trading expectancy
Walk-Forward Results on 20 Years of ES and NQ
These walk-forward results come from this guide's own study: one daily breakout rule, 16 walks per market, 20 years of ES and NQ data. All figures are after the stated costs. The control is the average of 200 random-entry runs per walk, matched to the real trade count and using the same parameters, stops and exits.
| Instrument and protocol | OOS trades | Expectancy | 95% interval | Random control | Rule minus control | Rule points | Buy-and-hold points |
|---|---|---|---|---|---|---|---|
| ES rolling | 200 | 0.190R | -0.076R to 0.456R | 0.216R | -0.026R | 1,026 | 6,386 |
| ES anchored | 203 | 0.191R | 0.052R to 0.329R | 0.145R | 0.046R | 2,254 | 6,386 |
| NQ rolling | 208 | 0.475R | 0.137R to 0.813R | 0.229R | 0.246R | 8,334 | 26,396 |
| NQ anchored | 173 | 0.507R | 0.123R to 0.891R | 0.286R | 0.222R | 5,264 | 26,396 |
On NQ the rule passed the first two tests. The rolling interval excludes zero, with a t statistic of 2.75, and the real signal beat random entries by 0.246R per trade. That is evidence the breakout is adding something. It is not evidence of a large edge: about 68% of NQ trades ended at the stop.
On ES under the rolling protocol the rule failed. The interval runs from -0.076R to 0.456R, the t statistic is 1.40, and random entries with the same stops and exits did slightly better than the breakout did. When random entries with your exit rules match your signal, the exits are carrying the result and the signal is decoration. That is an uncomfortable finding, and a cheap one to get before real money is involved.
Buy-and-hold beat the rule on both markets, by 6.2 times on ES rolling and 3.2 times on NQ rolling. That comparison is unfair in one direction, because the rule was in a trade only about 29% of the out-of-sample sessions on ES and 27% on NQ. It is still the right comparison to make. A long-only rule on a rising index earns part of its result from the drift, and the control and buy-and-hold lines are how you separate the drift from the signal.
ES and NQ Walk-Forward Results by Walk
A pooled walk-forward number hides the shape of the sample. In this guide's study, a daily breakout rule was re-optimized on 1,000 sessions and tested on the next 250, 16 times per market, under a rolling window. The tables list each walk's chosen parameters (lookback N, stop multiple k, holding period H), its out-of-sample trades and result, and what holding the same market over the same window did.
NQ Walk-Forward Record, Walks 1 to 8
| NQ walk (walks 1 to 8) | NQ out-of-sample window (walks 1 to 8) | NQ chosen N, k, H (walks 1 to 8) | NQ trades (walks 1 to 8) | NQ expectancy (walks 1 to 8) | NQ rule points (walks 1 to 8) | NQ buy-and-hold points (walks 1 to 8) |
|---|---|---|---|---|---|---|
| 1 | 2010-09-07 to 2011-08-31 | N60, k0.5, H10 | 10 | 0.36R | 87 | 373 |
| 2 | 2011-09-01 to 2012-08-28 | N60, k1.0, H10 | 7 | 1.02R | 226 | 537 |
| 3 | 2012-08-29 to 2013-08-28 | N60, k0.5, H10 | 10 | -0.21R | -9 | 286 |
| 4 | 2013-08-29 to 2014-08-26 | N60, k0.5, H10 | 14 | 1.25R | 362 | 1,004 |
| 5 | 2014-08-27 to 2015-08-24 | N10, k0.5, H10 | 15 | 0.05R | 141 | -70 |
| 6 | 2015-08-25 to 2016-08-19 | N60, k0.5, H10 | 8 | -0.23R | -9 | 809 |
| 7 | 2016-08-22 to 2017-08-21 | N40, k0.5, H10 | 12 | 1.73R | 441 | 985 |
| 8 | 2017-08-22 to 2018-08-17 | N40, k0.5, H10 | 12 | 0.69R | 166 | 1,592 |
NQ walks 1 to 8 (September 2010 to August 2018) made money in six of eight windows, while holding NQ made money in seven. Most of the strongest early walks used tight 0.5 ATR stops and a 10-session holding period.
NQ Walk-Forward Record, Walks 9 to 16
| NQ walk (walks 9 to 16) | NQ out-of-sample window (walks 9 to 16) | NQ chosen N, k, H (walks 9 to 16) | NQ trades (walks 9 to 16) | NQ expectancy (walks 9 to 16) | NQ rule points (walks 9 to 16) | NQ buy-and-hold points (walks 9 to 16) |
|---|---|---|---|---|---|---|
| 9 | 2018-08-20 to 2019-08-16 | N40, k0.5, H10 | 10 | -0.26R | -116 | 221 |
| 10 | 2019-08-19 to 2020-08-13 | N20, k0.5, H10 | 21 | 0.36R | 550 | 3,558 |
| 11 | 2020-08-14 to 2021-08-11 | N20, k0.5, H10 | 18 | 0.15R | 471 | 3,839 |
| 12 | 2021-08-12 to 2022-08-09 | N10, k0.5, H10 | 10 | 1.11R | 1,381 | -1,977 |
| 13 | 2022-08-10 to 2023-08-08 | N10, k0.5, H10 | 16 | -0.06R | -231 | 2,304 |
| 14 | 2023-08-09 to 2024-08-05 | N10, k0.5, H10 | 15 | 1.04R | 1,923 | 2,662 |
| 15 | 2024-08-06 to 2025-08-01 | N10, k0.5, H10 | 15 | 0.17R | 791 | 4,718 |
| 16 | 2025-08-04 to 2026-07-31 | N10, k0.5, H10 | 15 | 0.58R | 2,159 | 5,554 |
Across all 16 NQ walks, 12 made money in points, and the best one (walk 16) supplied 26% of the 8,334-point total. That is reasonably spread out. Even so, removing the ten largest winning trades turns the NQ rolling total into -1,962 points.
ES Walk-Forward Record, Walks 1 to 8
| ES walk (walks 1 to 8) | ES out-of-sample window (walks 1 to 8) | ES chosen N, k, H (walks 1 to 8) | ES trades (walks 1 to 8) | ES expectancy (walks 1 to 8) | ES rule points (walks 1 to 8) | ES buy-and-hold points (walks 1 to 8) |
|---|---|---|---|---|---|---|
| 1 | 2010-09-07 to 2011-08-31 | N10, k1.5, H10 | 12 | 0.34R | 109 | 114 |
| 2 | 2011-09-01 to 2012-08-28 | N40, k1.5, H5 | 11 | 0.01R | 41 | 190 |
| 3 | 2012-08-29 to 2013-08-28 | N10, k1.5, H10 | 14 | 0.06R | 49 | 225 |
| 4 | 2013-08-29 to 2014-08-26 | N10, k1.5, H10 | 15 | 0.14R | 90 | 368 |
| 5 | 2014-08-27 to 2015-08-24 | N10, k0.75, H10 | 9 | -0.16R | 11 | -128 |
| 6 | 2015-08-25 to 2016-08-19 | N20, k0.75, H10 | 11 | -0.15R | 27 | 309 |
| 7 | 2016-08-22 to 2017-08-21 | N10, k0.5, H10 | 13 | 0.73R | 107 | 246 |
| 8 | 2017-08-22 to 2018-08-17 | N10, k0.5, H10 | 18 | 0.92R | 122 | 424 |
ES Walk-Forward Record, Walks 9 to 16
| ES walk (walks 9 to 16) | ES out-of-sample window (walks 9 to 16) | ES chosen N, k, H (walks 9 to 16) | ES trades (walks 9 to 16) | ES expectancy (walks 9 to 16) | ES rule points (walks 9 to 16) | ES buy-and-hold points (walks 9 to 16) |
|---|---|---|---|---|---|---|
| 9 | 2018-08-20 to 2019-08-16 | N40, k0.5, H10 | 10 | 0.15R | 37 | 40 |
| 10 | 2019-08-19 to 2020-08-13 | N40, k0.5, H10 | 13 | 0.68R | 255 | 475 |
| 11 | 2020-08-14 to 2021-08-11 | N40, k0.5, H10 | 19 | -0.12R | -69 | 1,071 |
| 12 | 2021-08-12 to 2022-08-09 | N40, k0.5, H10 | 7 | -0.14R | -23 | -316 |
| 13 | 2022-08-10 to 2023-08-08 | N20, k0.5, H10 | 14 | 0.05R | -109 | 390 |
| 14 | 2023-08-09 to 2024-08-05 | N20, k1.5, H10 | 11 | 0.86R | 680 | 701 |
| 15 | 2024-08-06 to 2025-08-01 | N60, k0.5, H5 | 9 | -0.17R | -35 | 1,014 |
| 16 | 2025-08-04 to 2026-07-31 | N60, k0.5, H5 | 14 | -0.57R | -266 | 1,262 |
Eleven of 16 ES walks made money in points, but walk 14 alone supplied 66% of the 1,026-point total, and removing the ten largest winners turns it into -528. The last two ES walks, during a strongly rising market, both lost.
Market Regimes and Stress Testing in Walk-Forward Results
Market regimes show up clearly in the NQ and ES walk-forward records. NQ walk 12, covering August 2021 to August 2022 and much of the 2022 bear market, is the regime lesson: NQ fell 1,977 points and the rule made 1,381. It was in a trade on only 60 of 250 sessions, made most of its points in the late-2021 rally and a March 2022 rebound, and was stopped out quickly on the failed breakouts in between. A strong walk like that can make a rule look like a hedge. It is one window, so treat it as a hypothesis about falling markets, not a property of the rule.
ES shows the opposite risk: one good year (walk 14) carrying the result, and the most recent windows going the wrong way while the index rose.
Sixteen walks still cover only one path through one 20-year history. A stress test asks what happens in conditions the sample barely contains, such as a fast crash or a long sideways year. Two practical ways to stress test a walk-forward result are to split the walks by market condition (rising, falling, high volatility, low volatility) and to rerun the rule on a related market it was not built on.
Rolling vs Anchored Walk-Forward Windows
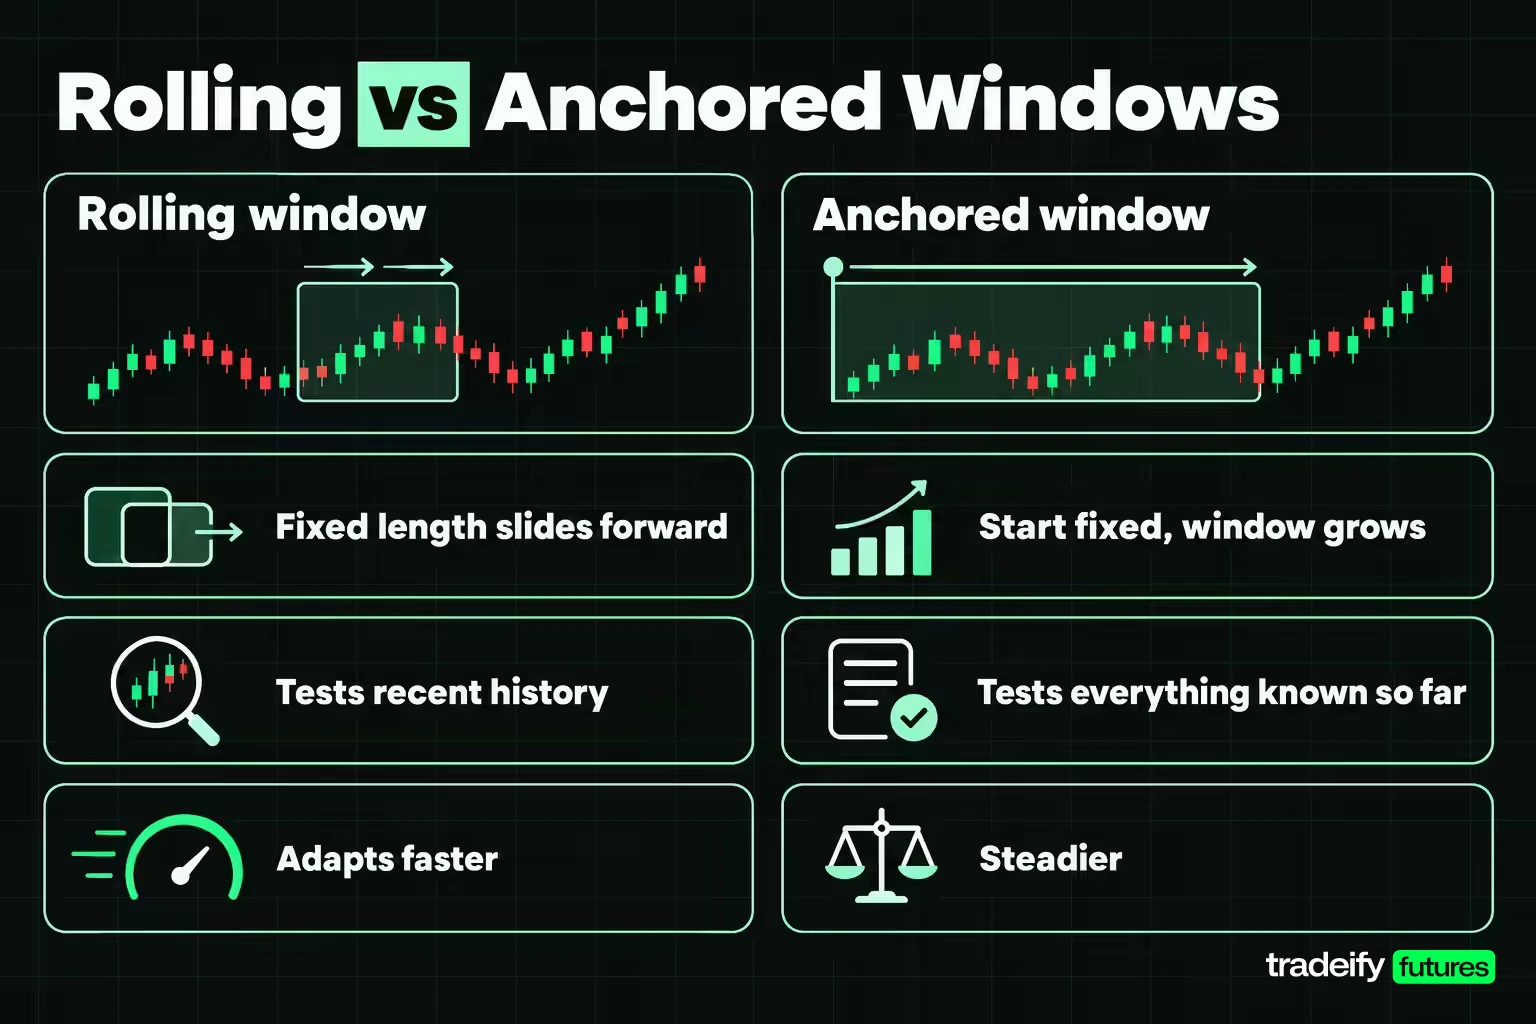
A rolling walk-forward window keeps the in-sample length fixed and slides it forward. Walk 1 optimizes on sessions 1 to 1,000 and walk 2 on sessions 251 to 1,250. An anchored window keeps the start date fixed and lets the in-sample period grow, so walk 2 optimizes on sessions 1 to 1,250.
Rolling asks whether recent history picks good settings. Anchored asks whether everything known so far does. Rolling adapts faster when markets change, and anchored is steadier because each new window adds only a small share of new data.
On this data the two walk-forward protocols disagreed more than you might expect.
| Protocol result | ES rolling | ES anchored | NQ rolling | NQ anchored |
|---|---|---|---|---|
| Out-of-sample trades | 200 | 203 | 208 | 173 |
| Expectancy | 0.190R | 0.191R | 0.475R | 0.507R |
| 95% interval | -0.076R to 0.456R | 0.052R to 0.329R | 0.137R to 0.813R | 0.123R to 0.891R |
| t statistic | 1.40 | 2.70 | 2.75 | 2.59 |
| Average in-sample expectancy | 0.310R | 0.106R | 0.695R | 0.647R |
| Decay ratio | 0.61 | 1.80 | 0.68 | 0.78 |
| Walks with a profit | 11 | 15 | 12 | 10 |
| Trades needed for the interval to exclude zero | 394 | 108 | 106 | 100 |
The ES expectancy is almost identical under both protocols, 0.190R against 0.191R. The intervals are not. The anchored version picked one stable setting with a wider stop, which produced steadier trades and a tighter interval that excludes zero. The rolling version did not.
That is a protocol choice changing a fail into a pass, and it is exactly what a single-protocol report hides. The ES anchored decay ratio of 1.80, where out-of-sample did better than in-sample, is the second warning sign. It points to a favorable sample rather than a property of the method. If you run both protocols and only one passes, treat the rule as unproven.
Parameter Stability Across Walk-Forward Windows
Scoring every parameter combination on each in-sample window lets you watch which one wins, and that history is often more informative than the walk-forward profit figure. In this guide's 20-year ES and NQ breakout study, 48 combinations of lookback N, stop multiple k and holding period H competed in each of 16 walks.
Stable parameters look like this. On NQ under the rolling protocol, the 10-session holding period won all 16 walks and the 0.5 ATR stop won 15 of 16, while the lookback drifted from 60 sessions in the early walks to 10 in the late ones. On ES under the anchored protocol, the same setting (N10, k1.5, H10) won all 16 walks.
Wandering parameters look like the ES rolling record, where the winner jumped between stops of 0.5 and 1.5 ATR and lookbacks of 10, 20, 40 and 60 sessions. When the chosen settings hop between distant corners of the grid, the optimizer is likely fitting noise in each window, and the walk-forward result becomes a statement about the grid rather than about the rule.
A healthy grid also has good neighbors. A setting that wins while the settings next to it lose is a narrow spike, and narrow spikes rarely survive new data. On the full out-of-sample span (September 7, 2010 to July 31, 2026), all 48 settings were positive on both ES and NQ.
That last fact needs a counterweight. A broad positive grid on a rising index is not much of an achievement, because a long-only breakout shares in the index's drift. It is why the random-entry control matters more than grid breadth when a rule is long only.
Overfitting and Curve Fitting in a Walk-Forward Test
Overfitting means a rule has learned the noise in its sample along with any real pattern. Curve fitting is the same thing seen from the other side: parameters tuned until the equity curve looks smooth on the data you have.
The study puts a number on the problem. Suppose you skip walk-forward analysis and simply test all 48 settings on the whole out-of-sample span, September 7, 2010 to July 31, 2026, then report the best one. That hindsight backtest shows 0.245R per trade on ES and 0.620R on NQ.
The honest walk-forward figures for the same span are 0.190R on ES and 0.475R on NQ. Picking the best setting with hindsight overstated the edge by about 29% on ES and 31% on NQ. The median setting, a rough stand-in for picking blind, earned 0.087R on ES and 0.196R on NQ.
The gap between the hindsight best and the walk-forward result is the price of choosing with hindsight. On a rule with a real but modest edge it inflates the estimate. On a rule with no edge, it can manufacture one.
Ways to keep curve fitting in check:
- Use few parameters and coarse grids. Each extra parameter multiplies the number of tries and the chance that one of them looks good by luck.
- Prefer settings in a positive neighborhood over the single best cell.
- Decide the objective function and the window design before seeing results.
- Count how many variants you tried in total, including the ones you discarded, and report it.
- Keep a final block of data untouched until the very end, and use it once.
Related lesson: Overfitting and look-ahead bias
Data Leakage and Selection Bias in Walk-Forward Analysis
Data leakage is any route by which information from the future gets into a decision made in the past. Walk-forward analysis does not prevent it on its own; it only tests whatever rule you hand it.
The common leaks, and how the study rule handles each:
- Same-bar signals. A signal computed on a session's close cannot be filled at that session's open. The study enters at the next session's open.
- Indicator lookahead. The average true range uses the previous close, and the breakout level uses the N sessions before the signal bar, so no part of the signal bar's own range sets its threshold.
- Exit ambiguity on a daily bar. A daily bar does not say whether the high or the low came first. The study assumes the stop is checked first, which is the conservative choice for a long trade.
- Continuous contract rolls. A continuous futures series splices contract months together, and a roll can create a price jump that never traded. In the study, 3 ES trades and 2 NQ trades exited through a gap below the stop; some gaps near a roll may be splicing artefacts rather than prices a trader faced.
- Reruns after peeking. Each time you adjust a rule after seeing out-of-sample results, those results become part of the selection.
Selection bias is the quieter version. It covers choosing the instrument, the time period or the rule family after seeing how they performed. Testing a breakout on NQ because NQ trended strongly over the past decade bakes the answer into the question. In the study, ES and NQ were both tested and both are reported, including the ES failure.
Transaction Costs and Slippage in Walk-Forward Testing
Transaction costs decide whether a modest walk-forward edge exists at all, and they are where a favorable backtest most often breaks. The ladder below reprices the same rolling out-of-sample trades at different round-turn costs. One tick is 0.25 points, or $12.50 on ES and $5 on NQ.
| Round-turn cost in ticks | ES expectancy at that cost | NQ expectancy at that cost |
|---|---|---|
| 4 ticks | 0.168R | 0.467R |
| 8 ticks | 0.115R | 0.443R |
| 12 ticks | 0.062R | 0.418R |
| 20 ticks | -0.043R | 0.369R |
| 40 ticks | -0.307R | 0.245R |
ES made 5.71 points per trade before costs. In points, its edge disappears at a round turn of 5.71 points, or 22.8 ticks (about $285). In R, which weights each trade by its stop distance, it disappears sooner, at about 16.7 ticks. Tight-stop trades carry more weight in R, and they suffer most from costs.
NQ made 40.77 points per trade before costs, so its points breakeven is about 163 ticks. That is the difference between an edge that depends on execution quality and one that does not.
To set a cost assumption, add commission and fees per round turn to a realistic slippage figure for the order type you use. Stop orders that become market orders slip more than limit entries, and slippage widens around major data releases and thin sessions. Then rerun the walk-forward at double that figure. If the result does not survive double your expected cost, it is a statement about your execution as much as about your rule.
Related lesson: Commission-adjusted futures breakeven
Walk-Forward Results in R Multiples vs Dollars
Walk-forward results look different depending on the unit, because the stop distance changes with volatility. In R, every trade risks the same amount. In points or dollars at a fixed contract count, wide-stop trades carry more weight.
In this guide's 20-year ES and NQ breakout study, the NQ 5th-percentile stop was 15.6 points and the 95th percentile was 231.8 points, a spread of about 15 times. At one contract that is a risk per trade of roughly $313 to $4,635. On ES the same range was 8.2 to 63.1 points, about $408 to $3,155 per contract.
The same 208 NQ out-of-sample trades made $166,671 at one contract each, before any sizing, and $24,695 when every trade risked a fixed $250. The ES walk record shows the unit problem in single walks too: walk 13 was positive in R (0.05R) and negative in points (-109), while walks 5 and 6 were negative in R and positive in points.
Report both, and report the stop range. A fixed-risk figure is closer to what an account with a loss limit experiences, because position size has to shrink when stops widen.
Related lesson: Volatility-based position sizing
Walk-Forward Optimization vs Walk-Forward Testing
Walk-forward optimization re-optimizes the parameters in every in-sample window and trades the winner in the next out-of-sample window. That is what the study does. It tests a process (this rule plus this optimizer plus this window design), and the parameters you would trade tomorrow are whatever the latest window chose.
Walk-forward testing in the narrow sense fixes one parameter set in advance and simply runs it through every out-of-sample window. It tests a single rule, not an optimizer, and it is the closer match to what a forward test does.
Which to use depends on how you intend to trade:
- If you plan to re-optimize on a schedule, use walk-forward optimization with the same schedule, so the test matches what you will actually do.
- If you plan to trade one fixed setting, use fixed-parameter walk-forward testing, and choose the setting from the first in-sample window or from theory rather than from the whole history.
- If the two give very different answers, the rule depends on re-optimization to work, which is worth knowing before you trade it.
Walk-Forward Analysis vs Other Validation Methods
Walk-forward analysis is one of several ways to check a backtest, and each catches a different failure.
| Validation method | What it checks | What it misses |
|---|---|---|
| Single in-sample and out-of-sample split | Whether one optimized setting holds on one later block | Gives one out-of-sample result, which can be luck |
| Walk-forward analysis | Whether an optimizing process holds up across many later blocks | Uses one historical path; vulnerable to reruns after peeking |
| K-fold cross-validation with random folds | Stability of a model across subsets of data | Leaks future data into training when the data is a time series |
| Monte Carlo resampling of trades | Range of drawdowns and outcomes from reordering the same trades | Assumes the trades themselves are representative |
| Testing on other markets | Whether the idea works beyond the market it was built on | Markets can differ for real reasons, so a fail is not always a flaw |
| Forward test on a simulated or live account | Behavior on genuinely new prices, plus your execution | Slow; small samples for a long time |
These checks stack. Walk-forward analysis tells you whether the process survives history. Monte Carlo tells you what drawdown range to expect from those trades. A forward test tells you whether you and your fills match the model.
Forward Testing a Strategy After the Walk-Forward
Forward testing is where a rule meets prices nobody had seen. This guide's walk-forward study of a daily breakout rule on ES and NQ used data up to September 16, 2026, so the sessions after that date make a genuine forward test.
A 34-Session Forward Test on ES and NQ
The breakout rule was re-optimized one more time on the latest in-sample window and then run on the 34 sessions from September 17 to November 3, 2026. On ES the rolling optimizer chose N10, k0.75, H10; on NQ it chose N20, k0.5, H10. Each market produced 2 trades, and all four trades were stopped out for about -1R each.
Four straight losses on a new rule are exactly when the urge to tweak it kicks in. The data says to hold off: the result says almost nothing. With about 68% of NQ trades stopping out across the walk-forward sample, two stops in a row would happen about 46% of the time even if the rule's edge were real. On ES, with about 57% stopped, the chance is about 32%. Two trades cannot confirm a rule and cannot reject one.
How Long a Forward Test Should Run
How long a forward test needs is a calculation. Take your expectancy in R and the standard deviation of trade results, and find the trade count at which the 95% interval would exclude zero. For NQ rolling that is about 106 trades, roughly 8 years at 13 trades a year. For ES rolling it is 394 trades, about 31 years. If the answer is longer than you are willing to wait, the rule is unproven rather than promising, and a faster-trading version of the idea may be easier to test.
Keeping a Forward Test Honest
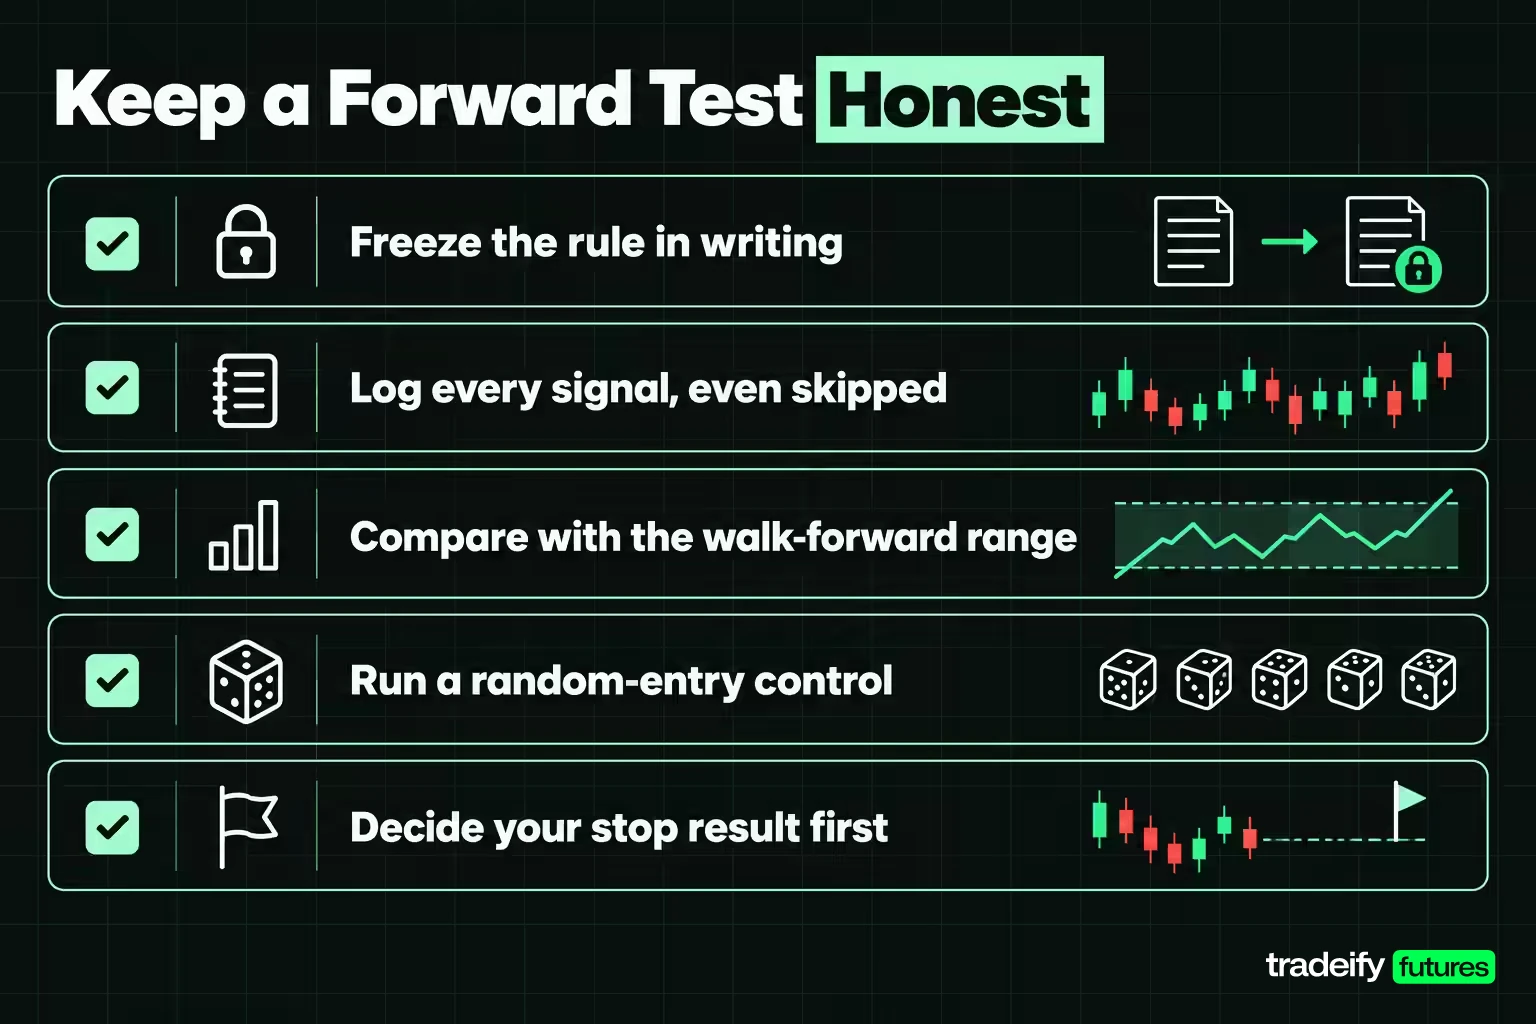
Keep a forward test honest:
- Freeze the rule, parameters and cost assumption in writing before the first trade.
- Log every signal, including ones you skip, with the model price and your actual fill.
- Compare forward results with the walk-forward distribution, not with the best walk.
- Run the random-entry control alongside it on the same days.
- Decide in advance what result would make you stop.
On our accounts at Tradeify, evaluations and Sim Funded accounts are simulated, and all positions must be closed by 4:45 PM ET, so a rule that holds for up to 10 sessions, like the one in this guide, could not be forward tested on our accounts as written; it would need an intraday version. Algorithms are allowed when you own the strategy exclusively, it is not shared, and it is not high-frequency trading.
Related lesson: Practice with paper trading
Forward Testing and Walk-Forward Analysis FAQ
What is forward testing?
Forward testing runs a fixed trading rule on prices that did not exist when the rule was written, on a live, paper or simulated account. The outcome was unknown when the rule was locked, which makes the result honest. It is also slow, because you get one observation per signal.
What is the difference between backtesting and forward testing?
A backtest runs a rule over historical data you already have, and you can change the rule and rerun it as often as you like. A forward test runs it on new data, once, with no chance to revise. Backtests give large samples that are easy to overfit; forward tests give small samples that are hard to fool.
What is forward walk cross validation?
Forward walk cross validation is walk-forward analysis described in machine-learning terms. Data is split into successive training and test blocks in time order, the model is fitted on each training block and scored only on the test block that follows. Forward chaining is another name for it.
Does walk-forward analysis eliminate overfitting?
No. It reduces the chance of mistaking a fitted result for a real one and catches crude overfitting well. It cannot catch overfitting that happens when you rerun the analysis after seeing out-of-sample results, because those results have then been used for selection.
How long should a forward test run?
A forward test should run until the 95% interval on its expectancy excludes zero, which depends on your edge and trade frequency. In a 20-year walk-forward test of a daily breakout rule, NQ needed about 106 trades and ES needed 394. If that would take years, consider a faster-trading version of the idea or treat the rule as unproven.
What is a good walk-forward efficiency?
No single walk-forward efficiency is good everywhere, but a ratio somewhat below 1 is normal, because in-sample figures are the best of many tries. Far below 1 suggests the optimizer is fitting noise, and a ratio at or above 1 on a short sample more likely reflects luck than skill.
Forward Testing and Walk-Forward Analysis Checklist
Run these forward testing and walk-forward checks in order, and stop at the first clear failure. The brackets give the answers from this guide's 20-year walk-forward study of one daily breakout rule on ES and NQ.
- Does the 95% interval on out-of-sample expectancy exclude zero? (NQ yes; ES rolling no.)
- Does the real signal beat a random-entry control with the same stops, exits and costs? (NQ by 0.246R; ES rolling no.)
- Does the result survive double your expected cost? (Both yes; ES turns negative by 20 ticks.)
- Is the result still positive without the ten largest winners? (No, on both markets.)
- Do the chosen parameters stay in one region, with positive neighbors? (NQ mostly; ES rolling no.)
- Do rolling and anchored protocols agree? (NQ yes; ES no.)
- Is out-of-sample expectancy below in-sample expectancy? (Yes except ES anchored, which suggests luck.)
- Has a forward test run long enough to say anything? (No; 34 sessions gave 2 trades per market.)
By this list, NQ passed the core tests but leans on outliers, and ES failed. That is a useful outcome, not a wasted afternoon. A walk-forward analysis is the cheapest way to learn a rule is not special, and it is far cheaper than learning it in a live account.
Your next step: take the rule you trade now, split its history into 1,000 sessions in and 250 out, and compute two numbers first, your out-of-sample expectancy in R and the same figure for random entries with your stops and exits. If the second is larger, build a different signal before you build another filter.
This guide is educational and is not investment advice. Every figure is a historical simulation of a stated rule on continuous futures price data, not a record of real trades, and past or simulated results do not predict future results. Futures are leveraged, losses can exceed what you expect, and simulated or evaluation accounts do not reproduce live fills or the rules that apply to live trading.


