




TL;DR: Parabolic SAR is a trailing stop that flips sides when price crosses it, so its real job is managing exits, not picking entries. Each dot closes in on price by an acceleration factor that starts at 0.02 and caps at 0.20. On 504 daily E-mini S&P 500 bars, taking all 51 flips lost 447 points while the index rose 1,918.50. Use the dot to trail and size risk, and filter flips with a trend-strength tool such as ADX.
The Parabolic SAR looks like the easiest indicator on the chart. Dots under price, you are long. Dots over price, you are short. When the dots jump sides, you reverse. That simplicity is exactly why traders get caught by it, because a clean-looking signal hides three costs that only show up when you count every flip: whipsaw in sideways markets, profit handed back at each turn, and stop distances that swing wildly from one trade to the next.
This guide walks through what the Parabolic SAR plots, the full calculation with a worked flip on real E-mini S&P 500 bars, what each setting changes, and how the stop and reverse rule performed when every flip over 504 trading days was priced under one fixed rule. The goal is not to sell you on the indicator or talk you out of it. It is to show you where it earns its place and where it quietly costs money.
What Is the Parabolic SAR
The Parabolic SAR is a trend-following indicator that plots a trailing stop level for every bar and flips to the other side of price when that level is hit. SAR stands for "stop and reverse," which describes the original rule: when price reaches the stop, you exit the trade and open one in the opposite direction.
On a chart, the Parabolic SAR gives you two outputs:
- A stop level, one dot per bar, that you can trail behind an open position.
- A direction label: dots below price mark an uptrend, dots above price mark a downtrend.
What the Parabolic SAR does not give you is trend strength. TradingView's documentation puts it plainly: because the indicator is time and price based, it is not adept at measuring the actual strength of a trend, merely its direction and duration. A strong trend and a weak drift can carry the same row of dots until the moment the weak one fails.
The name "parabolic" comes from the shape the dots trace during a strong trend. They start far from price and curve toward it faster and faster as the trend extends, like a parabola. Wikipedia's summary of the idea is that "time is the enemy": unless a position keeps making progress, the stop keeps closing in until it is taken out.
Where the Parabolic SAR Came From
J. Welles Wilder Jr. introduced the Parabolic SAR in his 1978 book New Concepts in Technical Trading Systems, where he called it the Parabolic Time/Price System. The "time" in that name matters: the stop tightens as a trend ages and makes new extremes, so a position that stops making progress is eventually closed.
The same book introduced the Relative Strength Index, Average True Range and the Directional Movement concept behind ADX, which is why the Parabolic SAR and ADX are so often used together. StockCharts points out that Wilder's indicators were developed before the computer age, which explains why the Parabolic SAR is a simple step-by-step recurrence you can work by hand, one bar at a time.
Related lesson: Average directional index ADX
Reading Parabolic SAR Dots and Flips
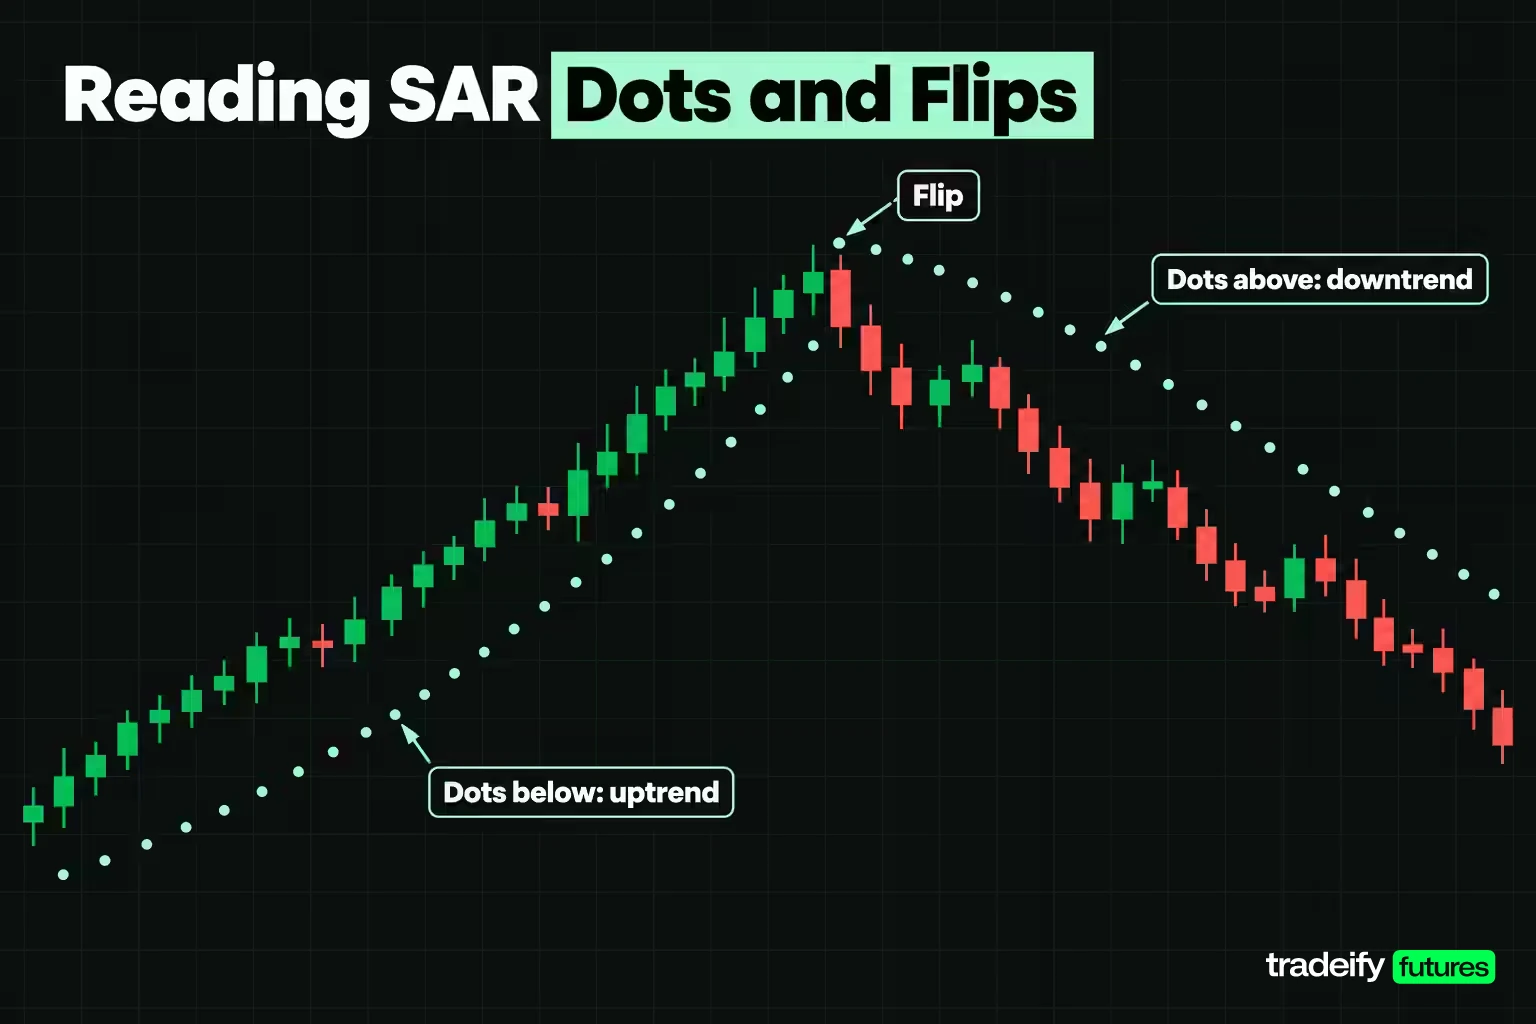
Reading the Parabolic SAR comes down to three things: which side of price the dots sit on, how fast they are moving, and whether a flip has actually been confirmed.
Side of price. Dots below the bars mean the indicator is in uptrend mode and the dot is the long stop. Dots above the bars mean downtrend mode and the dot is the short stop. There is no neutral state. The Parabolic SAR is always either long or short, which is the first thing to remember in a sideways market.
Spacing. Early in a new trend, the dots sit far from price and move slowly. As the trend makes new extremes, the dots accelerate toward price and the gap tightens. Wide, slow dots mean the stop is loose and the trend is young or stalling. Tight, fast dots mean the trend has run and the stop is close enough that an ordinary pullback can trigger it.
The flip. A flip happens when price penetrates the current dot. The next dot then appears on the opposite side, starting at the extreme of the trend that just ended. That is the moment the stop and reverse rule says to exit and turn around.
Two cautions matter when you read Parabolic SAR flips live:
- A dot for each bar is calculated one period in advance from data you already have, so a finished dot does not move. What changes on a live chart is whether the current bar has touched it yet.
- An intrabar touch and a bar that closes through the dot are different events. Wilder's original rule treats the dot as a stop that triggers on contact. Many traders wait for the bar to close beyond it before acting. Pick one convention, write it down, and test with it, because the two give different fills.
A flip tells you the old trend's trailing stop was hit. It does not tell you a new trend has started. On 504 daily E-mini S&P 500 bars (Yahoo Finance ES=F data, calculated for this guide), flips that ended uptrends served longs well, while the short trades those same flips opened won only 16.00% of the time.
Parabolic SAR Formula and Calculation
The Parabolic SAR calculation carries three values forward from bar to bar: the previous SAR, the extreme point and the acceleration factor.
- Extreme point (EP): the highest high reached during the current uptrend, or the lowest low during the current downtrend. It updates only when a bar makes a new extreme in the direction of the trend.
- Acceleration factor (AF): starts at 0.02, rises by 0.02 each time the extreme point updates, and stops rising at a maximum of 0.20 by default. Starting from 0.02, the factor reaches 0.20 after nine new extremes.
- Previous SAR: the last published dot.
The core formula is:
Next SAR = Current SAR + AF x (EP - Current SAR)
In an uptrend, EP sits above the SAR, so the gap is positive and the dot steps up. In a downtrend, EP sits below the SAR, the gap is negative and the dot steps down. Because the step is a fixed fraction of a gap that widens when price runs away, the dots can sit nearly still at the start of a trend and then race toward price once the trend extends.
When a bar penetrates the SAR, the trend flips:
- The new SAR is set to the old extreme point (the highest high of the uptrend that just ended, or the lowest low of the downtrend).
- The extreme point resets to the current bar's low for a new downtrend, or its high for a new uptrend.
- The acceleration factor resets to 0.02.
The Two Clamp Rules That Hold the Parabolic SAR Back
The Parabolic SAR formula alone can push the dot inside recent price action, so Wilder added a limit. In an uptrend, the new SAR may never sit above the lows of the previous two bars; if the formula lands there, the dot is set to the lower of those two lows. In a downtrend, the new SAR may never sit below the highs of the previous two bars; if it does, it is set to the higher of those two highs.
That clamp is why the dots sometimes pause or move unevenly instead of marching in a smooth curve. It also means a Parabolic SAR built in a spreadsheet without the clamp will drift from the value on your charting platform after a few bars.
Why the Starting Bar Changes Early Parabolic SAR Values
Wilder's book gives no exact rule for the first bar of a data set, so platforms make their own choice. TradingView, for example, compares the first two closes to decide the opening direction, then seeds the first SAR with the first bar's low (if up) or high (if down). Other platforms may make a different choice.
The practical effect is that two charts of the same contract can show different Parabolic SAR dots until the first flip. On E-mini S&P 500 daily bars from Yahoo Finance's ES=F series, a calculation started fresh on September 16, 2024 put the dot for September 17, 2024 at 5609.25. The same calculation run over three years of earlier history put it at 5417.33, almost 192 points lower. The two versions only matched from the flip on October 2, 2024 onward, because a flip resets the dot to the prior extreme and wipes out the starting difference.
If your platform or backtest starts from a short history, ignore the dots before the first flip.
A Worked Flip on E-mini S&P 500 Daily Bars
This worked Parabolic SAR example uses twelve real daily bars of E-mini S&P 500 futures (Yahoo Finance's continuous ES=F series) from September 2024, with default settings of 0.02 start, 0.02 increment and 0.20 maximum, starting the calculation on September 16, 2024. Each row shows the dot for that bar, and the acceleration factor and extreme point after that bar.
| Date | High | Low | SAR | Acceleration factor | Extreme point | Low minus SAR |
|---|---|---|---|---|---|---|
| 2024-09-17 | 5675.50 | 5617.00 | 5609.25 | 0.02 | 5675.50 | 7.75 |
| 2024-09-18 | 5696.25 | 5613.75 | 5609.25 | 0.04 | 5696.25 | 4.50 |
| 2024-09-19 | 5737.50 | 5631.50 | 5612.73 | 0.06 | 5737.50 | 18.77 |
| 2024-09-20 | 5717.25 | 5699.25 | 5613.75 | 0.06 | 5737.50 | 85.50 |
| 2024-09-23 | 5784.50 | 5745.25 | 5621.18 | 0.08 | 5784.50 | 124.07 |
| 2024-09-24 | 5794.25 | 5754.75 | 5634.24 | 0.10 | 5794.25 | 120.51 |
| 2024-09-25 | 5798.75 | 5768.00 | 5650.24 | 0.12 | 5798.75 | 117.76 |
| 2024-09-26 | 5830.00 | 5778.25 | 5668.06 | 0.14 | 5830.00 | 110.19 |
| 2024-09-27 | 5821.50 | 5782.00 | 5690.73 | 0.14 | 5830.00 | 91.27 |
| 2024-09-30 | 5820.25 | 5756.25 | 5710.23 | 0.14 | 5830.00 | 46.02 |
| 2024-10-01 | 5822.50 | 5733.00 | 5727.00 | 0.14 | 5830.00 | 6.00 |
| 2024-10-02 | 5773.25 | 5724.00 | 5830.00 | 0.02 | 5724.00 | -106.00 |
Reading the Worked SAR Flip Step by Step
Three things in this E-mini S&P 500 SAR sequence from September and October 2024 are worth slowing down for.
The clamp at work. On September 20, 2024, the formula gave 5612.73 + 0.06 x (5737.50 - 5612.73) = 5620.22. The lower of the two previous lows was 5613.75, so the dot was clamped down to 5613.75. The stop moved up by about one point on a day when the formula alone wanted almost eight.
The gap growing, then shrinking. The buffer between the bar's low and the dot went from 7.75 points on September 17 to 124.07 points on September 23, because price ran away faster than the dot could follow. Then the acceleration factor climbed to 0.14 and the extreme point stopped rising, so the dot closed in while price drifted, and the buffer fell to 6.00 points by October 1.
The flip itself. For October 2, the projection was 5727.00 + 0.14 x (5830.00 - 5727.00) = 5741.42. The lower of the two previous lows was 5733.00, so the dot was clamped to 5733.00. That day's low of 5724.00 went through 5733.00, so the uptrend ended. The new dot became the old extreme point at 5830.00, the factor reset to 0.02, and the new extreme point started at 5724.00.
Priced at the next bar's open, the long leg that began at the September 17 open of 5633.25 exited at 5769.50 on October 3, a gain of 136.25 points. On one Micro E-mini S&P 500 contract, at $5 per index point, that is $681.25. Its best open profit had been 196.75 points, at the 5830.00 high, so the flip handed back roughly a third of what the leg had shown. That giveback is not a flaw in this one trade; it is how every SAR exit works, because the stop is only reached after price has already turned.
Parabolic SAR Settings and What Each Input Does
Most platforms expose three Parabolic SAR inputs: the starting acceleration factor (often called Start or Step), the increment it rises by on each new extreme, and the maximum. The defaults on TradingView are 0.02, 0.02 and 0.20, and StockCharts uses the same 0.02 step and 0.20 maximum.
- Start and increment: a higher value moves the SAR closer to price faster, which means more reversals and earlier exits. A lower value keeps the SAR farther away, which means fewer reversals and more room for pullbacks. StockCharts warns that a step set too high produces whipsaws and fails to capture the trend.
- Maximum: caps how close the SAR can chase price late in a trend. StockCharts notes that lowering the maximum reduces sensitivity and produces fewer reversals, but that the step carries more weight because it sets how quickly the factor rises.
Wikipedia's summary adds a common convention: some traders prefer 0.01 for stocks and 0.02 for commodity or currency markets. Treat that as a starting point, not a rule. The right setting depends on how the instrument you trade actually moves.
Six Parabolic SAR Settings Tested on the Same 504 Days
To see how much the settings matter, the same 504 daily ES=F bars (September 16, 2024 to September 16, 2026) were run through six combinations. Every flip was priced at the next bar's open, always in the market, one contract, before commissions and slippage.
| Start and increment | Maximum | Flips | Win rate | Net points | Net on one MES | Profit factor | Max drawdown points |
|---|---|---|---|---|---|---|---|
| 0.01 | 0.20 | 35 | 25.71% | -1,245.25 | -$6,226.25 | 0.67 | 1,649.25 |
| 0.02 | 0.20 | 51 | 35.29% | -447.00 | -$2,235.00 | 0.87 | 1,133.00 |
| 0.03 | 0.20 | 61 | 47.54% | 612.75 | $3,063.75 | 1.22 | 958.00 |
| 0.04 | 0.20 | 73 | 39.73% | -331.75 | -$1,658.75 | 0.91 | 1,523.00 |
| 0.02 | 0.10 | 43 | 27.91% | -1,176.50 | -$5,882.50 | 0.68 | 1,677.25 |
| 0.02 | 0.40 | 51 | 35.29% | -447.00 | -$2,235.00 | 0.87 | 1,133.00 |
The tempting conclusion is that 0.03 is the "best" Parabolic SAR setting for ES. Resist it. One instrument, one window, and a 0.01 change in the step turned the result from a loss to a gain and back to a loss again at 0.04. That pattern is what noise looks like. A setting that only works in a narrow band on one sample is far more likely to be fitted to that sample than to have found an edge.
The maximum behaved differently than most discussions suggest. Raising it from 0.20 to 0.40 changed nothing that decided a trade, because only 4 of the 52 legs in the window ever reached the 0.20 cap at all. On the 19 bars where those legs ran past the cap, the dot sat up to 41.82 points closer to price, but every flip, every direction and every priced result stayed the same. Lowering the maximum to 0.10 did change things: 43 flips instead of 51, consistent with StockCharts' description, and a worse result on this sample.
Related lesson: Backtesting a trading strategy
How to Trade With the Parabolic SAR
There are two basic ways to trade with the Parabolic SAR on its own, and they carry very different risk.
Always in (stop and reverse). This is Wilder's original system. You are long while the dots sit below price and short while they sit above. Every flip closes one trade and opens the opposite one. You are never flat, which means you are also always exposed in sideways markets.
Exit only. You choose entries with something else (a breakout, a pullback to a moving average, a higher-timeframe trend) and use the SAR purely as the trailing stop. When it flips against you, you exit and wait for your next entry signal instead of reversing.
Whichever you use, set these rules before you trade:
- Fill convention. Decide whether you act on an intrabar touch of the dot, on the close of a bar beyond it, or at the next bar's open. In a 504-day audit of default SAR flips on E-mini S&P 500 daily bars (Yahoo Finance ES=F data, calculated for this guide) that waited for the close and filled at the next open, 22 of the 51 exits filled at a worse price than the dot itself.
- Direction filter. Decide whether you take both sides or only flips in the direction of a larger trend.
- Size from the dot. Measure the distance from your entry to the dot in points before choosing contracts, so dollar risk stays steady even when the stop distance does not.
- What invalidates the trade. In stop and reverse mode the dot is the only exit. In exit-only mode, write down what else ends the trade, such as a time stop or a session close.
Pre-Trade Checklist for a Parabolic SAR Flip
Run this check before acting on any Parabolic SAR flip:
- Is the market actually trending, or has it been chopping sideways? A flip needs follow-through to pay.
- How far is the dot from your entry, in points and in dollars on your contract?
- Does the flip agree with the trend on a higher timeframe?
- How much open profit are you prepared to give back before the stop is reached?
- What happens if the market opens beyond the dot?
Results of the 504 Day Flip Audit
The flip audit applied the default Parabolic SAR (0.02, 0.02, 0.20) to 504 daily bars of the continuous E-mini S&P 500 futures series from Yahoo Finance (ES=F), from September 16, 2024 to September 16, 2026. The calculation started fresh on the first bar. Each flip was confirmed at the close of the bar that penetrated the dot, the old leg exited at the next bar's open, and the new leg entered at that same open. The first leg entered at the open of the second bar. The final leg, still open at the end of the window, is not counted. Figures are in index points, with dollars on one Micro E-mini S&P 500 (MES) contract at $5 per point, before commissions and slippage.
| Measure | Result |
|---|---|
| Bars audited | 504 daily bars |
| Flips and closed trades | 51 |
| Winners | 18 of 51, a 35.29% win rate |
| Average win | 169.72 points, $848.60 on one MES |
| Average loss | -106.12 points, -$530.60 on one MES |
| Net result | -447.00 points, -$2,235.00 on one MES |
| Profit factor | 0.87 (3,055.00 points won against 3,502.00 lost) |
| Maximum drawdown | 1,133.00 points, $5,665.00 on one MES |
| Long legs | 26 legs, 53.85% winners, 810.50 points |
| Short legs | 25 legs, 16.00% winners, -1,257.50 points |
| Median leg length | 9 bars |
| Index change, close to close | 1,918.50 points, $9,592.50 on one MES |
What the SAR Flip Audit Results Show
The headline from this Yahoo Finance ES=F calculation is uncomfortable, and it is the most useful number in the study. Over a window in which ES rose 1,918.50 points from close to close, taking every Parabolic SAR flip lost 447 points. A trader who simply held a long would have done far better than one who followed every dot. The long side made money, winning 53.85% of the time for 810.50 points. The short side won only 16.00% of the time and lost 1,257.50 points, more than wiping out the longs.
That split is the story of a rising market. Every time an uptrend paused, the SAR flipped short, and most of those shorts were stopped out when the uptrend resumed. The indicator did not misread anything. It did exactly what it is built to do, and in a market that trended up with frequent pauses, that meant paying for a lot of short trades that never got going.
How Much the Parabolic SAR Audit Depends on One Trend
The Parabolic SAR audit's best leg was a 29-bar long entered on April 8, 2026, which made 734.50 points and captured 86.3% of an 851-point move. Without that single trade, the other 50 trades lost 1,181.50 points. Without the best two, the rest lost 1,740.25 points.
The result also changed sign between years. Trades entered in the first year of the window (September 16, 2024 to September 15, 2025) made 542.25 points across 29 trades. Trades entered in the second year lost 989.25 points across 22 trades.
That is normal for a trend-following rule. A few large trends pay for many small losses, and whether a given year contains one of those trends decides the result. It also means a short backtest of the Parabolic SAR can look excellent or awful depending on which window you happened to pick. Read this audit as one instrument, one 24 month window, one fill convention and one setting. It shows how the flip rule behaves, not what it will do next.
Trading Trend Reversals With Stop and Reverse Flips
Trend reversal trading with the Parabolic SAR rests on one question: does a flip mark the end of a trend, or the start of a new one? On 504 daily E-mini S&P 500 bars (September 2024 to September 2026), the answer was clear: it is much better at the first than the second.
As a trend-ending signal, the flip works as designed. It trails an uptrend and gets you out once price has pulled back far enough to touch the stop. In that sample, the 26 long legs it ended made 810.50 points between them.
As a trend-starting signal, the flip is weaker. On ES daily bars, the short entries created by flips won only 16.00% of the time. Most of those flips caught a pause in a rising market, not a genuine reversal. StockCharts cites Wilder's own estimate that markets trend only about 30% of the time, which is why a rule that is always in the market spends much of its time reversing inside ranges.
A more careful way to trade trend reversals with the SAR:
- Treat a flip against your position as an exit, not an automatic reverse.
- Take the reversal trade only when other evidence agrees: a break of a prior swing low or high, a higher-timeframe trend change, or a rising trend-strength reading.
- Expect the first dot after a flip to be far away, because it starts at the prior trend's extreme. If that distance is more risk than you accept, skip the reversal or wait for the dot to close in.
- Be most skeptical of flips that go against the larger trend. In the audit, that was the short side.
Related lesson: Multiple timeframe analysis
Parabolic SAR Breakout Trading
Parabolic SAR breakout trading pairs a price breakout with a flip in the same direction. The breakout supplies the reason to enter, and the flip confirms that the trailing stop now sits on the right side.
A typical setup looks like this:
- Price builds a range or consolidation, and the SAR flips back and forth inside it. Those flips are noise; do not trade them.
- Price closes beyond the range high (or low).
- The SAR is already on the breakout side, or flips to it on the breakout bar.
- Entry comes on the breakout or the next open. The initial stop is the SAR dot or the far side of the range, whichever risk plan you set beforehand.
The catch is the distance to the first dot. After a flip, the SAR restarts at the previous trend's extreme, which is often on the far side of the whole range. In a 504-day audit of default SAR flips on E-mini S&P 500 daily bars, (Yahoo Finance ES=F data, calculated for this guide), the median distance from the entry price to the dot after a flip was 152.66 points, $763.30 on one MES contract. That stop is wide right when the breakout is youngest and most likely to fail.
Two ways to handle it:
- Use the range's opposite boundary or the breakout bar's low as the initial stop, then switch to the SAR once the dot has moved inside that level.
- Size the position to the distance from the entry to the dot, so a wide first dot means fewer contracts, not more dollars at risk.
Related lesson: Breakout trading
Using the Parabolic SAR as a Trailing Stop Loss
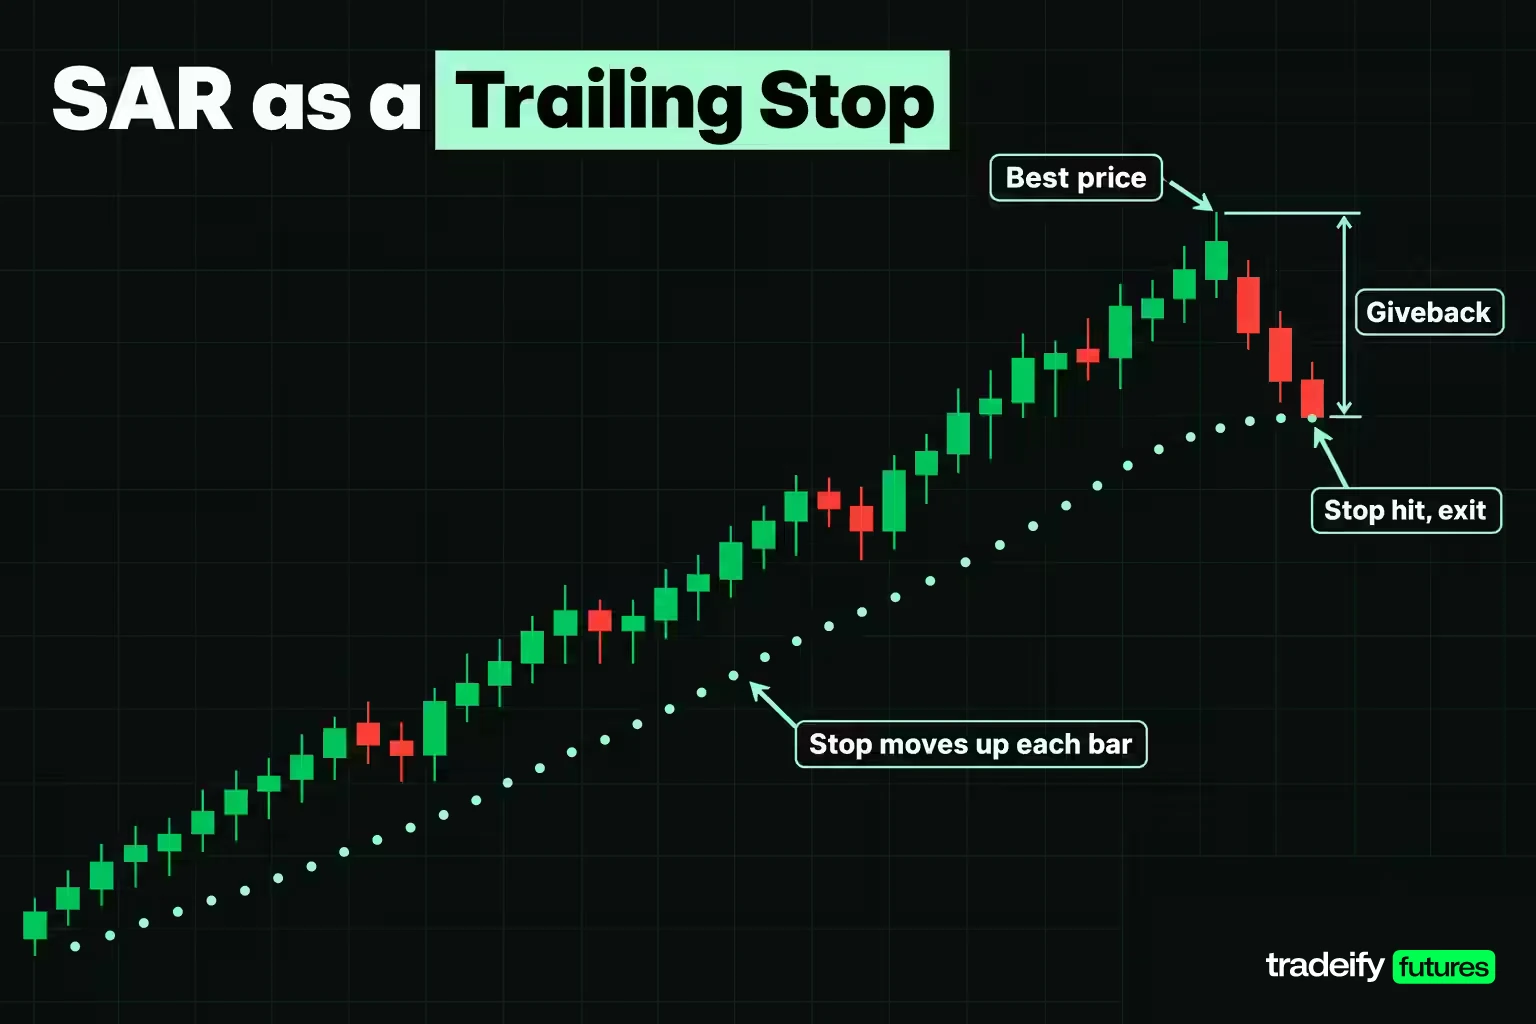
Using the Parabolic SAR as a trailing stop loss is where most traders get real value from it. In an uptrend, the dot never moves down, so the stop ratchets higher as the trend extends and protects open profit. StockCharts describes it as a guard against the habit of lowering a stop. In a downtrend, the dot only moves down.
To use it, move your stop order to each new dot at the start of every bar. The stop never widens, which is exactly what you want from a trailing stop when a winning trade starts to wobble and you feel the pull to give it more room.
Three costs come with it, and a 504-day audit of default SAR flips on E-mini S&P 500 daily bars (ES=F, September 2024 to September 2026, exits at the next open) measured each one.
- Giveback. From each leg's best price to the exit fill, the average leg gave back 166.01 points and the median leg 147.00 points. Across the window that totaled 8,466.75 points, or $42,333.75 on one MES contract. A trailing stop protects the trend's middle, never its top.
- Gap through. A stop at the dot is a level, not a guaranteed fill. On 3 of the 51 flips, ES opened beyond the dot, so a resting stop order would have filled worse than the dot. Those gaps added 37.68 points of slippage ($188.40 on one MES), with the worst one opening 21.50 points through the stop on March 2, 2026.
- Whipsaw. In sideways markets, the stop is hit again and again with no real trend in between. In that same ES=F calculation, 14 of the 51 legs lasted fewer than six bars, and those short legs lost 1,090.75 points between them.
Sizing a Position From the Distance to the Parabolic SAR
The distance from your entry to the Parabolic SAR dot is not stable, and that matters more for risk than the signal itself. Across 51 SAR entries on 504 daily E-mini S&P 500 bars, the distance from the entry price to the dot ranged from 24.00 points to 453.31 points, about 19 times wider at the high end. On one MES contract, that is $120.00 of risk at one extreme and $2,266.55 at the other, for the same one-contract trade. The median was 152.66 points, or $763.30.
Imagine a $50,000 account trading one MES on every flip. The median stop risked about 1.53% of that account. The worst single loss was 309.00 points, $1,545.00 or 3.09%, and the peak-to-trough drawdown of 1,133.00 points was $5,665.00, 11.33% of the account. A fixed contract count turns a 19-fold swing in stop distance into a 19-fold swing in account risk.
Sizing from the dot fixes that. The arithmetic, with illustrative round numbers:
- Risk budget: 1% of a $50,000 account = $500.
- Stop distance to the dot: 40 points. Risk per MES contract = 40 x $5 = $200.
- Contracts: $500 / $200 = 2.5, rounded down to 2 MES. Actual risk = 2 x $200 = $400.
- If the dot sits 150 points away instead, risk per MES is $750, which exceeds the $500 budget, so the answer is zero contracts or a smaller stop.
If you need a tighter stop than the dot on a given bar, take it. Just remember the SAR only reverses when the dot itself is hit, so a stop inside the dot can take you out while the indicator still says the trend is intact.
Combining the Parabolic SAR With ADX and Other Indicators
The Parabolic SAR answers "which direction, and where is my stop?" It does not answer "is this market trending strongly enough to be worth a trend trade?" That is why it works best paired with a tool that measures what it cannot. Wilder himself suggested using the Parabolic SAR for direction and a different indicator, such as the Average Directional Index, for trend strength.
Common pairings and the job each one does:
| Pairing | Job it adds | What to watch for |
|---|---|---|
| SAR with ADX | Filters flips by trend strength | ADX lags, so it can confirm late |
| SAR with a moving average | Takes only flips in the direction of the average | Two lagging tools can both turn late |
| SAR with MACD | Checks that momentum agrees with the flip | Overlapping signals can feel like confirmation without adding information |
| SAR on two timeframes | Higher-timeframe SAR sets direction, lower one times exits | More rules means fewer trades and more ways to overfit |
The rule of thumb: pair the SAR with something that measures a different thing (strength, momentum, larger trend), not something that restates the same price swing in another form.
An ADX Filter Tested on the Same Parabolic SAR Flips
To test the ADX pairing, the 51 default SAR flips on 504 daily E-mini S&P 500 bars (September 2024 to September 2026) were filtered by Wilder's 14-period ADX on the bar that confirmed each flip, using ADX values computed over about three years of earlier history so they had settled. Only flips with ADX above 25 were taken, and each kept trade was entered at the next open and ran to the next flip.
The filter kept 21 of the 51 trades. Those 21 won 38.1% of the time and made 337.25 points ($1,686.25 on one MES). The 30 skipped trades lost 784.25 points between them. At a looser threshold of ADX above 20, 30 trades were kept and made 59.00 points.
Before you adopt that filter, look at where the gain came from. The best leg of the full sample, a 734.50-point long from April 2026, passed the ADX filter. Without it, the other 20 filtered trades lost 397.25 points. So the filter helped mostly by skipping bad trades while keeping the one big winner, which is the job a filter should do, but on a sample this small it is a reason to test the idea on your own market, not proof that it works.
Double Parabolic SAR Strategy
A double Parabolic SAR strategy runs two copies of the indicator with different settings on the same chart: a slow SAR to define the main trend and a fast SAR to time entries and exits inside it.
A common pairing uses a slow SAR at 0.01 and 0.10 and a fast SAR at 0.02 and 0.20. On 504 daily E-mini S&P 500 bars (ES=F, September 16, 2024 to September 16, 2026), the slow SAR flipped 31 times against 51 for the fast one, and the two sat on the same side of price on 407 of 503 bars, or 80.9% of the time. The other 19.1% is the zone where the fast SAR has flipped and the slow one has not.
The basic rules:
- Both agree: both sets of dots are on the same side of price. That is the trend mode where you look for entries in that direction.
- Fast flips, slow holds: the fast SAR flips against the trend while the slow one stays put. Treat it as a pullback. Traders in the trend use it to tighten risk or take partial profit; traders waiting to enter use the fast SAR's flip back as a re-entry trigger.
- Both flip: the slow SAR confirms that the larger trend has ended. Exit, and only consider the opposite side once both agree again.
The double version cuts down on reversals against the main trend. On the same ES daily bars, that is where a single default SAR lost most: its 25 short flips in a rising market lost 1,257.50 points. The price is lateness: the slow SAR will often confirm a real reversal well after the fast one, and you give back more at major turns.
Parabolic SAR Settings for Intraday and Scalping
Parabolic SAR settings behave differently on intraday charts, because a 5-minute bar carries far more noise relative to its range than a daily bar. More bars per session means more chances to flip.
To measure that, the default Parabolic SAR (0.02, 0.02, 0.20) was run on 48 complete regular-hours sessions of 5-minute ES=F bars from Yahoo Finance, from August 27 to November 4, 2026, using 9:30 AM to 4:00 PM ET only and restarting the calculation each session. Legs were priced at the next bar's open, and the last leg of each session closed at the final bar's close.
| Setting on 5-minute ES | Flips per session | Legs | Median leg | Legs of 30 minutes or less | Legs in profit | Net points before costs |
|---|---|---|---|---|---|---|
| 0.02 and 0.20 | 7.1 (range 4 to 10) | 378 | 45 minutes | 38.4% | 41.5% | -13.00 |
| 0.01 and 0.10 | 4.7 (range 2 to 8) | 268 | 55 minutes | 31.3% | 39.9% | -292.50 |
On default settings, the SAR flipped about seven times per regular session and more than a third of the legs lasted 30 minutes or less. The gross result was close to flat at -13.00 points over 48 sessions, but that is before 378 round-trip commissions and slippage, which would turn it clearly negative. The slower setting cut the flips by about a third and lengthened the legs, yet did worse on this sample.
Independent testing points the same way. Liberated Stock Trader's backtest of the 30 Dow Jones stocks reports that standard Parabolic SAR beat buy and hold on only 17% of stocks on 5-minute charts and 10% on 1-minute charts, versus 30% on daily charts.
Using the Parabolic SAR on Intraday Charts
What the 5-minute Parabolic SAR numbers mean for intraday and scalping use:
- The SAR works better on intraday charts as a trailing exit for trades you took for other reasons than as a stream of entries.
- Use a higher-timeframe SAR or trend filter to decide direction, and the 5-minute SAR only to manage the trade.
- Count costs. Seven reversals per session multiply commissions and slippage quickly.
- Very short holds can collide with prop-firm rules about minimum trade duration, so check your rules before running a fast SAR on a funded account.
On our accounts, every position must be closed by 4:45 PM ET and nothing is held overnight or over a weekend, so a daily-chart SAR leg lasting several sessions cannot be carried on a Tradeify account. If you use the Parabolic SAR with us, use it on intraday charts. On funded accounts, payout requests also need more than 50% of trades held longer than 10 seconds and more than 50% of profit from those trades, which matters if a very fast SAR has you flipping in and out.
Adding the Parabolic SAR to a Charting Platform
Adding the Parabolic SAR takes a few clicks on most charting platforms, but it is worth checking the inputs and how the platform handles the start of the data.
- TradingView: the built-in Parabolic SAR has Start, Increment and Max Value inputs (0.02, 0.02 and 0.20 by default), a cross-style plot, and an Indicator Timeframe option that lets you plot a SAR calculated on a higher timeframe, such as 1 hour, on a 5-minute chart.
- NinjaTrader 8: the ParabolicSAR indicator takes acceleration, acceleration maximum and acceleration step, and the NinjaScript example calls it with 0.02, 0.2 and 0.02.
- StockCharts: the Parabolic SAR overlay takes a starting step of 0.02 and a maximum of 0.2, with an optional third parameter if you want the increment to differ from the starting step. Labels vary between platforms, so check which input is which before you copy settings from one to another.
If you build the Parabolic SAR yourself, in a spreadsheet, Python or a platform scripting language, the logic per bar is:
- Compute the projected SAR from the previous SAR, AF and EP.
- Apply the two-bar clamp.
- Check whether the current bar penetrates the projected SAR. If it does, flip: SAR becomes the old EP, EP becomes this bar's extreme, AF resets to the start value.
- If not, update EP when the bar makes a new extreme and raise AF by the increment, up to the maximum.
Then check your output against your charting platform on the same bars. The most common sources of mismatch are a missing clamp, a different starting rule for the first bar, and using closes instead of highs and lows.
Pros, Cons and Where the Parabolic SAR Fails
The Parabolic SAR has real strengths and specific failure points, and both are measurable.
Parabolic SAR Advantages
- Mechanical stop placement. Every bar gives you an objective stop level, so there is no debate about where to trail.
- It only tightens. In an uptrend the dot never moves down, which protects you from the habit of widening a stop.
- Easy to read. Direction is obvious at a glance.
- Built-in acceleration. The stop tightens faster as the trend matures, when a reversal costs more.
Parabolic SAR Limitations
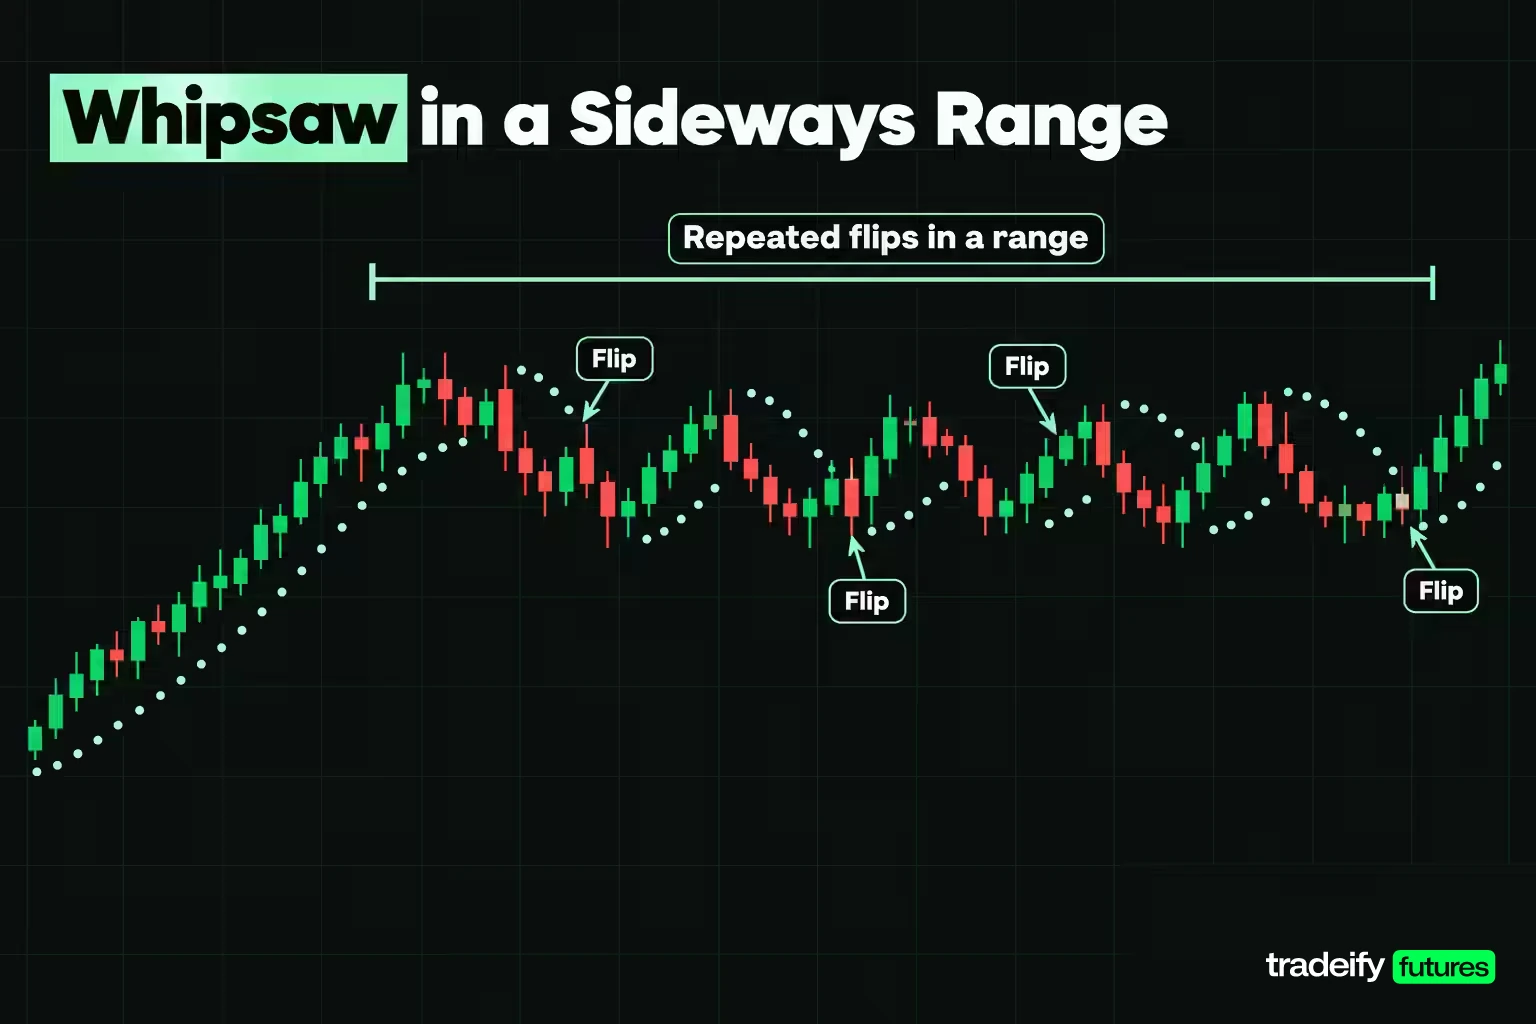
- Whipsaw in ranges. The SAR is always in the market, so sideways conditions produce repeated flips. In a 504-day audit of default SAR flips on E-mini S&P 500 daily bars (Yahoo Finance ES=F data, calculated for this guide), 14 of the 51 legs lasted fewer than six bars and lost 1,090.75 points between them, while the 37 legs lasting six bars or more made 643.75 points. Four legs lasted a single bar, three of them in a row in July 2025.
- Giveback at every turn. The stop is reached only after price has turned, so every exit gives back part of the move.
- Unstable stop distance. The first dot after a flip can sit far away, so risk per trade swings widely unless you size for it.
- No strength reading. It cannot tell a strong trend from a slow drift.
- Gaps. A stop at the dot can fill worse than the dot when the market opens through it.
The best-known outside test is easy to misread. Liberated Stock Trader backtested the Parabolic SAR on the 30 Dow Jones stocks over 12 years, and Wikipedia summarizes the result as a 19% win rate on standard charts versus 63% on Heikin Ashi charts. The source's own table defines those percentages as the share of stocks where the SAR strategy beat buying and holding, not the share of winning trades. Standard settings on daily candlestick charts came in at 30%, and the 19% figure is the average of six standard-chart tests from 1-minute to daily, including two alternative settings. Heikin Ashi smoothing filters out some of the noise that causes whipsaw, which is the likely reason it helped.
Related lesson: Heikin ashi charts
Common Mistakes With SAR Flips and Stops
Most Parabolic SAR problems come from asking it to do a job it was not built for.
- Taking every flip in a range. The SAR has no neutral state. If the market is going sideways, it will keep flipping. Check trend strength or structure first.
- Reversing automatically. A flip ends the old trend; it does not prove a new one. The urge to "get back in" right after being stopped is strong, so make the opposite trade earn its own evidence.
- Fixed size with a moving stop. Trading the same contract count on every flip means wildly different dollar risk. Size from the distance to the dot.
- Optimizing settings on one sample. After a run of losing flips, the temptation is to nudge the step until the backtest looks better. On 504 daily E-mini S&P 500 bars, moving the step from 0.02 to 0.03 turned a loss into a gain, and 0.04 turned it back into a loss. A setting that only works in a narrow band is likely fitted to the data.
- Treating the dot as a guaranteed fill. A stop at the dot is a price level. Gaps and fast markets can fill beyond it.
- Trusting early dots. Values before the first flip depend on where the calculation started and can differ between platforms.
- Mixing conventions. Testing on next-open fills and then acting on intrabar touches, or the reverse, makes your live results incomparable with your test.
Parabolic SAR FAQ
Is the Parabolic SAR a good indicator?
It is a good trailing stop and a weak standalone entry system. It gives a mechanical, ever-tightening stop and a clear direction label, but it cannot measure trend strength and whipsaws in sideways markets. Over 504 daily E-mini S&P 500 bars, taking every default flip lost 447 points while the index rose 1,918.50 points.
Which timeframe is best for the Parabolic SAR?
No timeframe is best in general, but noise grows as bars get smaller. On 48 sessions of 5-minute E-mini S&P 500 bars (Yahoo Finance ES=F data, calculated for this guide), the default SAR flipped about seven times per regular session, and more than a third of the legs lasted 30 minutes or less. Many traders set direction with a higher-timeframe SAR or trend filter and use the lower timeframe only to manage exits.
How do you calculate the Parabolic SAR?
Next SAR equals the current SAR plus the acceleration factor times the gap between the extreme point and the current SAR. The factor starts at 0.02, rises by 0.02 at each new extreme and caps at 0.20. The SAR is never allowed inside the previous two bars' range. When price penetrates it, the SAR resets to the old extreme point and the factor returns to 0.02.
Does the Parabolic SAR repaint?
No. Each dot is calculated one bar in advance from completed data, and a finished dot does not change. What can change during a live bar is whether price has touched the dot, so a flip can appear and confirm before the bar closes, depending on the platform. Dots before the first flip can differ between platforms because of different starting rules.
Is the Parabolic SAR leading or lagging?
It is a lagging, trend-following indicator. The dot follows price and only flips after price has already moved through it. That is why every SAR exit gives back part of the move before it triggers.
What is the best Parabolic SAR setting?
The default 0.02 start, 0.02 increment and 0.20 maximum is the standard starting point. Lower values give fewer reversals and looser stops, higher values give more reversals and tighter stops. Test any change on your own instrument with one fixed fill convention, and distrust a setting that only works in a narrow band.
Risk Note on Parabolic SAR Trading
Educational content only, not investment advice or a recommendation to trade any market. The study results here are hypothetical calculations on historical data, exclude commissions and most slippage, and do not predict future results. Futures are leveraged, and losses can exceed what you expect when markets gap or move fast. Prop-firm evaluation and funded accounts are simulated trading accounts.


