



TL;DR: Heikin Ashi charts plot averaged prices, so they trade a cleaner trend read for later signals and levels that never traded. In a worked MES run, the colour-flip exit gave back 30 ticks against 11 for a plain lower close. On two years of ES daily bars, HA colour persisted 74.0% of the time but matched the next day's direction 47.6%. Read bodies and wicks, and keep a standard chart for stops and fills.
Switch a chart to Heikin Ashi and the noise seems to vanish. Trends turn into clean runs of one colour, pullbacks shrink, and the urge to bail on every red bar fades. That calm is real, and so is the price you pay for it.
Heikin Ashi charts trade accuracy for readability. Every candle is an average, so the chart tells you where the move has been heading, not exactly where it is now. This guide shows the math bar by bar, prices the delay in ticks and dollars, and lays out how to use the chart without letting it set your stops.
How Heikin Ashi Charts Are Calculated
Heikin Ashi charts look like candlestick charts, but none of the four values on a Heikin Ashi candle is required to be a price that actually traded. Each value is an average built from the current bar and the previous Heikin Ashi bar. StockCharts' ChartSchool translates heikin as "average" and ashi as "pace", and NinjaTrader's help guide translates the whole name as "average bar".
The four formulas, as StockCharts and TradingView publish them:
| Heikin Ashi value | Formula | What it means for you |
|---|---|---|
| HA close | (open + high + low + close) / 4 of the current bar | The middle of the bar, not the last traded price |
| HA open | (previous HA open + previous HA close) / 2 | Chains each candle to the one before it |
| HA high | Highest of the actual high, HA open and HA close | Never lower than the real high |
| HA low | Lowest of the actual low, HA open and HA close | Never higher than the real low |
| First HA open | (open + close) / 2 of the first bar | A seed value, because there is no previous HA bar yet |
The open formula is the one that matters most. Because every HA open is the midpoint of the previous HA candle, one big bar keeps pulling the next several opens along behind it. That chain is where the smooth look comes from, and it is also where the delay comes from.
The seed is a small but real detail. StockCharts notes that the first candle is somewhat artificial and that its effect usually dissipates over seven to 10 periods. Two platforms that start the calculation on different dates can show slightly different HA values on the same bar until that effect washes out.
One wording trap is worth knowing. Some explanations, including Schwab's, describe the HA open as the midpoint of the previous actual bar's open and close. StockCharts, TradingView and NinjaTrader all chain it to the previous Heikin Ashi bar instead. If your spreadsheet uses the actual bar, you are building a different chart, and your numbers will not match your platform.
Building Heikin Ashi charts in a spreadsheet
A spreadsheet version takes four columns of raw data and four columns of formulas. Put open, high, low and close in columns B to E. In the first data row, set HA close to the average of B to E and HA open to the average of B and E. From the second row onward, HA open is the average of the previous row's HA open and HA close. HA high is MAX of the actual high, HA open and HA close in the same row, and HA low is MIN of the actual low, HA open and HA close.
Check one row by hand before you trust the sheet. A single wrong cell reference in the HA open column copies the error into every row after it.
Ten Heikin Ashi Candles Built by Hand
A worked conversion is the fastest way to see what Heikin Ashi charts do to price. These ten bars are illustrative one-minute bars on the Micro E-mini S&P 500 (MES), which CME specifies at $5 times the index with a minimum tick of 0.25 index points, or $1.25 per tick. Price climbs for five bars, makes its high on bar 6, then falls for four.
| Bar | Open | High | Low | Close | HA open | HA close | HA high | HA low | Colour |
|---|---|---|---|---|---|---|---|---|---|
| 1 | 6,037.00 | 6,040.75 | 6,036.50 | 6,038.75 | 6,037.875 | 6,038.25 | 6,040.75 | 6,036.50 | Green |
| 2 | 6,038.75 | 6,044.25 | 6,038.00 | 6,043.75 | 6,038.0625 | 6,041.1875 | 6,044.25 | 6,038.00 | Green |
| 3 | 6,043.75 | 6,047.50 | 6,042.75 | 6,046.75 | 6,039.625 | 6,045.1875 | 6,047.50 | 6,039.625 | Green |
| 4 | 6,046.75 | 6,049.25 | 6,045.50 | 6,049.00 | 6,042.40625 | 6,047.625 | 6,049.25 | 6,042.40625 | Green |
| 5 | 6,049.00 | 6,052.00 | 6,048.25 | 6,051.50 | 6,045.015625 | 6,050.1875 | 6,052.00 | 6,045.015625 | Green |
| 6 | 6,051.50 | 6,053.25 | 6,048.00 | 6,048.75 | 6,047.6015625 | 6,050.375 | 6,053.25 | 6,047.6015625 | Green |
| 7 | 6,048.75 | 6,049.50 | 6,043.25 | 6,044.00 | 6,048.98828125 | 6,046.375 | 6,049.50 | 6,043.25 | Red |
| 8 | 6,044.00 | 6,045.25 | 6,038.75 | 6,039.50 | 6,047.681640625 | 6,041.875 | 6,047.681640625 | 6,038.75 | Red |
| 9 | 6,039.50 | 6,040.25 | 6,034.50 | 6,035.25 | 6,044.7783203125 | 6,037.375 | 6,044.7783203125 | 6,034.50 | Red |
| 10 | 6,035.25 | 6,036.00 | 6,030.25 | 6,031.00 | 6,041.07666015625 | 6,033.125 | 6,041.07666015625 | 6,030.25 | Red |
Check bar 2 yourself. The HA close is (6,038.75 + 6,044.25 + 6,038.00 + 6,043.75) / 4 = 6,041.1875. The HA open is (6,037.875 + 6,038.25) / 2 = 6,038.0625. The HA high is the actual high of 6,044.25, because it is larger than both HA values.
Now look at bar 6. The actual bar is red: it opened at 6,051.50 and closed at 6,048.75, the first lower close of the run. The Heikin Ashi candle is still green, because its averaged close of 6,050.375 sits above its averaged open of 6,047.6015625. The real turn happened on bar 6. The chart did not change colour until bar 7.
Heikin Ashi bodies, wicks and close gaps on the ten bars
The same ten-bar MES run, measured candle by candle with values rounded to two decimals, shows where the trend strength and the distortion sit:
| Bar | HA body (points) | HA body (ticks) | Lower wick | Upper wick | HA close minus actual close |
|---|---|---|---|---|---|
| 1 | 0.38 | 1.5 | 1.38 | 2.50 | -0.50 |
| 2 | 3.13 | 12.5 | 0.06 | 3.06 | -2.56 |
| 3 | 5.56 | 22.3 | 0.00 | 2.31 | -1.56 |
| 4 | 5.22 | 20.9 | 0.00 | 1.63 | -1.38 |
| 5 | 5.17 | 20.7 | 0.00 | 1.81 | -1.31 |
| 6 | 2.77 | 11.1 | 0.00 | 2.88 | 1.63 |
| 7 | 2.61 | 10.5 | 3.13 | 0.51 | 2.38 |
| 8 | 5.81 | 23.2 | 3.13 | 0.00 | 2.38 |
| 9 | 7.40 | 29.6 | 2.88 | 0.00 | 2.13 |
| 10 | 7.95 | 31.8 | 2.88 | 0.00 | 2.13 |
Two things stand out. Bars 3 to 6 have no lower wick at all, which is the classic strong-uptrend look. And the last column never reads zero: the HA close sat between 0.50 and 2.56 points away from the real close on every bar, always trailing the real close: below it on the way up, above it on the way down.
Bullish and Bearish Heikin Ashi Signals
Bullish and bearish Heikin Ashi signals come from three things: colour, body size and which side the wick is on. StockCharts describes a long hollow (up) candle with no lower shadow as strong buying pressure, a long filled (down) candle with no upper shadow as strong selling pressure, and small candles or candles with long shadows on both sides as indecision.
| Candle state | What it looks like | What it suggests | What it does not tell you |
|---|---|---|---|
| Strong bullish | Green, large body, no lower wick | Buyers controlled the averaged bar | That the next real bar will close higher |
| Bullish but tiring | Green, smaller body, lower wick appears | Buying is still ahead but losing control | Where the high is |
| Indecision | Small body, wicks on both sides | Neither side is in control | Which way it will break |
| Bearish but tiring | Red, smaller body, upper wick appears | Selling is losing control | Where the low is |
| Strong bearish | Red, large body, no upper wick | Sellers controlled the averaged bar | That the next real bar will close lower |
Why the Heikin Ashi colour flip is the weakest signal
The colour change is the signal most traders watch, and it is the weakest of the three. Schwab's guide makes the more useful point: a change from long-range candles to short-range candles with wicks on both sides can show indecision near a turning point, and a single bar of the opposite colour inside a run can just be an anomaly.
A colour flip is an observation, not a confirmation. In the illustrative ten-bar MES run in the worked example, the flip arrived on bar 7 at an actual close of 6,044.00, a bar after the real high. The wick shift came first: bar 7 printed a lower wick of 3.13 points and an upper wick of only 0.51. The wick moved first and the colour followed. Treat the flip as the late confirmation it is, not the first warning.
One more warning on colour. TradingView's own Heikin Ashi page says that the more similarly coloured candles you see in a row, the more likely the trend is coming to an end. A long run of green can mean strength, or it can mean the move is old. Colour alone cannot tell you which.
Reading Trend Strength From Bodies and Wicks
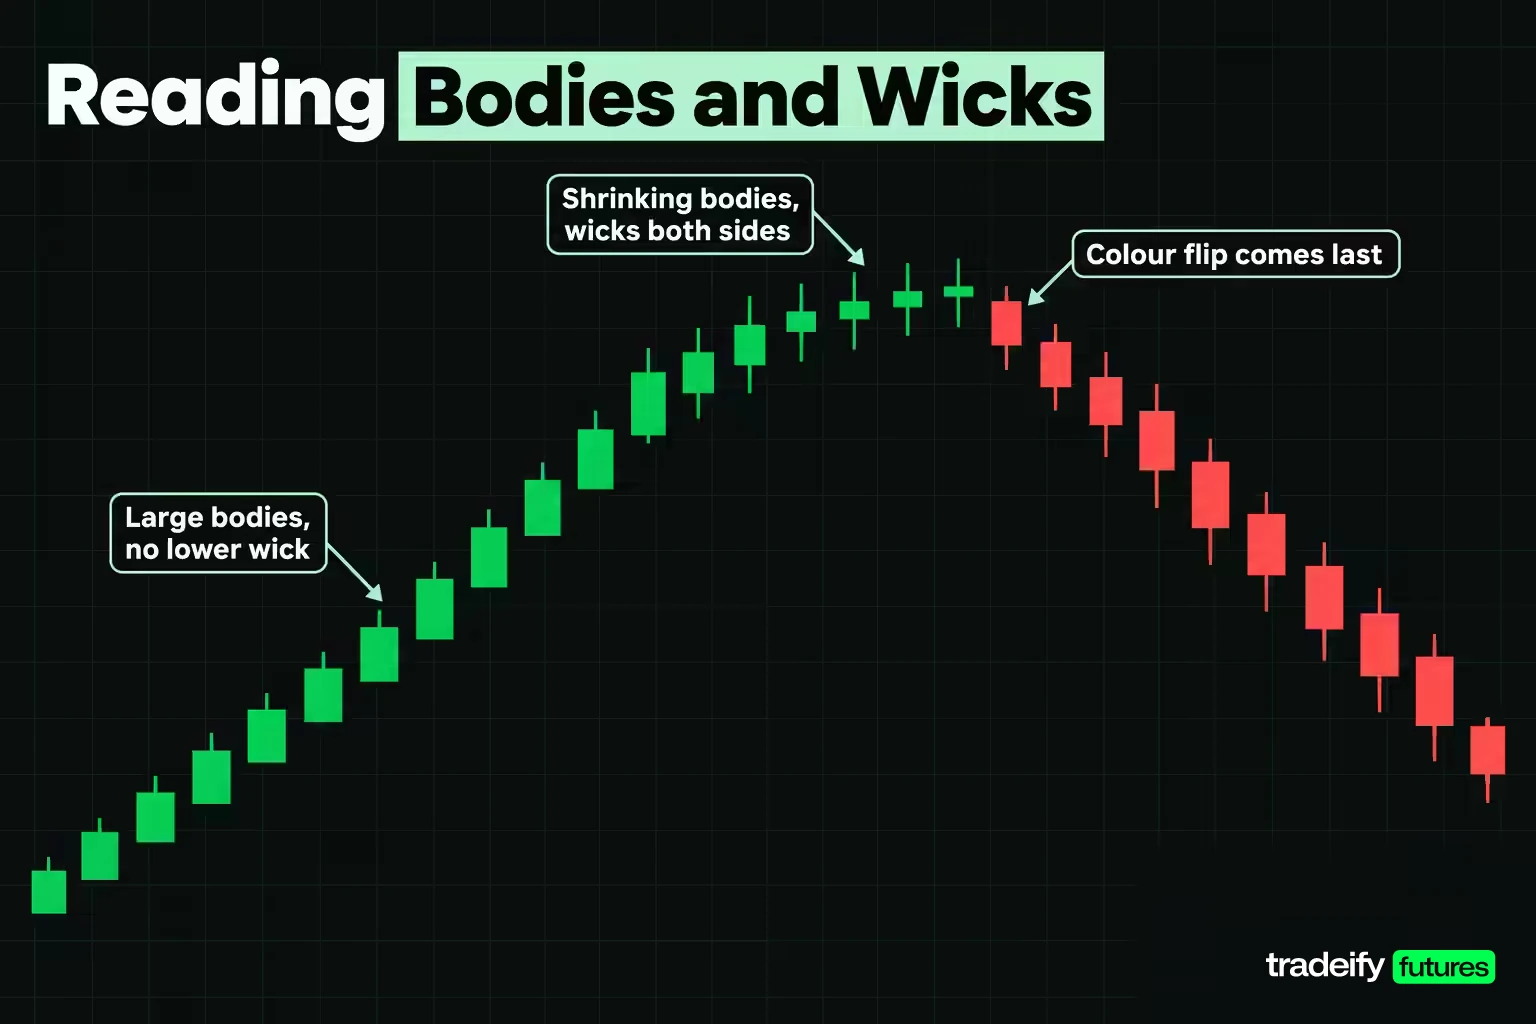
Trend strength on a Heikin Ashi chart shows up in the bodies and wicks first, and in colour last. A healthy trend prints bodies that expand or hold their size, with no wick on the side opposite the move. A move that is running out shows bodies that shrink while wicks grow on both sides.
To make that measurable, compare two illustrative MES runs on one-minute bars: the first six bars of the ten-bar trend example, and a 14-bar run that swings inside a range.
| Measurement | Trending run (6 bars) | Swinging range (14 bars) |
|---|---|---|
| Heikin Ashi colour flips | 0 | 5 |
| Raw candle colour flips | 1 | 4 |
| Mean HA body | 3.70 points (14.8 ticks) | 2.98 points (11.9 ticks) |
| Bars with wicks on both sides | 2 of 6 | 5 of 14 |
| Bars with no wick against the move | 4 of 6 | Not applicable, no lasting move |
| Actual high to low range | 16.75 points | 14.00 points |
| Net move, first open to last close | 11.75 points up | 5.00 points |
| Swing structure | Higher highs and higher lows | Highs of 6,045.50 then 6,045.00, lows of 6,033.50 then 6,031.50 |
What the trend and range measurements show
In the two illustrative MES runs, the trending run travelled 11.75 points with zero colour changes. The range run covered a similar 14.00-point high to low range but finished only 5.00 points from where it started, and the Heikin Ashi colour changed five times, one more than the raw candles did. Smoothing did not remove the chop. When swings last two or three bars, the averaged candles flip almost as often as raw ones, just later.
The body difference is real but modest: 14.8 ticks against 11.9 ticks. That is the honest lesson. Body size helps, but it is not a clean switch. The swing structure row is what separates the two runs most clearly, and you read that on price, not on colour.
A practical routine before you act on any Heikin Ashi signal: count colour flips over the last 10 to 15 bars, check whether bodies are growing or shrinking, note which side the wicks are on, and confirm on the standard chart whether price is making higher highs and higher lows or swinging between two levels.
Related lesson: Market structure highs lows and trends
Heikin Ashi vs Standard Candlestick Charts
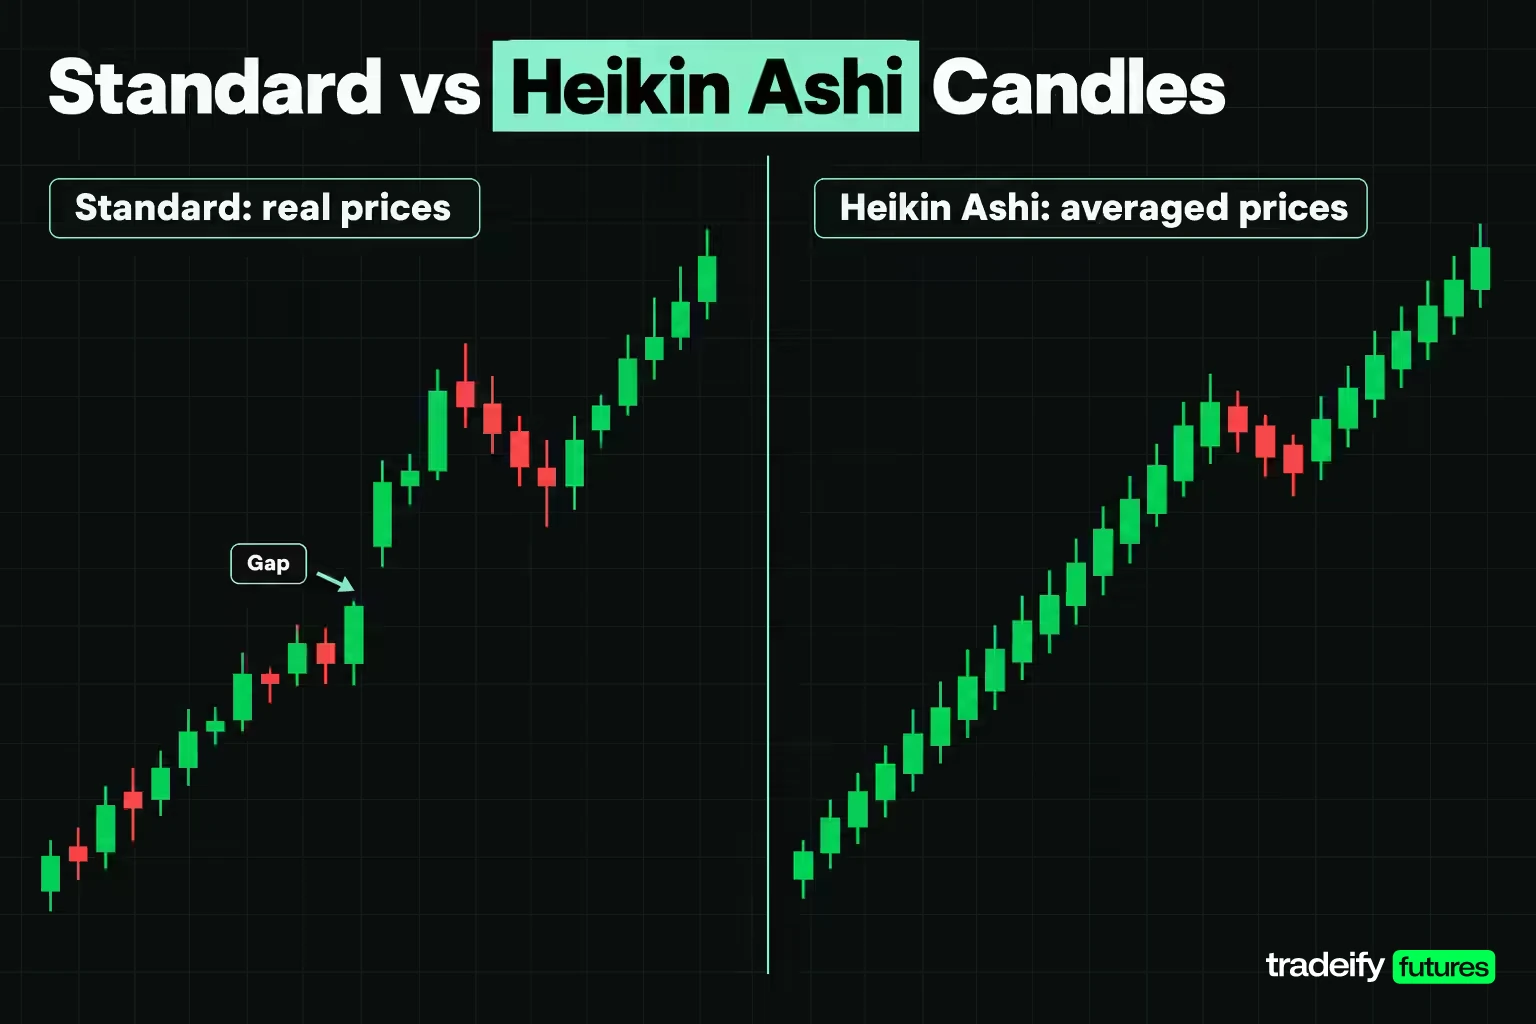
Heikin Ashi charts and standard candlestick charts use the same shapes, but they answer different questions. A standard candle records what traded during the bar. A Heikin Ashi candle records where the average has been heading.
| Question | Standard candlestick chart | Heikin Ashi chart |
|---|---|---|
| Are the open and close real prices | Yes | No, they are averages |
| Are price gaps shown | Yes | No, the chained open hides them |
| Can you place an order at a plotted extreme | Yes | Often not, the value can sit off the tick grid |
| Speed of a turn signal | First lower close or higher close | Usually one or more bars later |
| Candlestick reversal patterns | Defined and studied | Definitions do not carry over |
| Trend read at a glance | Takes interpretation | Faster, through colour runs and wick side |
| Behaviour in a range | The range is visible | Small, two-sided candles and late flips |
TradingView's Help Center sums up the trade-off in its own comparison list. Heikin Ashi gives a clearer view of trends and averages out turbulent stretches, but it is less precise for pinpointing exact entry and exit levels. Standard candles are better studied, work with both chart patterns and candlestick patterns, and suit gap trading. Wikipedia's article adds the same two limitations: the actual open and close are not shown, and gaps disappear.
The practical answer is to run both. Use the Heikin Ashi chart for the momentum read and the standard chart for every price you will actually type into an order ticket.
Why the Heikin Ashi open drifts off the tick grid
Heikin Ashi opens leave the tradable price grid almost immediately, because each open is half of the previous open plus close. On MES, prices move in 0.25-point steps. In the illustrative ten-bar MES run, bar 2's HA open is 6,038.0625, a sixteenth of a point. By bar 10 it is 6,041.07666015625. Of the 20 HA open and close values in that run, only one, the 6,038.25 close on bar 1, lands on a 0.25 increment.
Platforms handle this differently. NinjaTrader's help guide says its Heiken Ashi bar values are rounded to the instrument's nearest tick size, to keep order submission and backtests realistic. Rounding makes the number placeable, but it is still an average, not a level the market traded. Stops and targets belong on actual prices from the standard chart.
Related lesson: Tick size and tick value
The Lag in Heikin Ashi Charts and What It Costs
The lag in Heikin Ashi charts is mentioned everywhere and priced almost nowhere. Schwab's guide states it plainly: signals may appear later than they would on a normal candlestick chart. Here is what later costs on one illustrative MES run.
In the ten-bar example, price climbs to a highest close of 6,051.50 on bar 5, prints its high of 6,053.25 on bar 6, then falls to 6,031.00 by bar 10. Suppose you held a long and needed an exit rule. Four rules, measured against that 6,051.50 close:
| Exit rule | Exit bar | Exit price | Given back (points) | Given back (ticks) | Per ES contract | Per MES contract |
|---|---|---|---|---|---|---|
| Highest close, known only in hindsight | 5 | 6,051.50 | 0.00 | 0 | $0.00 | $0.00 |
| First actual close below the prior close | 6 | 6,048.75 | 2.75 | 11 | $137.50 | $13.75 |
| Heikin Ashi colour flip | 7 | 6,044.00 | 7.50 | 30 | $375.00 | $37.50 |
| Colour flip plus one confirming red bar | 8 | 6,039.50 | 12.00 | 48 | $600.00 | $60.00 |
The ES column uses CME's E-mini S&P 500 terms of $50 per index point ($12.50 per 0.25 tick), and the MES column uses $5 per point. Waiting for the colour flip gave back 30 ticks. The plain raw-candle rule gave back 11. Waiting one more bar to "be sure" pushed it to 48.
None of this makes the flip rule wrong. A raw-candle exit also fires on every small dip inside a real trend, and the Heikin Ashi rule is designed to sit through those. The point is that the smoothing has a measurable price, and you should know yours before you choose it.
There is a second, quieter cost. On the flip bar, the HA close printed 6,046.375 while the real close was 6,044.00. A trader reading the HA scale would think the exit was 2.375 points (9.5 ticks) better than the price that was really available.
Why Heikin Ashi charts whipsaw in a range
Heikin Ashi charts are trend tools, and in a range their colour flips arrive just after each swing has turned. Take an illustrative 14-bar MES run that swings between roughly 6,031.50 and 6,045.50, with values rounded to two decimals:
| Bar | Open | High | Low | Close | HA open | HA close | Colour | HA body (ticks) | Wicks on both sides |
|---|---|---|---|---|---|---|---|---|---|
| 1 | 6,038.00 | 6,041.50 | 6,036.75 | 6,040.75 | 6,039.38 | 6,039.25 | Red | 0.5 | Yes |
| 2 | 6,040.75 | 6,044.75 | 6,040.00 | 6,044.00 | 6,039.31 | 6,042.38 | Green | 12.3 | No |
| 3 | 6,044.00 | 6,045.50 | 6,041.00 | 6,041.75 | 6,040.84 | 6,043.06 | Green | 8.9 | No |
| 4 | 6,041.75 | 6,042.50 | 6,037.25 | 6,038.00 | 6,041.95 | 6,039.88 | Red | 8.3 | Yes |
| 5 | 6,038.00 | 6,038.75 | 6,033.50 | 6,034.25 | 6,040.91 | 6,036.13 | Red | 19.2 | No |
| 6 | 6,034.25 | 6,038.50 | 6,033.75 | 6,037.75 | 6,038.52 | 6,036.06 | Red | 9.8 | No |
| 7 | 6,037.75 | 6,042.25 | 6,037.00 | 6,041.50 | 6,037.29 | 6,039.63 | Green | 9.3 | Yes |
| 8 | 6,041.50 | 6,045.00 | 6,040.75 | 6,044.25 | 6,038.46 | 6,042.88 | Green | 17.7 | No |
| 9 | 6,044.25 | 6,044.75 | 6,040.25 | 6,040.75 | 6,040.67 | 6,042.50 | Green | 7.3 | Yes |
| 10 | 6,040.75 | 6,041.25 | 6,036.00 | 6,036.50 | 6,041.58 | 6,038.63 | Red | 11.8 | No |
| 11 | 6,036.50 | 6,037.25 | 6,031.50 | 6,032.25 | 6,040.10 | 6,034.38 | Red | 22.9 | No |
| 12 | 6,032.25 | 6,036.75 | 6,031.75 | 6,036.00 | 6,037.24 | 6,034.19 | Red | 12.2 | No |
| 13 | 6,036.00 | 6,040.25 | 6,035.50 | 6,039.50 | 6,035.71 | 6,037.81 | Green | 8.4 | Yes |
| 14 | 6,039.50 | 6,043.75 | 6,039.00 | 6,043.00 | 6,036.76 | 6,041.31 | Green | 18.2 | No |
Trading Heikin Ashi colour flips in a range
Trade the 14-bar illustrative MES range with a simple always-in rule: go long at the close of the first green candle, reverse to short at the close of the first red one, and keep reversing on every flip. Starting from the first flip on bar 2, the rule produces four closed trades:
- Long at 6,044.00 on bar 2, out at 6,038.00 on bar 4: minus 6.00 points.
- Short at 6,038.00 on bar 4, out at 6,041.50 on bar 7: minus 3.50 points.
- Long at 6,041.50 on bar 7, out at 6,036.50 on bar 10: minus 5.00 points.
- Short at 6,036.50 on bar 10, out at 6,039.50 on bar 13: minus 3.00 points.
That is four losers for minus 17.50 points, or 70 ticks, before costs: $87.50 per MES contract and $875.00 per ES contract. Every entry came one to two bars after the swing it was trying to catch. The rule did exactly what it was built to do. The market just was not trending, and no amount of discipline on a flip rule fixes that. Only the regime check does.
Trend Following With Heikin Ashi
Trend following with Heikin Ashi works best as a filter on a plan you already have, not as a standalone trigger. The chart is good at one job: keeping you in a move while the averaged candles stay one colour with no wick against you. Build the rules around that job.
A written trend-following rule set looks like this:
- Check the regime on the standard chart first. You want higher highs and higher lows for a long, or the reverse for a short, on the timeframe you are trading.
- Wait for a Heikin Ashi candle in the trend direction with a body larger than the recent average and no wick against the move.
- Enter at a real price from the standard chart, and place the stop beyond an actual swing low or high, in whole ticks.
- Hold while candles stay in the trend colour. Small candles with a wick against you are a warning, not an exit.
- Exit on a rule you chose in advance: an opposite-colour candle, an opposite-colour candle with a body larger than the recent average, or a close beyond a level on the standard chart.
Step 5 is where the rule set earns its keep or costs you. In an illustrative ten-bar MES run that peaked at a 6,051.50 close, the plain colour-flip exit gave back 30 ticks from the highest close, and the flip-plus-confirmation exit gave back 48. A trend follower accepts some of that giveback as the price of not being shaken out. Decide how much before the session, not while the bar is printing.
Schwab's example pairs Heikin Ashi with an 8-period and a 21-period exponential moving average, treating the faster average turning and then crossing the slower one as the confirmation for a new trend. That is a reasonable template. Notice that it adds a second smoothing step on top of the first, so the confirmation arrives even later. Use it on a timeframe where that extra delay is small relative to the move you expect.
Related lesson: Trend following
Pullback and Reversal Entries on Averaged Candles
Pullbacks are where averaged candles can earn their keep, because a pullback inside a trend usually shows up as one or two small or opposite-colour Heikin Ashi candles followed by a return to the trend colour. Here is an illustrative eight-bar MES uptrend with a two-bar pullback, values rounded to two decimals:
| Bar | Open | High | Low | Close | HA open | HA close | Colour | Lower wick | Upper wick |
|---|---|---|---|---|---|---|---|---|---|
| 1 | 6,000.00 | 6,004.00 | 5,999.00 | 6,003.50 | 6,001.75 | 6,001.63 | Red | 2.63 | 2.25 |
| 2 | 6,003.50 | 6,008.25 | 6,002.75 | 6,007.75 | 6,001.69 | 6,005.56 | Green | 0.00 | 2.69 |
| 3 | 6,007.75 | 6,012.00 | 6,007.00 | 6,011.25 | 6,003.63 | 6,009.50 | Green | 0.00 | 2.50 |
| 4 | 6,011.25 | 6,012.50 | 6,006.50 | 6,007.25 | 6,006.56 | 6,009.38 | Green | 0.06 | 3.13 |
| 5 | 6,007.25 | 6,008.75 | 6,004.25 | 6,006.00 | 6,007.97 | 6,006.56 | Red | 2.31 | 0.78 |
| 6 | 6,006.00 | 6,011.50 | 6,005.50 | 6,011.00 | 6,007.27 | 6,008.50 | Green | 1.77 | 3.00 |
| 7 | 6,011.00 | 6,016.25 | 6,010.50 | 6,015.75 | 6,007.88 | 6,013.38 | Green | 0.00 | 2.88 |
| 8 | 6,015.75 | 6,019.50 | 6,015.00 | 6,018.75 | 6,010.63 | 6,017.25 | Green | 0.00 | 2.25 |
Read it as a decision sequence. Bar 4 is a real down bar, but the Heikin Ashi candle stays green with a tiny lower wick: the first warning. Bar 5 turns red with a small body, the pullback low of 6,004.25 is in, and price never broke the bar 1 to bar 3 structure. Bar 6 turns green but still has a lower wick of 1.77 points, so buyers are back without full control. Bar 7 is green with no lower wick and a larger body: the trend candle is back.
That gives two possible entries, and each has a different price. Entering on bar 6 is earlier and cheaper but less confirmed. Entering on bar 7 is cleaner and more expensive, with a wider stop to the same pullback low and so a smaller position.
Reversal candidates on Heikin Ashi charts
Reversal trades on Heikin Ashi charts need a level and a confirmation, because a colour change alone happens constantly inside ranges and trends. StockCharts' guidance is a sound template: a Heikin Ashi doji or spinning top in a downtrend shows indecision, not a bullish signal, so mark a resistance level and treat a break of that level as the confirmation. Its own example shows one such breakout failing before a later one worked, which is a fair reminder that confirmation lowers the false-signal rate without removing it.
For counter-trend entries, the level should come from the standard chart, where the prices are real. The averaged chart then tells you whether the move into that level is losing energy: shrinking bodies, wicks appearing on the side of the old trend, and finally a candle of the new colour with no wick against it.
Related lesson: Support and resistance
Combining Heikin Ashi With Other Indicators
Combining Heikin Ashi with other indicators only helps when the second tool measures something the averaged candles do not. Heikin Ashi is already a smoothing of price. Adding another smoothing of price mostly tells you the same thing a little later.
| Tool | What it adds | How it pairs with Heikin Ashi |
|---|---|---|
| Support and resistance from the standard chart | Real price levels | Gives the averaged trend read a location and a stop |
| Volume | Participation, which averaged price does not show | Separates a strong-looking run on thin volume from one with real activity |
| Momentum oscillators such as RSI or MACD | Rate of change and divergence | Flags when a same-colour run is losing speed |
| Exponential moving averages | A trend filter on a set lookback | Defines the regime, at the cost of extra delay |
| A second smoothed trend line on averaged data | Little | Mostly repeats the candle colour |
StockCharts' view is that classical technical analysis carries over to Heikin Ashi charts, and that volume indicators and momentum oscillators work well alongside them. Schwab's example uses 8- and 21-period EMAs as the confirmation. Both are fine, as long as you know which job each tool is doing.
A useful test before adding any indicator: write down the specific failure it is meant to catch. "The chart stays green in a range" is a failure a swing-structure check or an oscillator can address. "I want more confirmation" usually means more lag.
One technical detail matters on most platforms. Indicators applied to a Heikin Ashi chart may be calculated from the averaged values rather than the real prices, depending on the platform and its settings. An RSI built on HA closes is a different RSI. Check which data series your indicator is reading.
Related lesson: MACD indicator
Stops and Position Size With Heikin Ashi
Stops and position size should come from actual prices, never from Heikin Ashi values. The averaged candle can tell you the trend is back. It cannot tell you where the market will prove you wrong, because its highs and lows are not always real prices.
Take an illustrative MES uptrend that pulls back to an actual low of 6,004.25 on bar 5. On bar 6 the Heikin Ashi candle turns green but still has a lower wick, and the real bar closes at 6,011.00. On bar 7 the candle is green with no lower wick, and the real bar closes at 6,015.75. A stop one tick below the pullback low sits at 6,004.00. There are two candidate entries:
| Entry | Entry price | Stop | Risk (points) | Risk (ticks) | Risk per MES | Risk per ES | MES contracts at $250 risk | Total risk |
|---|---|---|---|---|---|---|---|---|
| Bar 6 close, first green candle | 6,011.00 | 6,004.00 | 7.00 | 28 | $35.00 | $350.00 | 7 | $245.00 |
| Bar 7 close, green with no lower wick | 6,015.75 | 6,004.00 | 11.75 | 47 | $58.75 | $587.50 | 4 | $235.00 |
The $250 risk budget is illustrative, for example 0.5% of a $50,000 account. Waiting for the cleaner bar 7 candle moved the entry 4.75 points higher and made the stop 68% wider in points, which cut the position from 7 MES to 4 MES for about the same dollar risk. Neither ES row fits the budget, because one ES contract alone would risk $350.00 or $587.50.
That is the confirmation trade-off in plain numbers. Waiting feels safer, and sometimes it is. But the cleaner signal is not free. You pay for it in a worse entry, a wider stop and a smaller size, and you should compare that cost with how often the earlier signal fails in your own records.
Trailing a stop with Heikin Ashi candles
A trailing stop can follow the Heikin Ashi trend while still sitting on real prices. One common approach trails the stop below the actual low of each bar that prints a green candle with no lower wick, moving it only in the trade's favour. The averaged chart decides when to move the stop. The standard chart supplies the price.
Two cautions apply. A trailing stop is a stop order, so it becomes a market order when triggered and can fill worse than its price in a fast market. And a trail tied to every candle is effectively the colour-flip exit, with the same giveback: on a fast one-minute turn in an illustrative MES run, that exit came 30 ticks below the highest close.
Related lesson: Position sizing
Which Patterns Work on Heikin Ashi Charts
Heikin Ashi patterns are a short list, because most candlestick reversal patterns are defined against real opens and closes that Heikin Ashi bars do not have. StockCharts says it plainly: you won't find dozens of one-to-three-candle reversal patterns on Heikin Ashi charts, and traditional candlestick patterns don't exist there.
What does carry over:
- Doji and spinning tops. StockCharts treats a Heikin Ashi doji or spinning top as indecision that can foreshadow a reversal, but only a confirmation such as a break of a marked level makes it a signal.
- Strings of shadowless candles. A run of red candles with no upper shadow marks a strong decline, and a run of green with no lower shadow marks a strong advance.
- Classic chart patterns. StockCharts shows falling wedges, triangles and channels drawn on Heikin Ashi charts, with breakouts read the same way as on a standard chart.
- Trendlines and retracements. These can be drawn on Heikin Ashi charts, though the anchor points are averaged values.
What does not carry over: engulfing patterns, hammers, shooting stars, harami and the rest of the standard candlestick catalogue. An engulfing pattern requires one real body to cover another. On a Heikin Ashi chart the bodies are averages chained to each other, so the same shape means something else, and any published statistics for the standard pattern do not apply.
If you want to use a pattern on averaged candles, rebuild the rule on Heikin Ashi inputs and test it on its own sample. Otherwise, keep pattern work on the standard chart and use the averaged chart for trend context.
Related lesson: Doji candlestick patterns
Scalping With Heikin Ashi
Scalping with Heikin Ashi runs into one hard number: the colour flip is late by more than many scalps are worth. In the illustrative ten-bar MES run, the flip exit arrived 30 ticks after the highest close, while the first lower raw close arrived after 11. A scalp that targets a handful of ticks cannot absorb a delay of that size on the exit.
That does not make the chart useless for short-term trading. TradingView notes that on volatile instruments and small timeframes, Heikin Ashi can help filter false breakouts of support, resistance and chart pattern borders. The workable approach is to use the averaged chart as a direction filter, not as a trigger:
- Run Heikin Ashi on a higher timeframe, such as a 5-minute chart, to decide which side you are allowed to trade.
- Execute on a standard one-minute or tick chart, where entries and stops use real prices.
- Skip the trade when the higher-timeframe candles are small with wicks on both sides, because that is the range profile where flips arrive late.
- Keep the stop on a real level, measured in ticks, before the order goes in.
Costs matter more here than anywhere else. A scalper takes many trades, so commissions and slippage are a larger share of each result, and a rule that looks fine before costs can lose after them.
Related lesson: Scalping
Choosing a Timeframe for Averaged Candles
The right timeframe for Heikin Ashi depends on the move you are trying to hold, because the delay is measured in bars. One or two bars of lag on a one-minute chart is a minute or two. On a daily chart it is a day or two, and that can be most of a swing.
| Timeframe | What the averaged chart is good for | Main drawback |
|---|---|---|
| One-minute and tick charts | Short-term direction filter | Flip lag is large against small targets |
| 5- to 15-minute charts | Intraday trend filter for a one-minute execution chart | Session open and news bars distort several following opens |
| Hourly and four-hour charts | Context for intraday or multi-day trends | Overnight gaps are hidden |
| Daily and weekly charts | Swing and position trend context | Each bar of delay is a full session or week |
Three habits help. First, put the Heikin Ashi chart one timeframe above your execution chart, so the smoothing filters a longer move instead of hiding the one you are trading. Second, allow for the seed effect: StockCharts says the artificial first candle usually stops mattering after seven to 10 periods, so a freshly loaded chart with little history can show different values from one with more. Third, remember that gaps vanish. A daily Heikin Ashi chart of a futures contract will not show an opening gap at all, because the open is a midpoint of the prior candle.
For a sense of how much smoothing a daily chart adds, a measurement computed for this guide from Yahoo Finance data on two years of E-mini S&P 500 daily bars found Heikin Ashi colour runs averaging 3.83 bars against 1.97 for raw candles, with a longest Heikin Ashi run of 20 bars against 11.
Related lesson: Multiple timeframe analysis
Backtesting Heikin Ashi Charts Without Fake Fills
Backtesting Heikin Ashi charts has a trap that most other indicators do not: the test can fill your orders at averaged prices that never traded. TradingView's Help Center warns that strategies run on non-standard chart types, including Heikin Ashi, typically do not produce results representing real market conditions, because strategy orders fill on the chart's own synthetic OHLC values.
Its fix is specific to Heikin Ashi. Because each Heikin Ashi bar is tied to exactly one regular bar, TradingView lets a strategy calculate signals on the Heikin Ashi chart while opening and closing positions on standard prices, through the strategy's Properties and the "Using standard OHLC" option. NinjaTrader's help guide warns more generally that backtests on some bar types can differ from real-time results, and rounds Heikin Ashi values to the nearest tick.
A Heikin Ashi backtest checklist
A clean Heikin Ashi backtest covers each of these points:
- Signals on averaged bars, fills on real prices. Every entry, stop and target price must be a price the standard chart shows.
- Act only after the bar closes. TradingView notes that Heikin Ashi candles are calculated with a delay, since each depends on the previous candle closing. A rule that reads the current HA close before the bar ends is using information it would not have had.
- Fill at the next available price. If the signal is known at the close of bar 7, the realistic entry is the close of bar 7 or the open of bar 8, not the averaged value on bar 7.
- Discard the seed. Drop at least the first 10 bars so the first-candle artefact does not shape results.
- Include costs. Commissions and slippage on every round trip, especially for short timeframes where trades are frequent.
- Test both regimes. A trend-following rule needs a sample with ranges in it, or the results will flatter it.
- Judge outcomes, not candle hit rates. Predicting the next Heikin Ashi candle's colour is not the same as predicting the next price move. On two years of ES daily bars measured for this guide, the colour persisted 74.0% of the time but matched the next day's direction only 47.6%.
Related lesson: Backtesting a trading strategy
What the Research Shows About Heikin Ashi
The research on Heikin Ashi is thinner than the number of articles about it, and its most quoted statistic is the easiest one to misread. Wikipedia's article reports a study of one year of prices on 10 stocks in which Heikin Ashi charts showed a mean entropy of 4.2675 against 5.001 for raw data, and a 72.3% rate of predicting the next day against 49.1% for raw data. The same article clarifies that the prediction refers to the nature of the next candle, bullish or bearish. It also reports a backtest across 12 years of Dow Jones Industrial Average constituents in which 66% of the equities outperformed the index, without stating the rule.
Predicting the next Heikin Ashi candle's colour is largely mechanical. The HA open of the next bar is already known, and it sits behind price during a run, so the next candle is likely to keep the same colour. A high hit rate on that test shows the smoothing works. It does not show the chart forecasts price.
A two-year check on E-mini S&P 500 daily bars
To test that point directly, this guide measured 504 daily bars of the continuous front-month E-mini S&P 500 futures (Yahoo Finance's ES=F series) from November 1, 2024 to November 3, 2026, as of November 4, 2026. Method: Heikin Ashi values computed with the StockCharts formulas and seed, the first 10 bars dropped as seed, and bars with no body excluded. That left 489 bar pairs.
| Measurement on ES daily bars | Result |
|---|---|
| Next Heikin Ashi candle the same colour as the current one | 74.0% (362 of 489) |
| Next raw candle the same colour as the current raw candle | 49.7% (243 of 489) |
| Current Heikin Ashi colour matching the next day's close-to-close direction | 47.6% (233 of 489) |
| Next-day close higher than the prior close, all days | 53.1% (262 of 493) |
| After a green Heikin Ashi candle, next close higher | 50.7% (147 of 290) |
| After a red Heikin Ashi candle, next close lower | 43.3% (88 of 203) |
In this guide's measurement, the first row lands close to the widely quoted 72.3%. The third row is the one that matters for trading, and it shows the Heikin Ashi colour matching the next day's actual direction 47.6% of the time, below the 53.1% rate at which ES simply closed higher. On this sample, the colour persisted. Price did not follow it.
This is one instrument, one period, a continuous contract that includes roll jumps, and a one-day horizon. It says nothing about longer holds, intraday bars or rules with stops and filters. It does show why a candle hit rate should never be read as an edge.
Peer-reviewed tests of candlestick trading rules
Peer-reviewed tests of standard candlestick rules set a sober baseline for any chart built from candles. Marshall, Young and Rose (Journal of Banking and Finance, 2006) tested candlestick strategies on the stocks of the Dow Jones Industrial Average from 1992 to 2002 with a bootstrap method and found strong evidence that candlestick technical analysis was not profitable on the US stock market. Duvinage, Mazza and Petitjean (Quantitative Finance, 2013) tested candlestick rules on 5-minute bars of the 30 DJIA constituents and found that after correcting for data snooping, no single rule beat buy-and-hold after transaction costs.
Neither study tested Heikin Ashi directly. Both show how often an apparent candle edge disappears once costs and multiple testing are counted, and Heikin Ashi adds a delay on top.
Related lesson: Confirmation bias
Where to Find Heikin Ashi on Charting Platforms
Heikin Ashi is a standard chart type on most charting platforms, and the settings that matter are the ones that show real prices next to the averaged ones.
| Platform | How to switch it on | Setting worth knowing |
|---|---|---|
| TradingView | Chart type menu on the top toolbar, then Heikin Ashi | The price scale shows two values, the actual price and the HA price; "Real prices on price scale" shows only the actual price; "Color bars based on previous close" changes how candles are coloured |
| NinjaTrader | Right-click the chart, open Data Series, set the bar type to Heiken Ashi | Values are rounded to the instrument's tick size; works on second, minute, day, week, month or year intervals |
| thinkorswim | Charts tab, Style, then change Chart type from Candle to Heikin Ashi | Schwab's guide shows it side by side with a candlestick chart |
| StockCharts SharpCharts | Chart Type under Attributes in Chart Settings | Up and down colours can be changed |
Heikin Ashi platform settings to check
The TradingView colour option on Heikin Ashi charts deserves a warning. With "Color bars based on previous close" on, candle colour follows whether the close is above or below the previous close instead of the candle's own open and close. That changes every colour-based rule, so make sure the setting matches what your plan assumes.
Whichever platform you use, keep a standard candlestick chart of the same instrument visible. Most platforms let you link two chart panels so they show the same symbol and time.
On our accounts, Heikin Ashi is a built-in chart style on Tradovate, on WealthCharts and on Quantower (through Rithmic credentials), and WealthCharts' Chart Replay lets you practise reading averaged candles on historical data. All positions on our accounts are closed by 4:45 PM ET, so a daily Heikin Ashi trend is context for intraday trades, not a reason to hold overnight, and funded accounts are simulated.
Related lesson: Trading chart types
Common Heikin Ashi Mistakes
Most Heikin Ashi mistakes come from treating averaged values as real prices or treating colour as a forecast.
| Mistake | What it looks like | The rule that catches it |
|---|---|---|
| Using the colour flip as the only trigger | Entering on a flip that arrived a bar after the real turn | Require a level and body expansion, then enter at a real price |
| Placing a stop at a Heikin Ashi extreme | A stop at a value such as 6,041.07666015625 that no order can sit at | Put stops one tick beyond actual swing highs or lows |
| Reading the HA close as the current price | Thinking an exit is 9.5 ticks better than the real fill | Turn on real prices on the scale, or check the standard chart |
| Trading flips in a range | Four straight losing flip trades in a swinging market | Check swing structure first and skip small two-sided candles |
| Using candlestick pattern names | Calling a Heikin Ashi bar an engulfing pattern | Keep pattern work on the standard chart, or test a Heikin Ashi version on its own |
| Backtesting on synthetic fills | A strategy that buys at averaged prices | Fill on standard OHLC and act after the bar closes |
| Reading a candle hit rate as an edge | Quoting 72% next-candle accuracy as a forecast | Judge the method on trade outcomes after costs |
A short pre-trade routine covers most of them: confirm the regime on the standard chart, read the last few Heikin Ashi bodies and wicks, mark the level and stop from actual prices in whole ticks, size from that measured risk, and log the result so you can judge the method on a real sample.
Related lesson: Risk reward ratio
Heikin Ashi Charts FAQ
What is a Heikin Ashi chart?
A Heikin Ashi chart is a candlestick-style chart built from averaged values instead of traded prices. The close is the average of the bar's open, high, low and close, and the open is the midpoint of the previous Heikin Ashi candle. The name translates from Japanese as "average bar".
What is the difference between candlestick charts and Heikin Ashi charts?
A standard candlestick shows the prices that actually traded, including gaps. A Heikin Ashi candle shows averages, so it looks smoother, hides gaps and often plots values you could not have traded. The standard chart is better for exact levels, and the Heikin Ashi chart is faster for reading trend direction.
Is Heikin Ashi better than candlesticks?
Neither is better on its own, because they answer different questions. If you can only use one, the standard chart is safer, since stops, sizes and fills all use real prices. Running both side by side gives you real levels and a smoother trend read.
Which indicator works best with Heikin Ashi?
The most useful pairings measure something the averaged candles do not, such as real support and resistance levels, volume, or a momentum oscillator like RSI or MACD. Another smoothed trend line mostly repeats what the candle colours already show. Check whether your platform calculates the indicator from real or averaged prices.
What is the best Heikin Ashi strategy?
No single strategy is best, and the published evidence does not support confident claims. A sound approach uses Heikin Ashi as a trend filter on a plan you already trade, checks the regime first, and takes entries and stops from real prices. Test it with fills on standard prices and costs included before relying on it.
Do candlestick patterns work on Heikin Ashi charts?
Most do not, because patterns like engulfing, hammers and shooting stars are defined on real opens and closes. Doji and spinning tops can still mark indecision, and classic chart patterns such as wedges and triangles can be drawn. Published statistics for standard patterns do not apply to Heikin Ashi bars.
Why does the Heikin Ashi close not match the price?
The Heikin Ashi close is the average of the bar's four prices, not the last trade. On a wide bar the difference can be several points. Most platforms can show the real price on the scale, so use that or a standard chart whenever you need the actual price.
Heikin Ashi Trading Risk
This guide is general education, not investment advice or a recommendation to trade any product. Futures are leveraged, losses can exceed what you expect on a single trade, and a stop order does not guarantee your exit price in a fast market. All bar prices, account sizes, risk budgets and position sizes here are illustrative, and the ES daily measurement covers one instrument over one period and does not predict future results. Simulated and funded accounts are simulated and do not reflect live trading conditions. Test any rule on your own data before risking money on it.


