



TL;DR: Price improvement is a fill at a better price than the best public quote (the NBBO) when your order was routed. It only reaches orders that take liquidity, and it is usually a fraction of a cent per share. On Cboe's BZX exchange on November 3, 2026, it averaged 0.63 cents per share. Futures have no NBBO to beat, so futures traders should budget costs in ticks instead.
You hit buy on 1,000 shares quoted at $25.30 and the confirmation says $25.29. That penny is price improvement, and it's $10.00 you didn't ask for.
The useful questions come next. Where did the penny come from? Is it normal? And should it change how you place orders, or is it just a nice line on a confirmation screen?
This guide answers those with the definitions regulators use, worked math, one full day of exchange data and a plain explanation of why the idea barely applies to futures.
What Is Price Improvement
Price improvement is an execution at a better price than the National Best Bid and Offer (NBBO) at the moment your order is routed. Schwab describes it as the difference between the price you get and the best available NBBO quote when your order is placed. Fidelity measures it against the quote captured once the order is accepted and routed.
The direction depends on your side of the trade.
- Buying: improvement means paying less than the lowest displayed offer.
- Selling: improvement means receiving more than the highest displayed bid.
Fidelity's teaching example is about as small as it gets. An investor buys 200 shares while the NBBO is $49.98 x $50.00. The order fills at $49.99, one cent better than the best offer, so the saving is $2.00 on the whole trade.
Notice what that $2.00 is not. It isn't a rebate paid later, because the money is already inside the fill price. It isn't a price you can enter, because the benchmark is set by the market when the order arrives. It isn't promised either. The SEC's Investor.gov page calls price improvement "the opportunity, but not the guarantee," of a better price than the current quote.
How the NBBO Is Built

The NBBO is the benchmark every price improvement figure is measured against, so it's worth knowing how it's made. U.S. stocks trade on many exchanges at once. Each one posts its own best bid and offer, and the NBBO takes the highest bid and the lowest offer across all of them.
Schwab's illustration uses a stock quoted on several exchanges. The highest displayed bid is $25.26 on Exchange 1 and the lowest displayed offer is $25.30 on Exchange 3. Put together, the NBBO is $25.26 x $25.30, even though no single exchange shows that quote on its own.
Regulation NMS writes this down formally. Its definition says the national best bid and offer for an NMS stock is the best bid and best offer calculated and disseminated on a current and continuing basis by a competing consolidator, or calculated by a self-aggregator. In plain terms, it's a live calculation from the public, displayed quotes.
Three rule details shape how much room there is to improve on it:
- Tick size. Rule 612 bars quoting a stock priced at $1.00 or more in increments smaller than $0.01, or $0.005 for stocks whose time-weighted average quoted spread was $0.015 or less in the evaluation period. Quotes sit on that grid, but some executions can happen between the grid lines.
- Displayed quotes only. Hidden orders don't count toward the NBBO. That gap between what's displayed and what's actually available is where much of the improvement comes from.
- The trade-through rule. Rule 611 bars trading an NMS stock at a price worse than a protected quote, which keeps fills from routinely landing outside the NBBO. On June 11, 2026, the SEC proposed rescinding Rule 611 and Rule 610(e). A proposal isn't a final rule, so check the SEC's site for its status before assuming the benchmark has changed.
Related lesson: How the national best bid and offer is set
How Price Improvement Works on a Stock Order
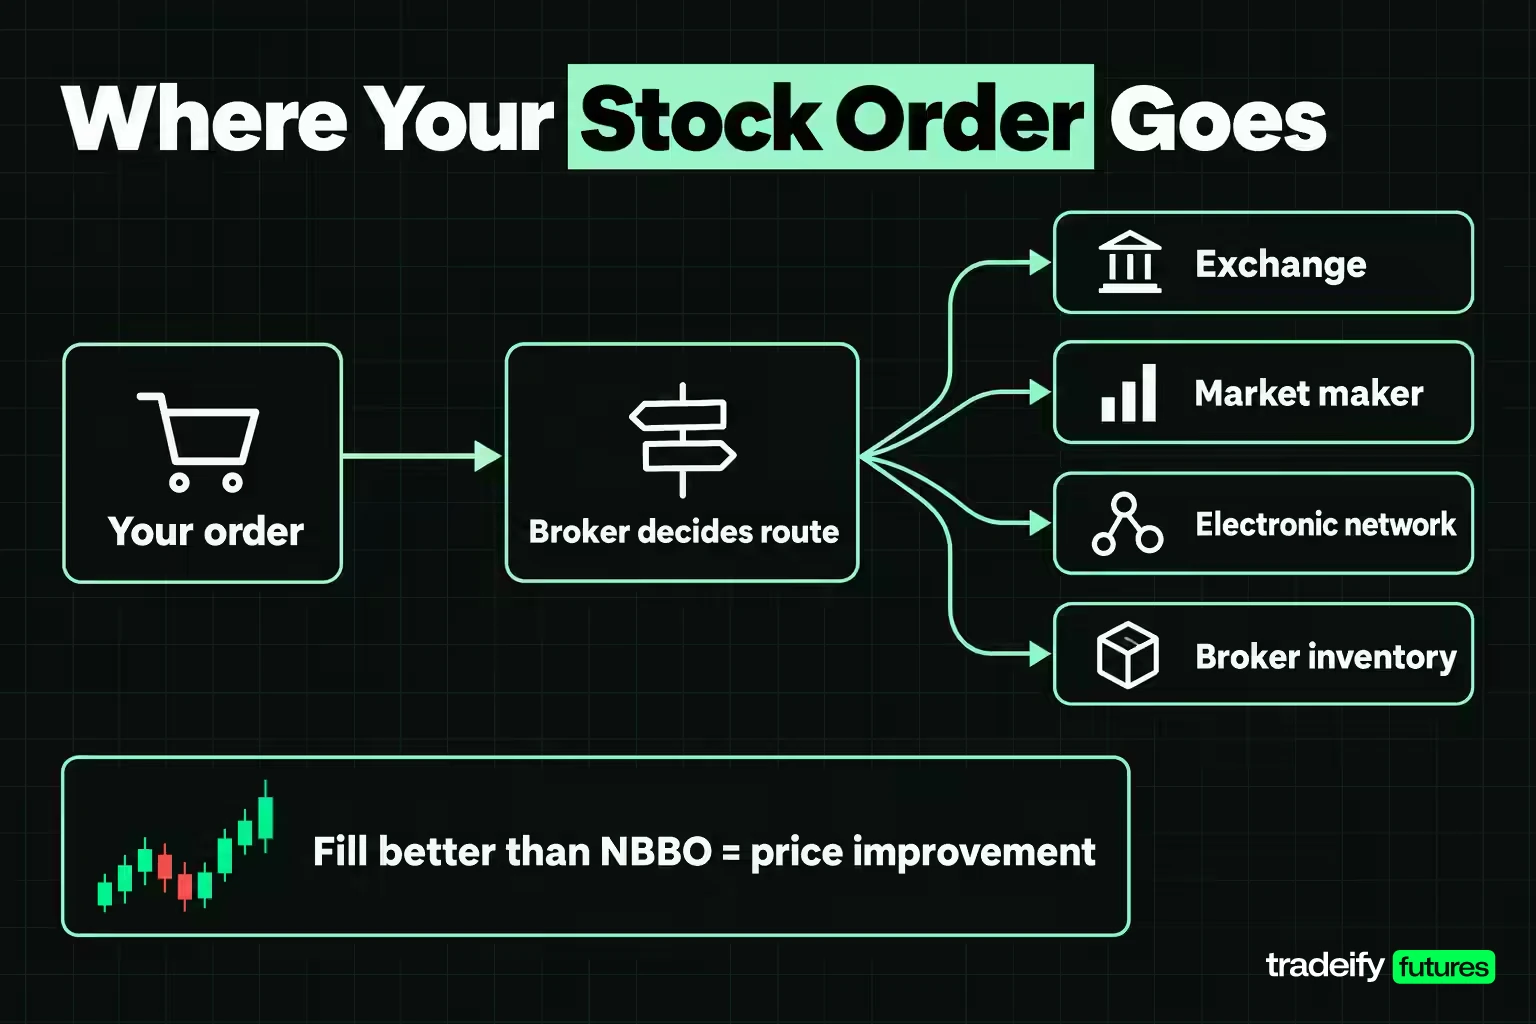
Price improvement works through routing. Most traders assume their order goes straight to "the market," but Investor.gov points out that the order goes to your broker first, and the broker decides where to send it.
A broker usually has a handful of choices:
- The exchange that lists the stock, or another exchange.
- A market maker, a firm that stands ready to buy or sell at publicly quoted prices.
- An electronic communications network that matches buy and sell orders automatically.
- Its own inventory, which is called internalization.
Fidelity says it can route an order to up to 50 market centers, and that those centers compete for order flow by improving the price. Some market makers also pay brokers for routing orders to them. Investor.gov puts that at perhaps a penny or more per share, and it's called payment for order flow.
Where the better price actually comes from
Price improvement on a stock order usually has one of three sources.
- Hidden liquidity. Schwab notes that some orders are kept hidden ("dark") on exchanges and alternative trading systems instead of being displayed. If a router finds a hidden seller at $25.29 while the best displayed offer is $25.30, your buy gets the better price.
- Market makers trading as principal. A wholesaler filling your order from its own book can beat the quote by a fraction of a cent and still earn part of the spread. Winning the flow is worth it to them.
- Exchange mechanisms built for it. Some venues run order types and auctions designed to fill retail orders inside the spread, such as Cboe's Retail Price Improvement orders.
Liquidity enhancement vs price improvement
Schwab separates price improvement from liquidity enhancement, which means filling more shares at the NBBO price than the NBBO displays. Say 500 shares show at $25.30 and you buy 1,000. Without enhancement, the second 500 might fill at $25.31 or worse. With it, all 1,000 fill at $25.30.
That isn't price improvement, because the price didn't beat the quote. It does save you from walking up the book, which is why the SEC's updated Rule 605 reports track size improvement as a separate statistic.
Speed is part of the deal too. Investor.gov notes that the extra time some markets take to execute can leave you with a worse price than the quote in a fast market. Brokers have to consider whether the chance of a better price is worth that delay.
Related lesson: How brokers get paid for routing your orders
Price Improvement Tools Exchanges Run
Exchanges compete with wholesalers for retail orders, so several run order types and auctions built specifically to deliver price improvement. The details differ, but the goal is the same: give an incoming order a fill inside the spread.
Cboe Retail Price Improvement (RPI). On Cboe's EDGX and BYX exchanges, liquidity providers can post RPI orders that improve on the NBBO in increments as small as $0.001. Only retail orders can trade against them. Cboe's own example has an NBBO of $10.00 x $10.05, an RPI order to buy at $10.001, and a retail sell order that fills at $10.001. The seller gets $0.001 per share more than the best bid.
Midpoint orders. Cboe's second example pegs the RPI order to the midpoint of $10.025. A retail buy fills there and receives $0.025 of price improvement, half the five-cent spread. Midpoint and hidden orders are a large part of why exchange-level improvement exists at all.
Options auctions. On NYSE American Options, CUBE is an electronic price improvement auction for paired orders of any size, and it can trade in penny increments. BOLD looks for extra liquidity when a marketable order would otherwise lock or cross another market.
Automated price improvement systems
Much of this runs automatically. Smart order routers scan venues for hidden size and auctions. Exchange order types reprice themselves.
IEX's D-Limit order is a good example of an automated system. When IEX's signal predicts the quote is about to move, the exchange restates the D-Limit order one tick outside the NBBO, so later fills land at a better price than the order's original limit. IEX reports that 32% of D-Limit volume in stocks priced over $250 receives price improvement, compared with 4-5% for stocks priced between $1 and $10.
That example also shows a nuance worth knowing. IEX measures price improvement against "the price you were targeting," not only against the NBBO. When you read a venue's claims, check which benchmark it uses.
How to Calculate Price Improvement
Price improvement calculation takes one subtraction and one multiplication. What matters is using the right benchmark: the NBBO at the time the order was routed, not the last trade and not the price you hoped for.
- Buy order: price improvement per share = best offer at routing minus your fill price.
- Sell order: price improvement per share = your fill price minus best bid at routing.
- Dollar total: per-share improvement multiplied by shares filled.
Fidelity describes the same method. It compares the execution price with the National Best Offer for buys or the National Best Bid for sells, at the time of the trade, multiplied by shares executed.
Cents, mils and netting
Per-share figures are often smaller than a cent, so you'll see them quoted in fractions. Cboe's daily files give dollars per share to six decimals. IEX uses mils, where one mil is one hundredth of a cent ($0.0001), so its 474 mils is "almost 5 cents."
Aggregate figures usually net out the bad fills. Fidelity's dollar value of price improvement counts orders executed better and worse than the NBBO, so a broker's average already subtracts fills that landed outside the quote.
Effective spread, the stricter measure
Price improvement tells you how much you beat the quote. Effective spread tells you how much of the spread you still paid. Fidelity's definition is the distance from the midpoint at order entry to your execution price, doubled.
Fidelity's example has a bid of $10.00, an ask of $10.04 and a buy fill at $10.03. The midpoint is $10.02, the fill is $0.01 above it, so the effective spread is $0.02. That buyer got one cent of price improvement and still paid half the quoted spread.
The SEC's 2024 Rule 605 amendments added a related metric, average effective spread divided by quoted spread. The SEC describes it as a percentage that shows how much price improvement orders received. In the Fidelity example it's $0.02 divided by $0.04, or 50%. Lower is better, and 100% means no improvement at all.
Related lesson: What the bid-ask spread costs you
Price Improvement Examples on Buy and Sell Orders
These price improvement examples use round illustrative prices unless a source is named. Each one shows a different way the number can come out.
Example 1, a penny on a buy. Schwab's example has a market order to buy 1,000 shares quoted at $25.30, filled at $25.29. That's $0.01 per share, or $10.00 total. With the NBBO at $25.26 x $25.30, the midpoint is $25.28, so the effective spread is $0.02 and effective over quoted is 50%.
Example 2, a half-penny on a sell. Suppose the NBBO is $40.00 x $40.02 and you sell 500 shares at $40.005. You received $0.005 per share more than the best bid, which comes to $2.50. The midpoint is $40.01, so your effective spread is $0.01 against a quoted spread of $0.02.
Example 3, a midpoint fill. With the NBBO at $10.00 x $10.05, a 400-share buy that fills at the $10.025 midpoint earns $0.025 per share, or $10.00. Wide spreads leave more room to improve, which is why a five-cent quote can produce more improvement than a penny-wide one.
Price improvement examples that come out at zero or worse
Example 4, no price change but more size. You buy 1,000 shares when only 500 show at $25.30, and all 1,000 fill at $25.30. Price improvement is zero. The saving shows up as liquidity enhancement instead, because none of the order had to pay $25.31.
Example 5, a negative result. You send a market buy for 1,000 shares quoted at $25.30, the quote moves before execution and you fill at $25.32. Measured against the quote at routing, that's minus $0.02 per share, or minus $20.00. This is why averages that net good and bad fills can come out smaller than the best examples suggest.
| Example | Quote at routing | Fill | Per share | Order total |
|---|---|---|---|---|
| 1,000-share buy | $25.26 x $25.30 | $25.29 | $0.01 | $10.00 |
| 500-share sell | $40.00 x $40.02 | $40.005 | $0.005 | $2.50 |
| 400-share midpoint buy | $10.00 x $10.05 | $10.025 | $0.025 | $10.00 |
| 1,000-share buy, 500 displayed | $25.26 x $25.30 | $25.30 | $0.00 | $0.00 |
| 1,000-share buy, quote moved | $25.26 x $25.30 | $25.32 | minus $0.02 | minus $20.00 |
Price Improvement in a Day of Cboe Exchange Data
Most explanations stop at "you might save a penny." Cboe publishes daily price improvement files for its four U.S. equities exchanges, one row per symbol, so you can see what the pennies actually add up to.
The BZX file for November 3, 2026 lists 8,706 symbols with shares executed. Across 417,452,389 shares, BZX recorded $2,649,599.27 of price improvement. That's 0.63 cents per share on a share-weighted basis, or about $6.35 on a 1,000-share order.
That average hides a wide range of outcomes:
| Average improvement per share, BZX, Nov 3, 2026 | Symbols | Share of symbols |
|---|---|---|
| Negative | 23 | 0.3% |
| Zero | 706 | 8.1% |
| Above zero but under 0.1 cent | 573 | 6.6% |
| 0.1 to under 0.5 cent | 2,924 | 33.6% |
| 0.5 to under 1.0 cent | 1,277 | 14.7% |
| 1.0 cent or more | 3,203 | 36.8% |
So 7,977 symbols showed positive improvement that day, and the rest showed none or less than none. Percentages are rounded, so they don't sum to exactly 100%.
Price improvement by symbol on BZX
The BZX file for November 3, 2026 also shows where well-known symbols landed in that range:
| Symbol | Shares on BZX | Total price improvement | Cents per share |
|---|---|---|---|
| QQQ | 1,991,367 | $1,674.67 | 0.08 |
| IWM | 852,973 | $1,163.18 | 0.14 |
| SPY | 1,656,694 | $2,977.98 | 0.18 |
| NVDA | 2,095,334 | $4,501.89 | 0.21 |
| AMZN | 1,372,207 | $5,415.19 | 0.39 |
| MSFT | 636,996 | $4,747.73 | 0.75 |
| TSLA | 649,565 | $5,888.43 | 0.91 |
| AAPL | 1,557,346 | $14,894.29 | 0.96 |
| META | 387,232 | $7,987.93 | 2.06 |
| AMD | 686,078 | $24,340.36 | 3.55 |
The index ETFs sit at the bottom. On 1,000 shares, SPY's 0.18 cents works out to $1.80, while AMD's 3.55 cents works out to $35.48.
The reason is the spread. An ETF that trades a penny wide (or tighter) leaves almost nothing between the bid and the offer to improve on. That's not the venue doing a poor job; there's simply no room. A stock with a wider spread leaves more room for a midpoint or hidden order to land inside it. Small improvement and cheap execution usually arrive together, so a low number on SPY isn't a bad sign.
Two limits on this data. It's one exchange on one day, not the whole market, and it covers executions on BZX rather than the wholesaler fills most retail orders receive. Treat it as a sense of scale, not a forecast for your next order.
Price Improvement on Market Orders vs Limit Orders
Price improvement goes to orders that take liquidity. A market order or a marketable limit order (a buy limit at or above the best offer, or a sell limit at or below the best bid) arrives wanting to trade now, and the router looks for someone willing to fill it inside the quote.
A resting limit order is different. If your buy limit sits at $25.26 on the bid, you are part of the NBBO. A seller who hits your bid may get improved by someone else's hidden order, but your order fills at your price when it fills. You're supplying the quote that other orders get measured against.
That's why execution-quality reporting focuses on marketable orders. Fidelity's comparisons cover Rule 605 eligible market and marketable limit orders. Rule 605's "covered order" definition includes market orders and limit orders, immediate-or-cancel orders among them, received during regular trading hours while an NBBO is being disseminated.
A few practical consequences follow:
- Don't use improvement to justify market orders everywhere. A market order in a wide or fast market can fill well beyond the quote. A few tenths of a cent of improvement on average won't make up for one bad fill.
- Marketable limits are the middle ground. A buy limit set at the current offer is still eligible for improvement, but it caps how far the fill can run if the quote moves.
- Resting limits trade improvement for price control. You may wait, or never fill. But you pick the price, and you never pay more than it.
- Watch the benchmark on venue claims. IEX's D-Limit counts improvement against the order's own limit price, which is a different yardstick from the NBBO.
Related lesson: How each order type behaves
Price Improvement and Best Execution
Price improvement is one of the things brokers are required to look at when they decide where to send your stock orders. That obligation is called best execution.
FINRA Rule 5310 requires a member to use reasonable diligence to find the best market for a security and buy or sell there so that the resulting price to the customer is as favorable as possible under prevailing market conditions. A broker that routes orders automatically or internalizes them must run "regular and rigorous" reviews of execution quality, security by security and order type by order type, at least quarterly.
Price improvement opportunities are named in that review. FINRA defines them as the difference between the execution price and the best quotes prevailing when the order is received. If another market center would consistently deliver better results, the broker has to change its routing or justify why it hasn't.
Best execution isn't just about price, though. Investor.gov notes that brokers have to consider the trade-off between a possible better price and the extra time it may take to get it. A venue that improves one order in ten by a tenth of a cent but executes slowly in fast markets may not be the better choice.
Rule 605 reports and the 2024 amendments
The public tool for checking execution quality is Rule 605 of Regulation NMS, adopted in 2000 so investors could compare market centers. Fidelity summarizes it as requiring market centers and broker-dealers with 100,000 or more customer accounts to disclose monthly execution data.
The SEC's 2024 amendments widened who must report to include larger broker-dealers and single dealer platforms. They also added a summary report and new measures such as effective over quoted spread and size improvement. The SEC extended the compliance date for those amendments to August 1, 2026.
Related lesson: How a trade gets executed
What Brokers Publish About Their Fills
Brokers that route stock orders treat price improvement as part of what they sell, and their offerings tend to come in a few forms:
- Routing reach. Fidelity says it can send an order to up to 50 market centers, including exchanges, market makers and alternative trading systems, which compete by improving the price.
- Fill-level display. Schwab and Fidelity both show price improvement on individual filled orders, and Fidelity adds a pricing summary of savings by month, year and year-to-date.
- Published statistics. Broker execution-quality pages report the share of orders improved and average savings, alongside links to SEC Rule 605 and Rule 606 reports.
- Directed routing. Investor.gov notes that some brokers let active traders direct orders to the market maker or ECN of their choice, and some charge for directing a trade.
The published statistics are marketing as well as disclosure, so read them for what they measure.
Fidelity's execution-quality page is a useful example of the format. As of November 4, 2026, it states:
- Over $3.2 billion saved for customers through price improvement on trades in 2025.
- 95.37% of shares price-improved, per Fidelity's Q1 2026 statistics.
- An average effective spread of $0.0056 per share for Q1 2026.
- Average savings of $26.69 per 1,000-share order versus an industry average of $5.10, and $4.38 versus $0.57 per 100-share order, for April 1, 2025 to March 31, 2026.
The footnotes matter as much as the headline. Those per-order figures are built from average savings per share on Rule 605 eligible orders in a size band, multiplied by 100 or 1,000 for consistency. Fidelity notes that its actual average order sizes in those bands were 440 and 1,069 shares.
When you compare broker claims, ask three questions:
- Which orders are counted? Market and marketable limit orders during regular hours are the usual base. Resting limits and after-hours orders often aren't.
- Percent of shares or dollars per order? A high share of improved orders can still mean very small amounts per share.
- Is it net? A dollar figure that nets fills better and worse than the NBBO is more honest than one that counts only the wins.
How to Check Whether You Received Price Improvement
You can check whether you received price improvement on your own fills in a few minutes. Many brokers show it directly.
- Schwab.com: Trade, then Order Status, filter to Filled Orders and open the order details.
- thinkorswim desktop: add the Price Improvement column to Order History through the gear icon, then view it under Monitor, Account Statement.
- Fidelity: savings appear on the Orders page, with a pricing summary by month, year and year-to-date.
If your broker doesn't show it, run the check yourself:
- Pick your last ten marketable stock orders where you noted the bid and offer when you sent them.
- For buys, subtract the fill from the offer. For sells, subtract the bid from the fill.
- Multiply each result by shares filled and add them up. That's your realized price improvement.
- Now repeat the math using the midpoint instead of the bid or offer, and double it. That's your effective spread, the part of the spread you actually paid.
If the first number is small and the second is large, you're paying most of the spread and collecting fractions of a cent. That's a routing and order-type question, not bad luck, and it's worth knowing before you blame your entries. Your broker's Rule 605 report, and its Rule 606 routing report on where orders go, are the place to ask the next question.
Why Futures Fills Don't Get Price Improvement
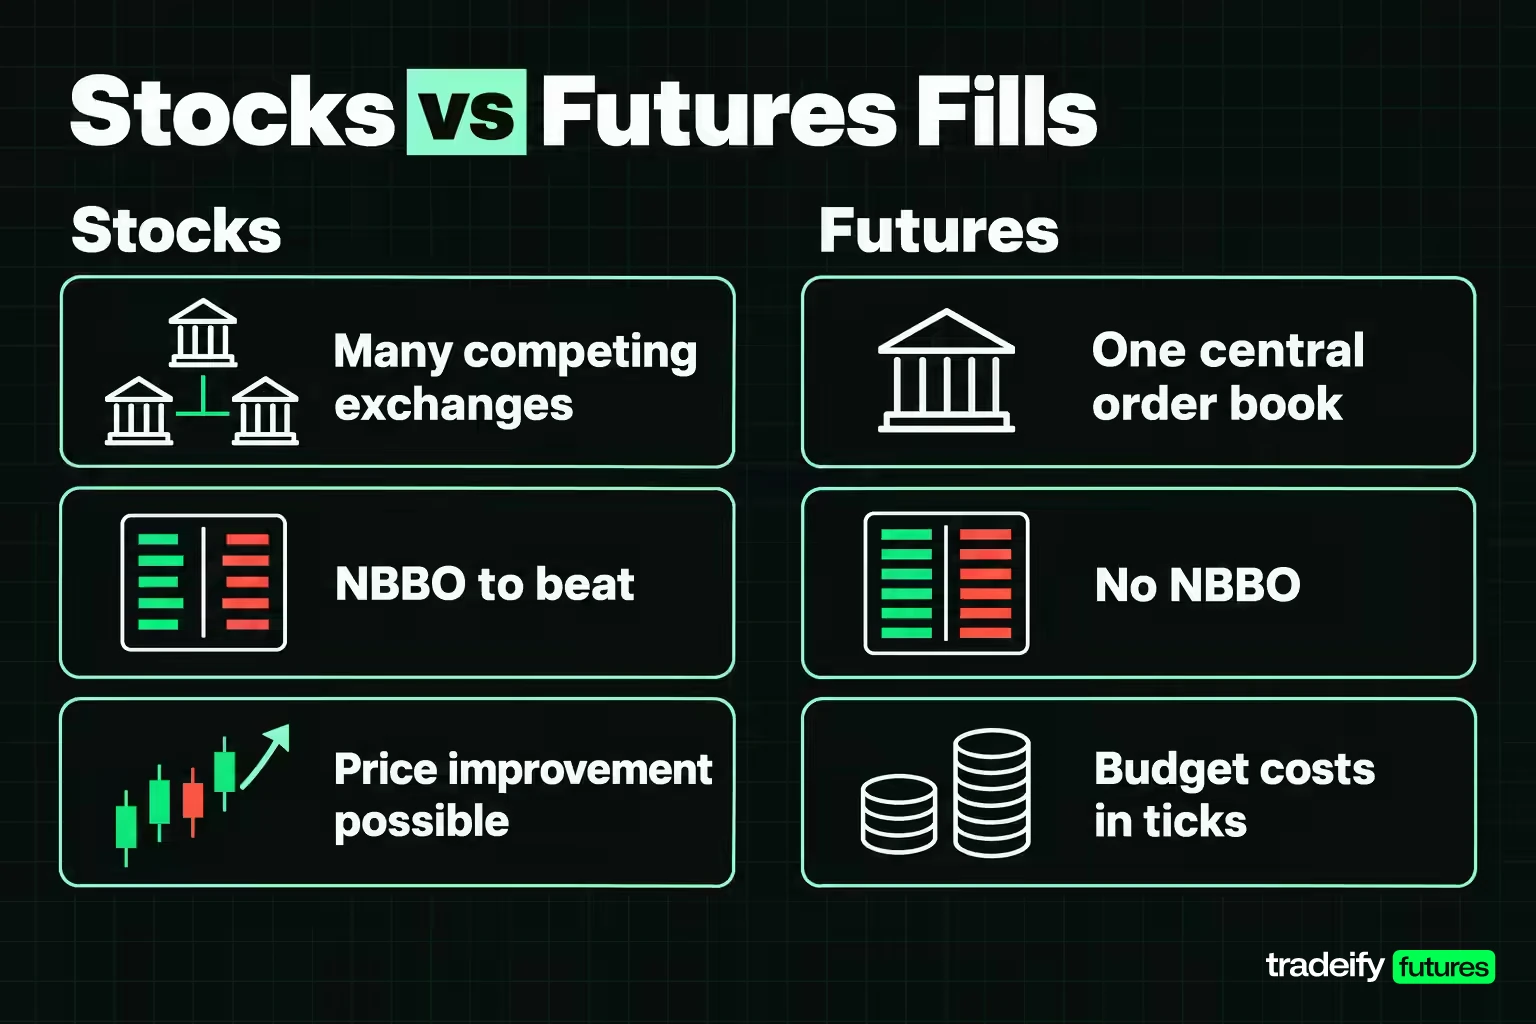
Price improvement, a fill better than the NBBO, is a feature of U.S. stock and options market structure. Futures work on different plumbing, and if you trade ES or MES, the difference changes what you should measure.
An E-mini S&P 500 contract trades on one central limit order book, CME Globex. There's no set of competing exchanges to consolidate, no NBBO, no wholesaler bidding for your order and no trade-through rule. Regulation NMS covers NMS stocks and listed options, and futures fall outside it.
On that single book, an incoming order trades against resting orders at their prices. CME's matching steps describe how fills are allocated to resting orders when an aggressing order arrives, using steps such as FIFO, pro rata and TOP. Those steps decide who gets filled, not what price you pay.
Here's an illustrative book. MES is bid at 7,000.00 and offered at 7,000.25. You send a buy limit at 7,000.50. CME's rule is that a limit buy executes at or below its limit price, so you fill at 7,000.25, the resting offer. You did better than your own limit, but you didn't beat the best offer, because the best offer is the trade.
How CME futures reward improving the market
Futures do reward improving the market, just not the aggressor. CME's TOP step gives allocation priority to the first incoming order that betters the market, which is a resting order that sets a new best bid or offer. The trader who tightens the quote gets paid in queue priority instead of fractions of a cent.
Budget futures costs in ticks
The practical move is to stop looking for improvement and count ticks instead. It's a cost you can see before you click. An MES tick is 0.25 index points, or $1.25 per contract. An ES tick is $12.50.
Compare that with stock price improvement. Ten dollars of improvement, a full penny on 1,000 shares, equals 8 MES ticks. Cboe BZX's 0.63-cent average for November 3, 2026, about $6.35 on 1,000 shares, is roughly 5 MES ticks. One tick of slippage on 5 MES contracts is $6.25, which wipes out the same amount in a single fill.
On our accounts you trade CME futures such as ES and MES, so there's no NBBO to beat and no price improvement line to look for. What you can control are costs you can count: round-trip commissions of $5.76 per ES contract and $1.82 per MES contract at the time of writing, plus the spread and any slippage. Our Help Center's order-type guidance is to check the bid-ask spread before a market order and to use a limit if the spread is wider than 2 ticks. Evaluation and funded accounts are simulated.
Related lesson: What slippage costs on a futures fill
Price Improvement FAQ
Is price improvement guaranteed?
No. Schwab says price improvement isn't guaranteed and won't occur in all situations. On Cboe's BZX file for November 3, 2026, 706 symbols with shares executed showed zero improvement and 23 showed a negative average.
Is price improvement a rebate?
No. It's a better execution price, so the money is already inside your fill. Brokers such as Fidelity display the saving on the order and in a summary, but nothing is paid out separately.
Why is price improvement often less than a cent?
Quotes for most stocks sit on a $0.01 grid, or $0.005 for the tightest names under Rule 612. Much of the improvement comes from hidden, midpoint and retail-only orders that fill inside that grid. Cboe's RPI orders, for instance, improve in increments as small as $0.001.
Do futures contracts get price improvement?
Not in the stock-market sense. A futures contract such as ES trades on one exchange order book with no NBBO, and an incoming order fills at the resting order's price. Futures traders measure execution cost in ticks and slippage instead.
Is HFT illegal?
High-frequency trading as such isn't banned in the U.S.; the law targets specific conduct. The Commodity Exchange Act, for example, makes spoofing unlawful, which it describes as bidding or offering with the intent to cancel before execution. Speed itself isn't the offense; manipulative intent is.
Can price improvement be negative?
Yes. If the quote moves against you before your order executes, your fill can land worse than the NBBO captured at routing. Broker averages that net good and bad fills include those cases.
Does price improvement mean I got the best possible price?
Not necessarily. It means you beat the displayed quote at routing. Hidden liquidity at an even better price may have existed elsewhere, which is why Rule 605 reports and best-execution reviews compare venues over many orders.
Trading involves substantial risk of loss and isn't suitable for everyone. Futures are leveraged, so losses can exceed what you expect and can build quickly, and no order type or routing feature removes market, spread or slippage risk. Evaluation and funded accounts at prop firms are simulated, and simulated results don't reflect live market execution. Exchange and broker statistics in this article are dated snapshots, and this article is educational, not investment advice.


