



TL;DR: Win rate vs payoff ratio is one equation, since break-even win rate = 1 / (1 + payoff ratio), so a 2.0 payoff needs 33.33%. Across ten exit settings on 5,031 ES sessions, win rate ran 25.00% to 51.93% and payoff ratio 0.998 to 3.006. The win rate's margin over break-even matched profit or loss in all ten settings. Costs and sample size decide whether that margin is real.
Sooner or later you get two opposite pieces of advice. One says a high win rate is what matters. The other says you can be wrong most of the time as long as your winners are big.
Both are half right, and following either one alone can cost you money. Win rate tells you how often you get paid, and payoff ratio tells you how much. Neither one tells you whether the strategy makes money until you read it against the other.
This guide works through the definitions and the math, then tests both statistics on one E-mini S&P 500 (ES) breakout rule across 5,031 daily sessions with ten different stop and exit settings. The signal never changes. Only the exits do, which is the same decision you face after a rough month when you start wondering whether to tighten the stop or move the target.
What Win Rate Means and How to Calculate It
Win rate is the share of your trades that close with a profit. The calculation is simple:
Win rate = winning trades / total trades x 100
If a trade record has 47 winners out of 120 trades, the win rate is 47 / 120 = 39.17%.
Two choices change the number, so decide them before you count:
- Scratches. A trade that closes at exactly zero (or loses only the commission) is not a win. Most traders count it as a loss or leave it out, and the choice should stay the same every time you measure.
- Partial exits. If you scale out of one position in three pieces, decide whether that is one trade or three. Counting it as three inflates the win rate when the first piece is a quick small target.
Win rate says nothing about size, and that is where it fools people. A record that wins seven trades out of ten feels great right up until you notice each loss is four times the average win. Measuring that size is the job of the payoff ratio.
Payoff Ratio vs Risk-Reward Ratio
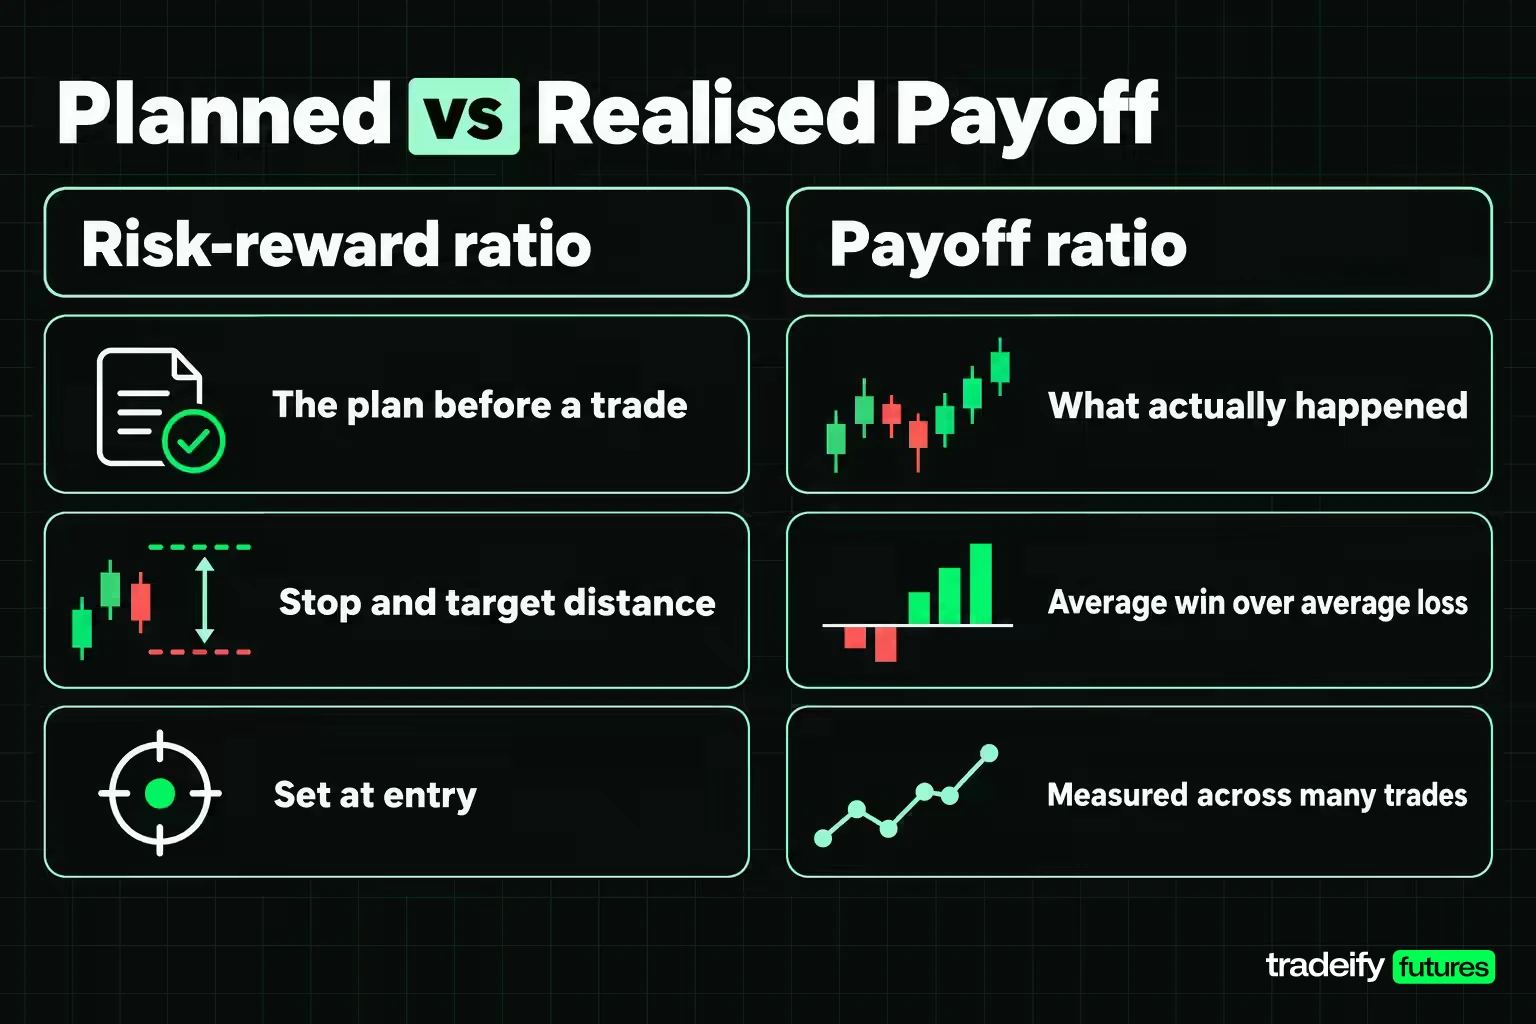
The risk-reward ratio is the plan you set before a trade. If your stop is 10 points away and your target is 20 points away, the risk-reward ratio is 1:2, often written as "2R" (two units of risk). Some traders write it reward-first as 2:1. Both describe the same plan.
The payoff ratio is what actually happened across many trades:
Payoff ratio = average winning trade / average losing trade
The two numbers are related but not the same. A planned 2R target becomes a realised payoff ratio only after slippage, gaps, early exits and time stops have had their say.
An original backtest run for this guide on 5,031 sessions of Yahoo Finance ES futures daily data shows the drift clearly. With a 2.0 x ATR stop, a planned 1R target produced a realised payoff ratio of 0.998, a planned 2R target produced 1.989, and a planned 3R target produced 3.006. The first two came in slightly under plan because a few losing trades gapped through the stop and filled at a worse open. The 3R row came in slightly over plan because some winners gapped through the target and filled at a better open.
Small drifts like that matter more than they look, because the break-even win rate comes from the realised payoff ratio, not the planned one. Use the plan to set orders. Use the realised number to judge the strategy.
Related lesson: Risk reward ratio
The Expectancy Formula That Links Win Rate and Payoff Ratio
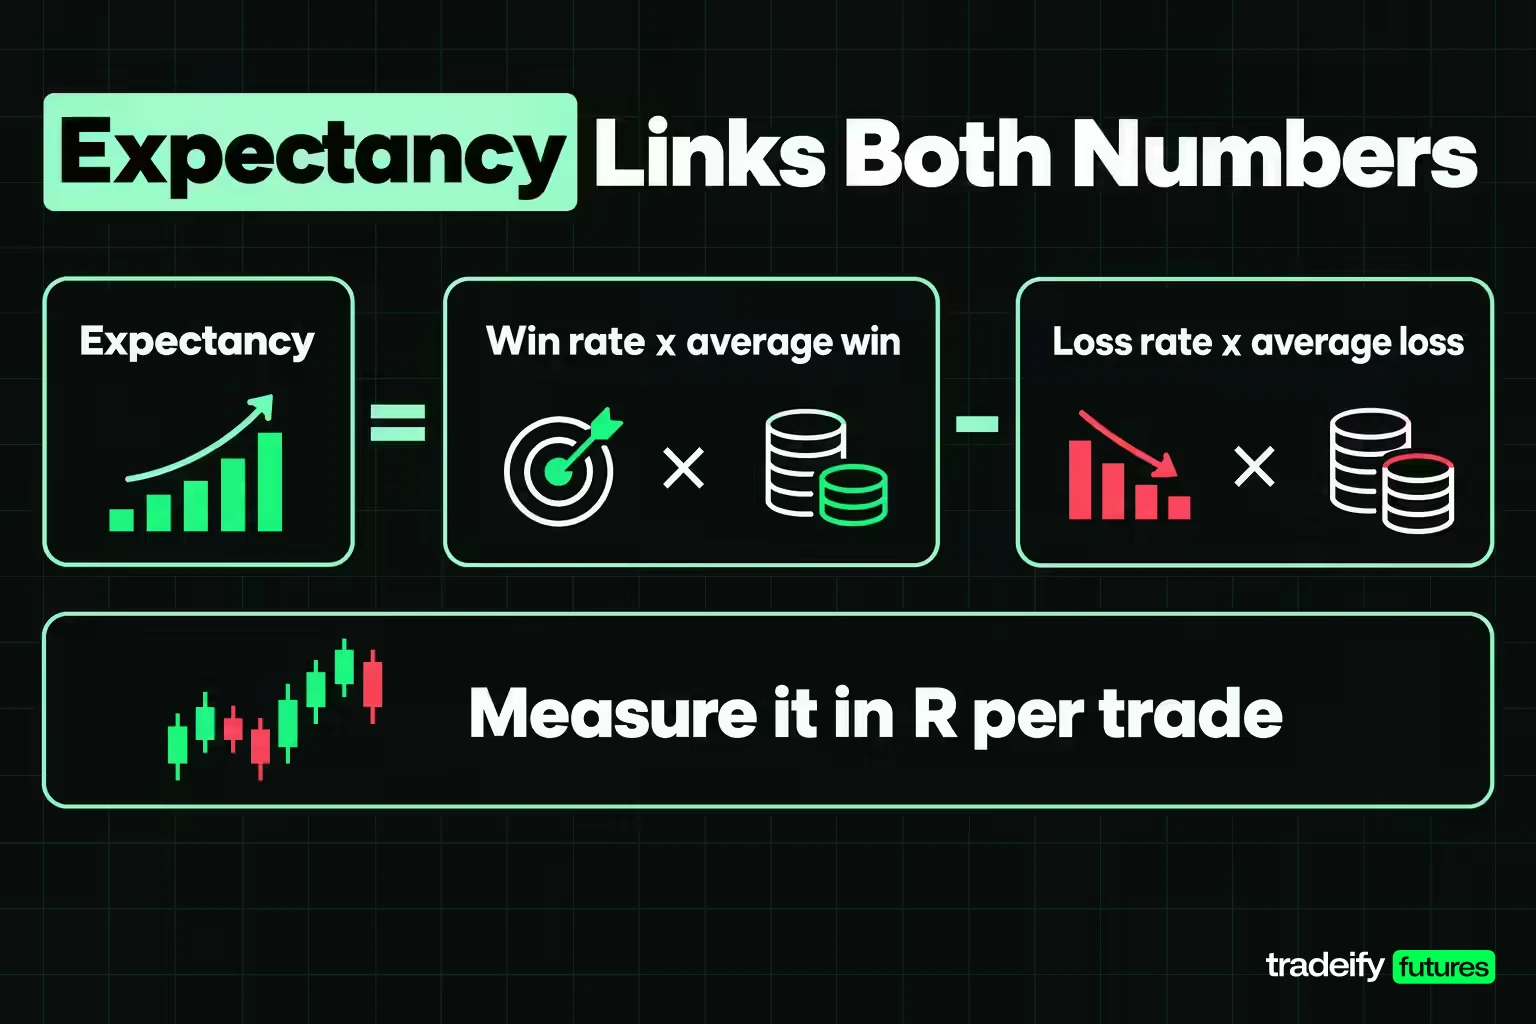
Expectancy is the average result per trade. It is where win rate and payoff ratio finally meet:
Expectancy = (win rate x average win) - (loss rate x average loss)
Measure it in R (multiples of the risk you planned at entry) so that results from different stop sizes and contract counts can be compared.
Take one row of an original ES breakout backtest run for this guide on 5,031 sessions of Yahoo Finance daily data: a 2.0 x ATR stop with a channel exit. The record had 86 trades, a 38.37% win rate, an average win of 1.4214R and an average loss of 0.8497R:
- 0.3837 x 1.4214 = 0.5454
- 0.6163 x 0.8497 = 0.5237
- Expectancy = 0.0218R per trade
That is positive, but barely. A second form of the same equation shows why:
Expectancy = (win rate - break-even win rate) x (1 + payoff ratio) x average loss
On that row, the win rate was 0.96 percentage points above its break-even win rate, and 0.0096 x 2.673 x 0.8497 gives the same 0.0218R. The sign of the expectancy is the sign of the margin. If your win rate sits above the break-even line set by your payoff ratio, the strategy made money before costs. If it sits below, it lost.
Related lesson: Trading expectancy
Break-Even Win Rate Table by Payoff Ratio
Set expectancy to zero and solve, and you get the one formula worth memorising:
Break-even win rate = 1 / (1 + payoff ratio)
No instrument, market or strategy is involved, so the table below applies to anything you trade. The last column shows how many losers out of every 100 trades the payoff ratio can absorb before the strategy stops making money.
| Payoff ratio | Break-even win rate | Losers absorbed per 100 trades |
|---|---|---|
| 0.5 | 66.67% | 33 |
| 1.0 | 50.00% | 50 |
| 1.5 | 40.00% | 60 |
| 2.0 | 33.33% | 67 |
| 2.5 | 28.57% | 71 |
| 3.0 | 25.00% | 75 |
| 4.0 | 20.00% | 80 |
To use it on your own record, divide your average win by your average loss, find the nearest row, and compare the break-even win rate with the win rate you actually achieved.
- Above the line: the strategy made money before costs. Whether the gap is big enough to trust depends on how many trades produced it.
- On the line: it is a coin flip before costs and a slow loss after them.
- Below the line: discipline cannot fix it. Either the payoff ratio or the win rate has to move, and the table shows by how much.
A "good" win-loss ratio therefore has no single answer. A 45% win rate is comfortable at a payoff ratio of 2.0 and losing at 1.0.
Win Rate vs Payoff Ratio Tested on One ES Rule
Definitions are easy to agree on. Applying them is harder. To see how win rate and payoff ratio behave on real prices, this guide ran one E-mini S&P 500 (ES) breakout rule through ten exit settings on Yahoo Finance daily data, with the signal held fixed.
How the ES win rate study was run
- Data: 5,031 complete ES front-month continuous daily sessions from Yahoo Finance, September 18, 2006 to September 15, 2026.
- Signal: a close above the prior 50-session high goes long; a close below the prior 50-session low goes short.
- Entry: the next session's open, with one tick of slippage.
- Risk unit (1R): the stop distance, set as a multiple of the 14-session Wilder ATR (average true range) at the signal bar.
- Exits: either a channel exit (a close beyond the opposite 20-session channel, filled at the next open minus one tick), a fixed target of 1R, 2R or 3R, or a time exit at the close of the 20th session. Every trade also has a 250-session cap.
- Fills: a stop that price gaps through fills at the open. If one bar touches both the stop and the target, the stop is assumed to fill first. One position at a time.
On the 2.0 x ATR channel row, the average stop was about 82 points, roughly $4,098 per ES contract at $50 per point. That is a daily-bar swing rule, far wider than most intraday risk budgets, so read the results as a lesson in ratios rather than a strategy to copy.
Win rate and payoff ratio results by exit setting
| Exit setting | Trades | Win rate | Payoff ratio | Break-even win rate | Margin (points) | Expectancy | Max drawdown |
|---|---|---|---|---|---|---|---|
| 1.0 x ATR stop, channel exit | 116 | 25.00% | 2.995 | 25.03% | -0.03 | -0.0012R | 23.76R |
| 1.5 x ATR stop, channel exit | 95 | 31.58% | 2.127 | 31.98% | -0.40 | -0.0115R | 18.63R |
| 2.0 x ATR stop, channel exit | 86 | 38.37% | 1.673 | 37.41% | 0.96 | 0.0218R | 9.23R |
| 3.0 x ATR stop, channel exit | 82 | 40.24% | 1.390 | 41.84% | -1.60 | -0.0273R | 8.95R |
| 4.0 x ATR stop, channel exit | 77 | 45.45% | 1.254 | 44.37% | 1.09 | 0.0144R | 6.01R |
| 2.0 x ATR stop, 1R target | 181 | 51.93% | 0.998 | 50.06% | 1.88 | 0.0377R | 9.00R |
| 2.0 x ATR stop, 2R target | 126 | 38.89% | 1.989 | 33.46% | 5.43 | 0.1634R | 9.00R |
| 2.0 x ATR stop, 3R target | 98 | 28.57% | 3.006 | 24.96% | 3.61 | 0.1445R | 9.00R |
| 4.0 x ATR stop, 2R target | 53 | 43.40% | 2.075 | 32.52% | 10.87 | 0.3227R | 5.00R |
| 2.0 x ATR stop, 20-session time exit | 148 | 45.95% | 1.400 | 41.66% | 4.28 | 0.0906R | 10.14R |
What the ES study shows about win rate and payoff ratio
In the ten-setting ES breakout backtest, win rate and payoff ratio moved against each other. Across the ten settings, win rate ran from 25.00% to 51.93% and payoff ratio from 0.998 to 3.006, with a rank correlation of -0.8545. No change to the exits raised both.
The win rate margin over break-even predicted the result every time. Three settings finished below their break-even win rate, and all three lost money. The other seven sat above it and made money. The margin's sign matched the expectancy's sign in all ten settings.
Drawdown followed neither statistic neatly. Maximum drawdown ranged from 5.00R to 23.76R, and the tightest stop produced the deepest drawdown.
Which Matters More, Win Rate or Payoff Ratio
Neither, on its own. An original ES breakout backtest run for this guide on 5,031 sessions of Yahoo Finance daily data, with ten different exit settings on the same signal, makes the point in two rows.
The highest payoff ratio was not the best result. The 3R target setting (2.0 x ATR stop) had a payoff ratio of 3.006 and returned 0.1445R per trade. The 4.0 x ATR stop with a 2R target had a payoff ratio of 2.075 and returned 0.3227R, more than twice as much, because its 43.40% win rate sat 10.87 points above its break-even line.
The highest win rate was not the best result either. The 1R target setting won 51.93% of its trades, the most in the set, and still cleared its 50.06% break-even line by only 1.88 points. Its expectancy was 0.0377R, under a quarter of the 2R target setting's 0.1634R.
So the honest answer to "which matters more" is the gap between them. A win rate means something only next to the break-even line its payoff ratio sets, and a payoff ratio means something only next to the win rate that comes with it.
Can a Low Win Rate Strategy Be Profitable
Yes, if the payoff ratio clears the break-even line with room to spare.
In an original ES breakout backtest run for this guide on 5,031 sessions of Yahoo Finance daily data, a 2.0 x ATR stop with a 3R target won only 28.57% of its trades, and it was profitable because its break-even win rate was 24.96%. Losing seven trades out of ten is normal for that kind of rule. The math was built for it.
The same low win rate can also be a losing one. A 1.0 x ATR stop with a 20-session channel exit, on the same signal, won 25.00% of its trades with a payoff ratio of 2.995, which looks like the classic "cut losers, let winners run" profile. Its break-even win rate was 25.03%, so it finished at -0.0012R per trade. A stop that close turned too many good trends into small losses before they could pay.
The test for any low win rate is the same arithmetic. A 30% win rate needs a payoff ratio above 2.33 to make money before costs (1 / 0.30 - 1). If your realised payoff ratio is 2.0, a 30% win rate loses money no matter how disciplined the execution is.
The harder part is behavioural. A low win rate means long runs of losses are part of the plan. Those runs are exactly where traders abandon a sound rule, or start moving targets closer just to feel right more often.
Profit Factor and Its Link to Win Rate
Profit factor is gross profit divided by gross loss. A profit factor of 1.5 means the winners added up to one and a half times the losers.
It can be written directly in terms of win rate and payoff ratio:
Profit factor = (win rate x payoff ratio) / (1 - win rate)
In an original ES breakout backtest run for this guide on 5,031 sessions of Yahoo Finance daily data, a 2.0 x ATR stop with a channel exit had a 38.37% win rate and a 1.673 payoff ratio, so 0.3837 x 1.673 / 0.6163 = 1.04. A 2R target setting came in at 1.27 and a 4.0 x ATR stop with a 2R target at 1.59.
A profit factor of exactly 1.0 is the break-even win rate in another form. Above 1.0 means the win rate cleared the line; below 1.0 means it did not. Profit factor is handy because it folds win rate and payoff ratio into one figure, but it hides how many trades produced it, so read it next to the trade count.
Related lesson: Profit factor
How Many Trades a Win Rate Needs
A win rate measured on a small sample is a rough estimate, not a fact. Win rate is a sample proportion, and sample proportions wobble. One rough month is one line in the sample, not a verdict.
In an original ES breakout backtest run for this guide on 5,031 sessions of Yahoo Finance daily data, a 2.0 x ATR stop with a channel exit produced a 38.37% win rate over 86 trades. That win rate has a standard error of 5.24 percentage points. The 95% interval runs from roughly 28.1% to 48.6%. The break-even line was 37.41%, comfortably inside that range, so the record cannot tell a small edge from no edge.
The trades needed to separate a win rate margin from zero at 95% confidence shrink quickly as the margin grows. The margin is the win rate minus the break-even win rate:
| Study row | Margin (points) | Trades needed | Trades in sample |
|---|---|---|---|
| 2.0 x ATR stop, channel exit | 0.96 | 9,788 | 86 |
| 4.0 x ATR stop, channel exit | 1.09 | 8,005 | 77 |
| 2.0 x ATR stop, 1R target | 1.88 | 2,723 | 181 |
| 2.0 x ATR stop, 3R target | 3.61 | 553 | 98 |
| 2.0 x ATR stop, 20-session time exit | 4.28 | 509 | 148 |
| 2.0 x ATR stop, 2R target | 5.43 | 290 | 126 |
| 4.0 x ATR stop, 2R target | 10.87 | 71 | 53 |
The formula is trades = 1.96² x BE x (1 - BE) / margin², with BE the break-even win rate. Only the widest-margin row came close to its requirement. The lesson for your own record: the size of the edge, not the length of the record, does most of the work. A thin margin needs thousands of trades before it means anything.
Related lesson: Backtesting a trading strategy
Losing Streaks at a Given Win Rate
A low win rate brings long losing streaks, and you can calculate them before they happen. The probabilities below are exact, computed over the loss rate rather than estimated, for two settings of an original ES breakout backtest run for this guide on 5,031 sessions of Yahoo Finance daily data.
| Losing streak | 38.37% win rate (2.0 x ATR channel) | 51.93% win rate (1R target) |
|---|---|---|
| 5+ losses in 100 trades | 98.49% | 75.22% |
| 8+ losses in 100 trades | 55.51% | 13.12% |
| 8+ losses in 250 trades | 87.73% | 30.61% |
| 10+ losses in 250 trades | 53.22% | 7.96% |
| 12+ losses in 250 trades | 24.50% | 1.88% |
At a 38.37% win rate, ten losses in a row shows up in more than half of all 250-trade stretches. At 51.93%, the same streak is more than six times less likely.
The study's actual records matched the math. The 2.0 x ATR channel setting's longest losing run was 7, against an expected longest run of 7.94 over its 86 trades. The 1R target setting's was 8 over 181 trades, against an expected 6.50.
So a streak is not evidence that the rule broke. It is what the win rate implies, and you could have known it in advance. Knowing it is what keeps you from tearing up a working rule on loss number eight. A higher win rate does not raise expectancy by itself, but it does change how the equity curve feels to sit through, and that is a fair reason to prefer one setting over another.
Drawdown Risk With a Profitable Win Rate
A win rate above break-even does not protect you from drawdown. In an original ES breakout backtest run for this guide on 5,031 sessions of Yahoo Finance daily data, the profitable settings still drew down between 5.00R and 10.14R from their equity peaks, and the 1.0 x ATR channel setting, which was roughly break-even, drew down 23.76R.
Drawdown in R turns into money through your risk per trade. A 10R drawdown at 1% risk per trade costs about 10% of the account; at 3% it costs about 30%. Size so the worst drawdown your win rate implies is one you can survive, not just one you hope to avoid.
Related lesson: Maximum drawdown
How Trading Costs Raise the Break-Even Win Rate
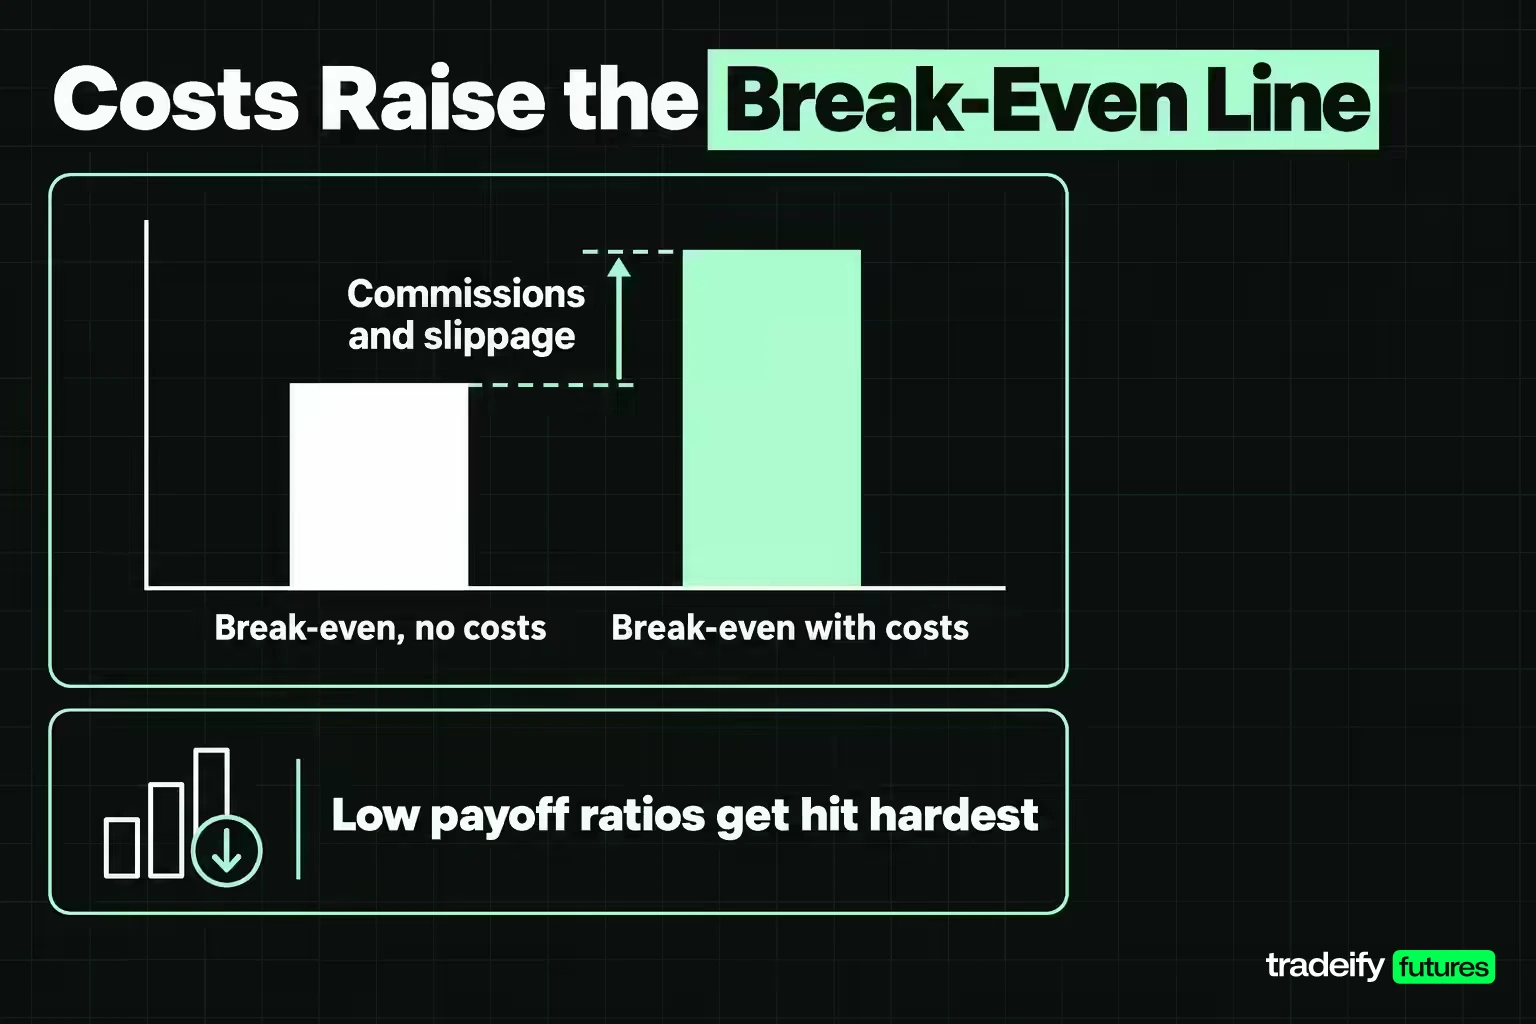
Commissions and slippage move the break-even line up, and they move it further for low payoff ratios. Write the cost per trade as c, in units of your average loss, and the break-even win rate becomes:
Break-even win rate = (1 + c) / (1 + payoff ratio)
| Cost per trade | Payoff 1.0 | Payoff 2.0 | Payoff 3.0 |
|---|---|---|---|
| None | 50.00% | 33.33% | 25.00% |
| 0.05R | 52.50% | 35.00% | 26.25% |
| 0.10R | 55.00% | 36.67% | 27.50% |
The same 0.10R of cost lifts the line 5 points at a payoff ratio of 1.0 and 2.5 points at 3.0.
An illustrative intraday ES trade shows how fast costs reach those levels. With an 8-point stop, 1R is $400 per contract. One tick of slippage on the way in and out is $25, and an illustrative $5 round-turn commission brings the total to $30, or 0.075R. At a payoff ratio of 1.0, the break-even win rate moves from 50.00% to 53.75%; at 3.0, from 25.00% to 26.88%.
An original ES breakout backtest run for this guide on 5,031 sessions of Yahoo Finance daily data shows the same effect on real trades. Using an illustrative $5 round-turn commission plus the one-tick slippage already in the results, costs took 30.35% of the gross expectancy on a 2.0 x ATR stop with a channel exit (gross 0.0287R, net 0.0200R) but only 3.87% on the same stop with a 2R target (gross 0.1680R, net 0.1615R). The thinner the edge, the bigger the share costs take.
That is the catch in tightening targets to win more often. It moves you toward the low-payoff end, where costs take the biggest bite.
Related lesson: Commission adjusted futures breakeven
Using Win Rate and Payoff Ratio for Trading Decisions
Turn the numbers into a decision in this order:
- Pull at least the last 50 to 100 trades from one strategy, not a mix of setups.
- Calculate the realised win rate and the realised payoff ratio from actual average win and average loss.
- Find the break-even win rate (1 / (1 + payoff ratio)) and add your cost per trade.
- Subtract it from your win rate to get the margin.
- If the margin is negative, change the exits or the entries; do not raise size.
- If the margin is positive, check the trades needed before you trust it, and keep size modest until the record catches up.
Worked win rate and payoff ratio example in dollars
Imagine a trader with a 40% win rate, an average win of $300 and an average loss of $150. The payoff ratio is 2.0, the break-even win rate is 33.33% and the margin is 6.67 points. Expectancy is (0.40 x $300) - (0.60 x $150) = $30 per trade, or $3,000 over 100 trades, with a profit factor of 1.33. Separating that margin from zero takes about 192 trades.
Now change only the average loss, to $250, because stops keep getting moved. The payoff ratio drops to 1.2, the break-even win rate rises to 45.45%, and the same 40% win rate now produces -$30 per trade. The win rate never moved. The margin did, and the sign followed it.
Risk per trade and the 2% rule
The 2% rule is a common rule of thumb: risk no more than 2% of the account on one trade, so $2,000 on a $100,000 account or $1,000 on $50,000. It is not tied to a specific win rate, but it pairs with streak math. At a 38.37% win rate, a run of ten losses is more likely than not over 250 trades (53.22%), and ten losses at 2% each is roughly a 20% drawdown before compounding.
Win rate and payoff ratio on an intraday account
On our accounts, Tradovate's Performance report under Reports shows your P&L, win rate and trade statistics for any date range, so you can pull your realised win rate and payoff ratio straight from your own trades. Positions must be closed by 4:45 PM ET with no overnight holds, so a daily-bar swing rule that holds trades for weeks cannot be traded as written on our accounts. The break-even win rate math works the same on an intraday record. Funded accounts are simulated.
Win Rate and Payoff Ratio FAQ
What's a good win to loss ratio?
A good win to loss ratio is any win rate that sits clearly above the break-even line its payoff ratio sets. At a payoff ratio of 2.0, anything clearly above 33.33% is profitable before costs. At 1.0, you need more than 50.00%. Judge the margin, not the win rate.
How do you calculate win rate in trading?
Divide winning trades by total trades and multiply by 100. For example, 47 winners in 120 trades is a 39.17% win rate. Decide in advance how you count scratches and partial exits, and keep the rule the same.
Is it true that 97% of day traders lose money?
It is true for one widely cited group: in a study by Chague, De-Losso and Giovannetti, 97% of individuals who day traded Brazilian equity futures for more than 300 days lost money. The study followed everyone who began between 2013 and 2015, and only 1.1% earned more than the Brazilian minimum wage. It describes one market and period, not every trader everywhere, but it is a sobering base rate.
What is the 2% rule in swing trading?
It is a rule of thumb that caps the risk on any single trade at 2% of the account, such as $2,000 on a $100,000 account. It limits how much one loss or one losing streak can take. It says nothing about win rate or payoff ratio, so it works alongside them rather than replacing them.
How much do day traders with $100,000 accounts make per day?
There is no reliable published average, and any single figure would hide a wide spread that includes many losing traders. A more useful number is your own expectancy per trade, set by win rate, payoff ratio and costs, multiplied by the valid trades you actually take.
Futures trading involves substantial risk of loss, leverage can make losses larger than expected, and historical backtest results do not predict future results. Simulated and funded accounts are simulated, and this article is education, not investment advice.


