




TL;DR: Recency bias in trading means giving your last few results more weight than the long record, then changing the plan over them. On 20 years of E-mini S&P 500 data, 66.4% of a breakout rule's back-to-back signals overlapped, faking hot streaks. Counted one trade at a time, skipping after three losses cut the total from +28.7R to +21.9R. Hindsight is worse: the best past setting kept +0.01R of a +0.33R edge the next year.
Recency bias in trading shows up the moment a run of results starts arguing with your plan. Here is where traders usually get caught. Three wins and the size creeps up. Three losses and the next valid setup gets skipped. Neither move feels like a bias at the time. Both feel like reading the evidence.
This guide explains what recency bias is, where it comes from, and how it pairs with hindsight bias. It then tests both on a simple futures rule so you can see how much a recent stretch is really telling you, and gives you a check to run before you change anything.
What Recency Bias in Trading Means
Recency bias is the tendency to treat the most recent events as more important, more typical, or more predictive than older ones. In trading, it means the last few trades, sessions or headlines get more say in the next decision than the hundreds of trades and years of price history behind them.
Psychologists measured the memory side of it decades ago. In Bennet Murdock's 1962 free-recall study, people remembered the first 3 or 4 words of a list better (the primacy effect) and the last 8 words better (the recency effect) than the middle. Recent items are simply easier to retrieve.
Amos Tversky and Daniel Kahneman's 1973 paper on the availability heuristic explains why that matters for judgment. People estimate how likely something is "by the ease with which relevant instances come to mind." Your last losing day comes to mind easily. The 40 ordinary days before it do not. So the estimate leans toward the recent case.
Why traders are especially exposed to recency bias
Trading feeds the bias in three ways.
- Feedback is fast and loud. Every trade gives a result in money, often within minutes, and the newest result is the one still on the screen.
- Results are noisy. A sound rule can lose five times in a row, so short runs look meaningful when they are mostly chance.
- Streaks feel like information. Gilovich, Vallone and Tversky's 1985 "hot hand" study found basketball players and fans believed a hit made the next hit more likely, while the shooting records they examined showed no such link. Previous shots changed players' predictions, not their performance.
That last point needs a caveat. In 2018, Joshua Miller and Adam Sanjurjo showed in Econometrica that the standard way of measuring outcomes after a streak is itself biased in short sequences, and correcting it reversed the original basketball conclusion. The lesson for a trader is not that streaks never mean anything. It is that you need the right test before you believe one.
Other names for recency bias
You will see recency bias called the recency effect (the memory finding), availability bias (the judgment finding), or recency weighting. In investing research the forecasting version is often called extrapolation or extrapolative expectations: assuming the recent trend in prices will continue.
Related lesson: Trading psychology basics
Recency Bias, Hindsight Bias and Other Trading Biases
A trading bias is a predictable error in how a trader collects, weighs or remembers information, one that pushes decisions in the same wrong direction again and again. Recency bias is one of a family of these, and it rarely works alone.
Its closest partner is hindsight bias. Recency bias changes what you expect next. Hindsight bias changes what you believe you knew before. Baruch Fischhoff's 1975 experiments found that telling people an outcome raised the likelihood they gave it after the fact, and that they were largely unaware of the effect. They overestimated what they would have known without being told. Fischhoff called it "creeping determinism."
Behavioral finance finds the recency pattern in whole markets, not just in individuals. Robin Greenwood and Andrei Shleifer studied investor expectations from six data sources between 1963 and 2011. Expectations were positively correlated with past stock returns but negatively correlated with model-based expected returns. In plain terms, investors expected the most just when the models expected the least. Bordalo, Gennaioli, Ma and Shleifer found a related split in professional forecasts: individual forecasters typically over-react to their own news, while the consensus under-reacts.
| Bias | What it changes | Trading example |
|---|---|---|
| Recency bias | How much weight the latest results get | Cutting size after three losses on a rule tested over hundreds of trades |
| Hindsight bias | What you believe you knew beforehand | Saying the reversal was obvious once the chart has already printed it |
| Confirmation bias | Which evidence you look for | Reading only the indicators that agree with your open position |
| Anchoring bias | Which number you judge from | Holding for a target because it was the first one you wrote down |
| Outcome bias | How you grade a decision | Calling a rule-breaking trade good because it happened to win |
The difference matters because the fixes differ. Confirmation bias needs a test that can prove you wrong. Recency bias needs a sample size. Hindsight bias needs a record written before the outcome, because memory cannot be trusted to supply it.
Related lesson: Confirmation bias and the test that beats it
How Recency Bias Breaks a Trading Plan
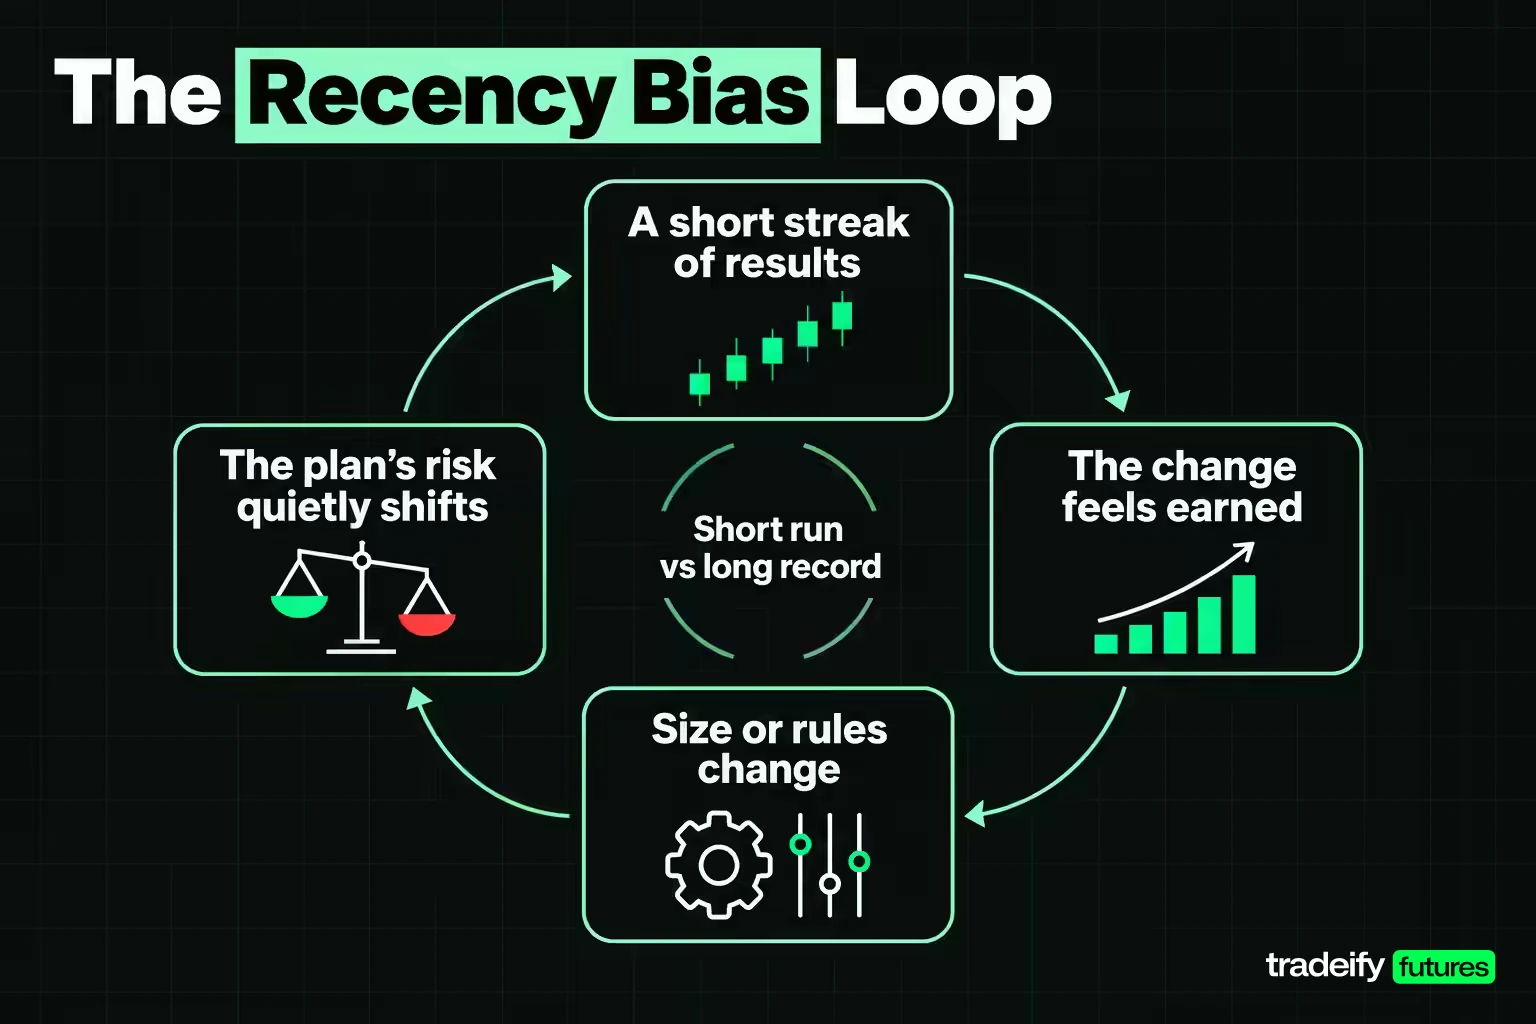
Recency bias damages a trading plan by turning a short run of results into a reason to change rules that were set on a long one. The plan is written in calm conditions. The bias arrives after a streak, when the change feels earned.
It usually shows up in five places, and each one quietly changes the risk the plan was built on.
- Sizing up after wins. A good week makes the edge feel bigger, so risk per trade goes up just as the sample of "proof" is smallest.
- Skipping after losses. Three stops in a row make the next valid setup feel dangerous, so it gets passed. Often that is the trade the rule needed.
- Tweaking settings. The lookback, stop or target gets adjusted because the last ten trades would have done better with a different number.
- Switching methods. A system with years of testing behind it gets dropped for whatever worked last month, often something seen on social media.
- Moving stops. After a few trades that hit the stop and then reversed, the stop gets widened on the next one, which changes the risk the plan was built on.
Each of these feels like learning. That is what makes them hard to catch. The test is simple. If the change would not have been made after the same results arrived in a different order, it is a reaction to recency, not to evidence.
A trader may also notice a quieter form. After a strong month, a losing week feels like an anomaly to wait out. After a weak month, the same losing week feels like proof the method has stopped working. The week is identical. Only the memory around it changed.
Recency Bias After a Big Move in the Market
Recency bias in market reading means treating the last big move as the shape of the next one. A sharp rally makes buying feel safe, a sharp drop makes selling feel urgent, and a surprising news release makes the first reaction feel like the final one.
A simple check shows how much a big recent move tells you about direction. This guide's own calculation uses Yahoo Finance's continuous E-mini S&P 500 (ES) daily closes from September 2006 to September 2026. Take every day where the prior five sessions fell or rose by an unusually large amount (the worst and best 5% of five-session moves), and look at the next 20 sessions.
| Starting point on ES | Cases | Next 20 sessions average | Median | Share positive | Spread (standard deviation) |
|---|---|---|---|---|---|
| After a five-session drop of 3.87% or more | 251 | +1.48% | +2.30% | 63.3% | 8.26% |
| Any day | 5,007 | +0.80% | +1.47% | 65.7% | 4.61% |
| After a five-session gain of 3.74% or more | 252 | +1.08% | +1.56% | 66.3% | 5.60% |
Read the drop row carefully. After the sharpest selloffs, the next month was not worse on average. The share of positive outcomes was about the same as any day. What changed was the spread, which nearly doubled. The recent move told you very little about direction and a lot about how wide the range of outcomes had become.
Panic selling after a sharp drop
Panic selling is recency bias acting on a drop. The last few sessions say "down," the losses are fresh, and exiting feels like the only safe choice, so you close or reverse a position without a rule telling you to. The decision is driven by how the last week felt, not by your stop or your plan.
In this guide's ES calculation, the 251 cases after a five-session drop of 3.87% or more did not lead to a worse month on average (+1.48% against +0.80% for any day). What the drop did predict was a wider range of outcomes, with a spread of 8.26% against 4.61%. So the useful response to a sharp drop is usually smaller size or a wider plan for volatility, decided in advance, rather than an exit made because the drop is recent. These figures are historical, include no costs, and describe one index; they are not a trading signal.
Performance chasing after a rally
Performance chasing is the same bias acting on a rally: buying a market or a strategy because it just went up, expecting the recent trend to continue. It is the trading version of the extrapolation Greenwood and Shleifer found in measures of investor expectations, where expectations rose with past returns. In a trader's account it often looks like entering late after a run of up days, or switching to whichever setup worked last month.
In the same ES calculation, the 252 cases after a five-session gain of 3.74% or more were followed by an average 20-session return of +1.08%, with 66.3% positive. That is close to any day. The rally did not make the next month notably better or worse. Chasing it adds risk at a worse price without adding information, and a missed entry is a different trade, not a late version of the same one.
Recency bias and overreacting to news
News is recency bias at its sharpest because it arrives all at once and dominates the screen. The first move after a release is often treated as the verdict. A rule that sets in advance what you do around scheduled releases (stand aside, wait for a set number of minutes, or trade only with a pre-set size) removes the decision from the most emotional moment of the day.
How a calm stretch makes risk look smaller
Recency bias also distorts the sense of risk, and here it is partly right, which makes it more dangerous. This guide's own calculation split Yahoo Finance's continuous ES daily history (2006 to 2026) into 251 blocks of 20 sessions, one block's return had almost no link to the next block's return (correlation -0.10). One block's volatility had a strong link to the next block's volatility (correlation 0.62).
So "it has been calm" is real information. The calmest fifth of blocks (daily standard deviation of 0.56% or less) were followed by blocks averaging 0.70%, against 1.02% for all blocks and 1.80% after the stormiest fifth (1.31% or more). The trap is the exception. After 21.6% of the calm blocks, about one in five, volatility in the next block at least doubled, against 7.2% of all blocks. A trader who sizes up because the last month was quiet is trusting the base rate and ignoring the tail. Quiet is a reading, not a promise.
How Recency Bias Inflates a Winning Streak
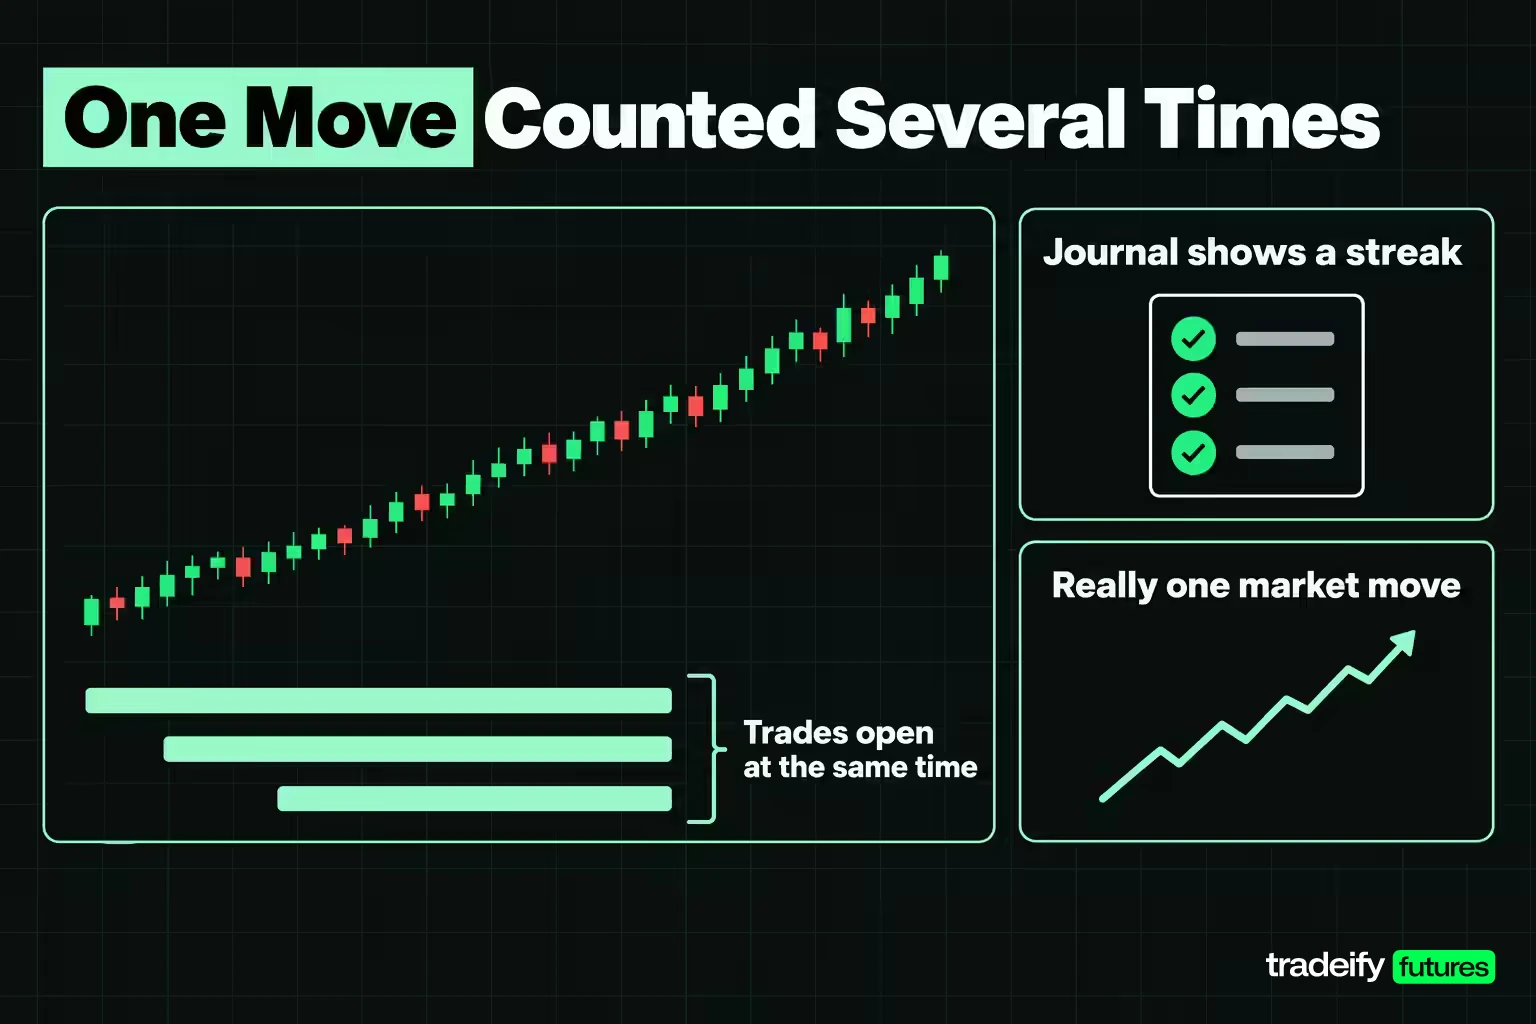
Recency bias in performance review starts with how trades are counted. A run of wins in a journal looks like evidence of form, but if several of those trades were open at the same time on the same market, the streak may be one market move counted several times.
The test rule here is deliberately plain, so it can be rebuilt:
- Data: E-mini S&P 500 continuous front-month daily bars, 5,032 sessions from September 18, 2006 to September 16, 2026.
- Signal: the session closes above the highest high of the prior 20 sessions.
- Entry: next session's open.
- Stop: 1.0 times the 14-session average true range (ATR) measured at the signal session.
- Target: 2.0 times the same ATR, so a full win is 2R (R is the amount risked).
- Time limit: exit at the close of the 20th session.
- Fills: a gap through the stop or target fills at the open; if both trade in one bar, the stop is assumed first; no commissions or slippage.
Breakouts cluster. When the index trends, the signal fires on several sessions in a row while earlier trades are still open. In this guide's calculation, 391 of 589 adjacent signal pairs (66.4%) had the second signal arrive while the first trade was still running.
Recency bias in streak counts from stacked trades
To see how much of a streak comes from stacked trades, the E-mini breakout rule was run two ways: taking every signal, with positions stacking, and taking a signal only when no position was open (one at a time).
| Breakout rule measure | Every signal | One at a time |
|---|---|---|
| Trades | 590 | 229 |
| Win rate | 40.3% | 39.3% |
| Average per trade | +0.15R | +0.125R |
| Runs of wins and losses | 153 | 115 |
| Runs expected if results were independent | 285 | 110 |
| Runs test z score | -11.3 | +0.66 |
| Autocorrelation of results | 0.49 | -0.05 |
The average result barely moved between the two columns. The streakiness moved completely. With stacked positions, wins and losses came in long clumps, far fewer runs than chance would produce, and each result strongly resembled the last one (autocorrelation of 0.49). Counted one at a time, the clumping disappeared. The runs count sat close to what coin flips produce, and the autocorrelation was close to zero.
The "hot hand" in the every-signal column was not the rule getting better or worse. It was the same market move showing up in several trades. If your journal shows five wins in a row, check how many of them were open together before you treat it as form.
The Cost of Trading on Recency Bias
Recency bias becomes expensive when a streak changes what you do next. Two common habits are skipping trades after a losing run and increasing size after a winning run. Both can be priced on the same E-mini S&P 500 breakout rule (20-session high breakout, 1.0 ATR stop, 2.0 ATR target, 20-session time limit, 2006 to 2026 daily data, no costs).
First, the plain question: did trades after three straight wins do better than trades after three straight losses?
- Every signal: 110 trades after three wins averaged +0.95R; 212 trades after three losses averaged -0.33R. A gap of 1.27R. Shuffling the same results 10,000 times never produced a gap that large.
- One at a time: 9 trades after three wins averaged -0.68R; 48 trades after three losses averaged +0.14R. A gap of -0.82R, and 94% of shuffles produced a larger gap. In other words, nothing there.
The shuffle comparison matters. Joshua Miller and Adam Sanjurjo's 2018 research shows that comparing "after a streak" results with zero is biased in short samples. Comparing them with shuffled versions of your own results avoids that problem. A streak is not a signal until it beats the shuffle.
Streak habits that recency bias encourages
The two habits, skipping after three straight losses and doubling size after three straight wins, were priced on the same E-mini breakout rule, measured as total R over the full sample in this guide's calculation:
| Streak habit on the breakout rule | Every signal total | One at a time total |
|---|---|---|
| Trade every signal as written | +90.8R | +28.7R |
| Skip the trade after three straight losses | +159.9R | +21.9R |
| Double size after three straight wins | +195.2R | +22.6R |
In the every-signal column, both habits look brilliant. In the one-at-a-time column, both lost money against the plain rule. The 48 trades the skip habit removed averaged +0.14R, slightly better than the +0.12R of the 181 trades it kept.
Same rule, same market, opposite answer. That reversal is the point. The every-signal result was not an edge the other method missed. It was a counting effect: a losing trade that stays open keeps overlapping with new losing signals, so the losing clumps look like a pattern you can sidestep. Take one position at a time and the pattern is gone, and so is the benefit of trading it.
Recency Bias and the Long Record Behind Recent Results
Recency bias toward recent results means judging a rule by its last 20 or 50 trades instead of its full record. A recent window is the number that feels most current, and it is also the noisiest number in the account.
Using the same E-mini S&P 500 breakout rule taken one position at a time (229 trades, average +0.125R, 2006 to 2026 daily bars, no costs), here is what recent windows looked like.
- 20-trade windows ranged from -0.55R to +0.74R per trade and were negative in 25% of cases, on a rule that was positive overall.
- 50-trade windows ranged from -0.16R to +0.37R and were negative in 8% of cases.
- A good window did not predict a good next window. The correlation between one 50-trade average and the next 50 trades was -0.35, across 130 overlapping pairs. That is not a usable signal, but it is the opposite of what the streak habit assumes.
The extremes make the point without statistics. The worst 50-trade stretch, -0.16R per trade, ended on July 11, 2011. The next 50 trades averaged +0.11R. The best stretch, +0.37R, ended on February 10, 2020, and the next 50 averaged +0.18R. A trader who dropped the rule at the worst point would have walked away from its recovery. One who sized up at the best point would have done so just before an ordinary stretch.
How many trades it takes to judge a rule
The width of the noise in a trading record can be calculated. On the E-mini S&P 500 breakout rule used in this guide (20-session high breakout, one position at a time, 229 trades from 2006 to 2026, average +0.125R before costs), each trade's result had a standard deviation of 1.42R. The standard error of an average (how far it typically sits from the true value) is that spread divided by the square root of the number of trades.
| Trades in the sample | Standard error of the average |
|---|---|
| 10 | 0.45R |
| 20 | 0.32R |
| 50 | 0.20R |
| 100 | 0.14R |
| 229 | 0.09R |
| 500 | 0.06R |
Set that against an edge of about +0.125R per trade before costs. After 20 trades, the noise is more than twice the edge. Even the full 229 trades put the average only about one standard error above zero, and commissions and slippage would shrink it further. A rule with that margin cannot be judged on a recent window, good or bad. Your own rule will have its own spread, so compute it from your journal rather than borrowing these numbers.
Hindsight Bias and the Rule That Only Wins Looking Back
Hindsight bias in trading shows up when you choose a rule, or judge one, after the results are already in. The rule that worked best last year looks like the one you should have used. The catch is that you could not have known which one it would be.
It can be measured. In this guide's calculation, an E-mini S&P 500 breakout idea was run with 36 combinations of settings: lookbacks of 5, 10, 20, 40, 60 and 100 sessions, each with targets of 1.0, 1.5, 2.0, 2.5, 3.0 and 4.0R (1.0 ATR stop, 20-session limit, one position at a time, 2006 to 2026 daily data, no costs). For each of 16 windows, the best combination over three years was picked and then tested on the next calendar year, for test years 2010 to 2025.
- In the selection years, the chosen combination beat the average of all 36 by +0.33R per trade.
- In the following year, it beat the average by +0.01R. About 96% of the apparent edge was gone.
- It beat the average in only 6 of 16 years and was profitable in 10 of 16.
- In every one of the 16 years, the chosen combination was not that year's best. That is 0 of 16.
Now the hindsight part. Looking back at any single year, the best combination beat the average by +0.66R per trade. That is the number your memory sees when you review a year and think "I should have been trading that." The number you could actually have earned by picking from past data was +0.01R.
One window shows how it feels. Choosing for 2012 from 2009 to 2011 picked the 5-session lookback with a 4.0R target, which had beaten the field by +0.47R. In 2012 it averaged -0.28R per trade. Nothing about the choice was careless. The best past performer simply did not carry forward.
Related lesson: The longer version of this trap
How to Reduce Recency Bias in Trading
You reduce recency bias by deciding, before the results arrive, how many results it takes to change anything. Willpower does not fix it. Structure does.
Set a minimum sample before any rule change
Write in your plan how many trades must pass before a setting can change, and size that number from your own results. On a 20-year E-mini breakout test, each trade's result had a standard deviation of 1.42R, so the average of 20 trades carried a standard error of 0.32R, more than twice the rule's edge. With swings like that, 20 trades cannot separate a working rule from a broken one. Pick the number from your own standard error, and review on a calendar date, not after a streak.
Count trades one position at a time
Before you read any streak, check whether trades overlapped. Combine positions that were open together on the same move, or re-run your review with one position at a time. If the streak disappears, it was never information about you.
Keep risk per trade fixed through streaks
Fixed risk takes the most expensive recency decision off the table. If your size is set by the plan and not by how the last three trades felt, a winning run cannot inflate it and a losing run cannot shrink it below the level that lets the edge play out.
Compare streaks with shuffles
When a streak seems to mean something, shuffle your own trade results many times (a spreadsheet can do it) and see how often a streak that long appears by chance. If it is common in the shuffles, it is common in your future too, and needs no response.
Record what the rule looked like on the day
Hindsight bias rewrites what you thought at the time. A journal entry written before the outcome (the setup, the reason, the planned stop and target) is the only reliable record. When you review a losing run, review those entries, not your memory of them.
Use a cooling-off rule after news and big days
Agree with yourself in advance that after a major release or an unusually large win or loss, the next trade waits for a set time or a full setup check. The point is not to trade less. It is to stop the most recent result from picking the next trade.
On our Growth evaluations, the daily loss limit works as a hard version of that pause: reach it and trading stops until the next session. It is a soft breach, so the account stays active. It ends the session before a losing run can talk you into a different plan.
Related lesson: Logging the evidence before the outcome
A Recency Bias Check Before Changing Any Rule
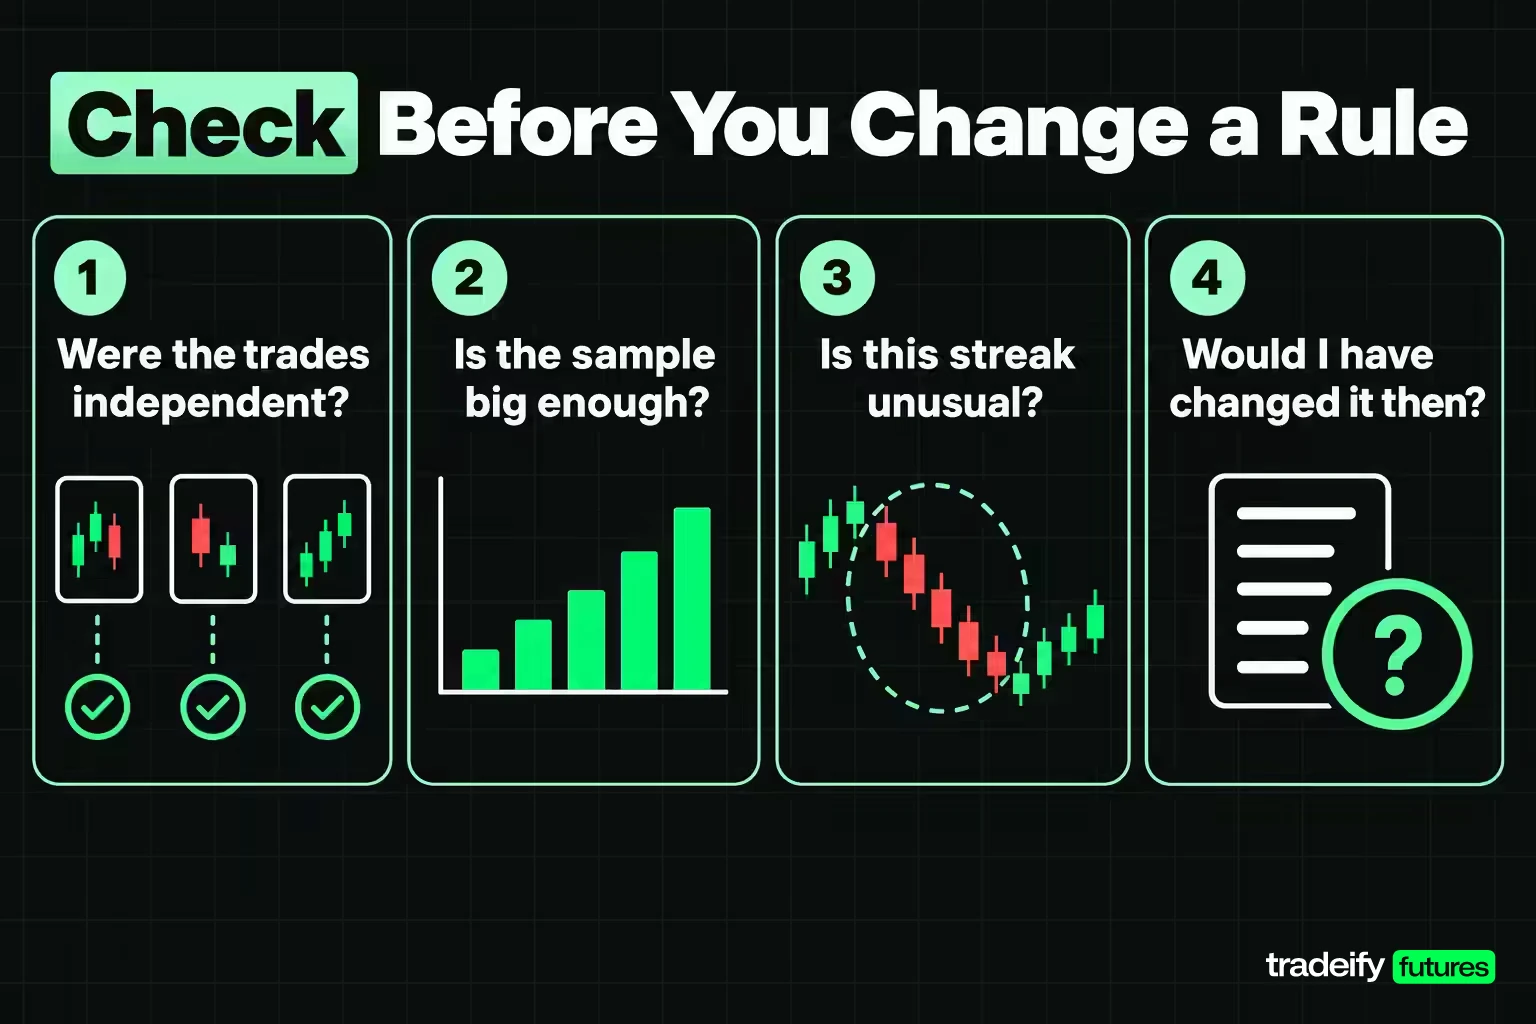
A recency bias check is a short set of questions you answer with numbers before changing a rule, a setting or your size. Each question produces a figure from your journal, and each figure has a threshold set in advance.
| Question before a change | Number it produces | Change allowed only when |
|---|---|---|
| Were the trades in this streak independent? | Share of consecutive trades open at the same time | Overlapping trades are combined or removed first |
| Is the sample big enough? | Trades since the last change, and the standard error of their average | The standard error is smaller than the edge you are trying to judge |
| Is this streak unusual? | How often shuffled results produce a streak this long | Shuffles rarely produce it |
| Would I have made this change on the day? | The rule and reasons as written before the trades | The written record supports the change, not just the result |
Run the questions in order. The first decides whether the rest mean anything, because overlapping trades exaggerate every streak measure that follows.
The fourth question is the one hindsight bias hides from. If you cannot find what the rule and your reasoning looked like on the date you now say it was failing, you are reviewing your memory of the rule, not the rule itself. Baruch Fischhoff's 1975 hindsight experiments found people were largely unaware that knowing the outcome had changed their judgment. There is no reason to expect a trader reviewing a losing month to do better.
Related lesson: Separating the rule test from the trade test
Recency Bias in Trading FAQ
What is bias and an example of it in trading?
A bias is a consistent tilt in judgment that pushes decisions the same wrong way. In trading, a common example is recency bias: after three losing trades, a trader skips the next valid setup even though the rule was tested over hundreds of trades. The decision is driven by the latest results, not the full record.
What is the recency bias in psychology?
In psychology, recency bias is the tendency to give recent events more weight than older ones when judging or predicting. It ties to the recency effect in memory, where the last items in a list are recalled better, and to the availability heuristic, where events that come to mind easily seem more likely.
What does trading bias mean?
A trading bias is a predictable mental error that distorts trading decisions, such as recency, confirmation, anchoring or hindsight bias. The term is also used for a directional lean, like a bullish bias on a market. In psychology articles it means the first: a systematic error in judgment.
What is another name for recency bias?
Recency bias is also called the recency effect or availability bias, since recent events are the most available to memory. In finance it is often described as extrapolation or extrapolative expectations, meaning the assumption that a recent trend will continue. Some traders simply call it recency weighting, giving the latest results more weight than older ones.
What is the difference between recency bias and hindsight bias?
Recency bias changes what you expect to happen next, based on the latest results. Hindsight bias changes what you believe you knew before an outcome. One leads to overreacting to a streak; the other makes past outcomes look predictable, which makes the next decision feel safer than it is.
What to Do With the Last Trade
The last trade is the smallest sample you have and the one you will weigh most heavily, so give it a job that suits it. Review it for execution: did the rule fire, did you follow it, were the stop and size what the plan said? Do not let it vote on the rule or set the size of the next position.
This week, take your last 50 closed trades and run the check. Mark which trades were open together, count the runs of wins and losses, and work out the standard error of the average. If the number you were about to react to sits inside that noise, leave the plan alone and keep the review on your calendar.
Related lesson: Trading goals and process metrics
This guide is educational and is not financial advice. The E-mini S&P 500 figures come from historical studies on continuous daily data with no commissions or slippage, and they do not predict future results. Futures trading uses leverage, and losses can be larger than you expect. Evaluation and funded accounts at prop firms run in a simulated setting, and results there are not the same as live trading.


