



TL;DR: Momentum trading buys strength or sells weakness after a move, so the real decision is what the rest of the move still pays. On 47 sessions of ES and NQ 5-minute bars, buying the strongest trailing hour lost on average over the next hour. Most of those trades went against the entry first, so the stop width shaped the result more than the signal did. On five years of daily bars, the strongest 20 sessions lagged the market's own average.
Momentum trading has a simple pitch. Something is moving, so you get on board and let the move carry you.
The pitch skips the timing. By the time a move is strong enough to see, part of it is already gone. You are not buying the move. You are buying what is left of it, at a price set by how late you are. This guide covers what momentum trading is, how momentum is calculated, the indicators and strategies traders use, and the pros and risks. Then it measures the core decision on E-mini S&P 500 and Nasdaq-100 futures at two clocks: the 60 minutes after a strong hour and the 20 sessions after a strong month.
What Momentum Trading Is
Momentum trading takes positions in the direction of a recent price move, on the assumption that a move with force behind it is more likely to keep going for a while than to reverse straight away. A momentum trader buys an asset that has been rising and sells, or sells short, one that has been falling. The signal is the price change itself, not valuation, earnings or news.
That makes momentum trading different from two neighbors. Trend following also trades with the direction, but it aims to hold a longer move and accepts deep pullbacks along the way. Mean reversion does the opposite, fading a strong move on the bet that price snaps back toward an average.
A momentum investor applies the same idea over months rather than minutes, holding stocks or funds that have outperformed over the past several months. The academic base for that version is solid. Jegadeesh and Titman studied NYSE and AMEX stocks from 1965 to 1989 and found that buying recent winners and selling recent losers over 3- to 12-month horizons produced significant profits. Moskowitz, Ooi and Pedersen later found that a futures contract's own past 12-month return predicted its future return across 58 futures and forward contracts.
Those findings describe months and portfolios. A momentum trade on a five-minute chart is a much shorter bet, and borrowing the credibility of a 12-month study for it is a common mistake. It has to be tested on its own clock.
Related lesson: Trend following
Momentum Trading in Uptrends and Downtrends
Momentum trading works in both directions. In an uptrend the trader buys strength, looking for higher highs and higher lows to continue. In a downtrend the trader sells weakness, often short, expecting lower highs and lower lows to keep printing.
The two sides do not always behave the same way. Declines are often sharper than advances, and a short squeeze can reverse a decline quickly. Rallies more often grind higher, which gives a buyer more time but less speed.
The direction of the broader market also changes what a momentum trading result means. This guide's own measurement on Yahoo Finance 5-minute bars (47 sessions, August 27 to November 4, 2026) shows why. Shorting the weakest trailing hour on Nasdaq-100 futures (NQ) averaged +12.53 points over the next hour, with 57.5% of trades profitable. That looks like a strong downside momentum effect until you notice that NQ fell during those sessions, and in the same data a short on every bar averaged +5.67 points. About half of the short result was the market's drift, not the signal.
On E-mini S&P 500 futures (ES), which ended the same 47 sessions almost exactly where it started, this guide's measurement found the same short averaged +0.73 points and only 48.4% of trades were profitable. A momentum result measured in a trending sample has to be compared with the trend itself before it means anything.
How Momentum Is Calculated
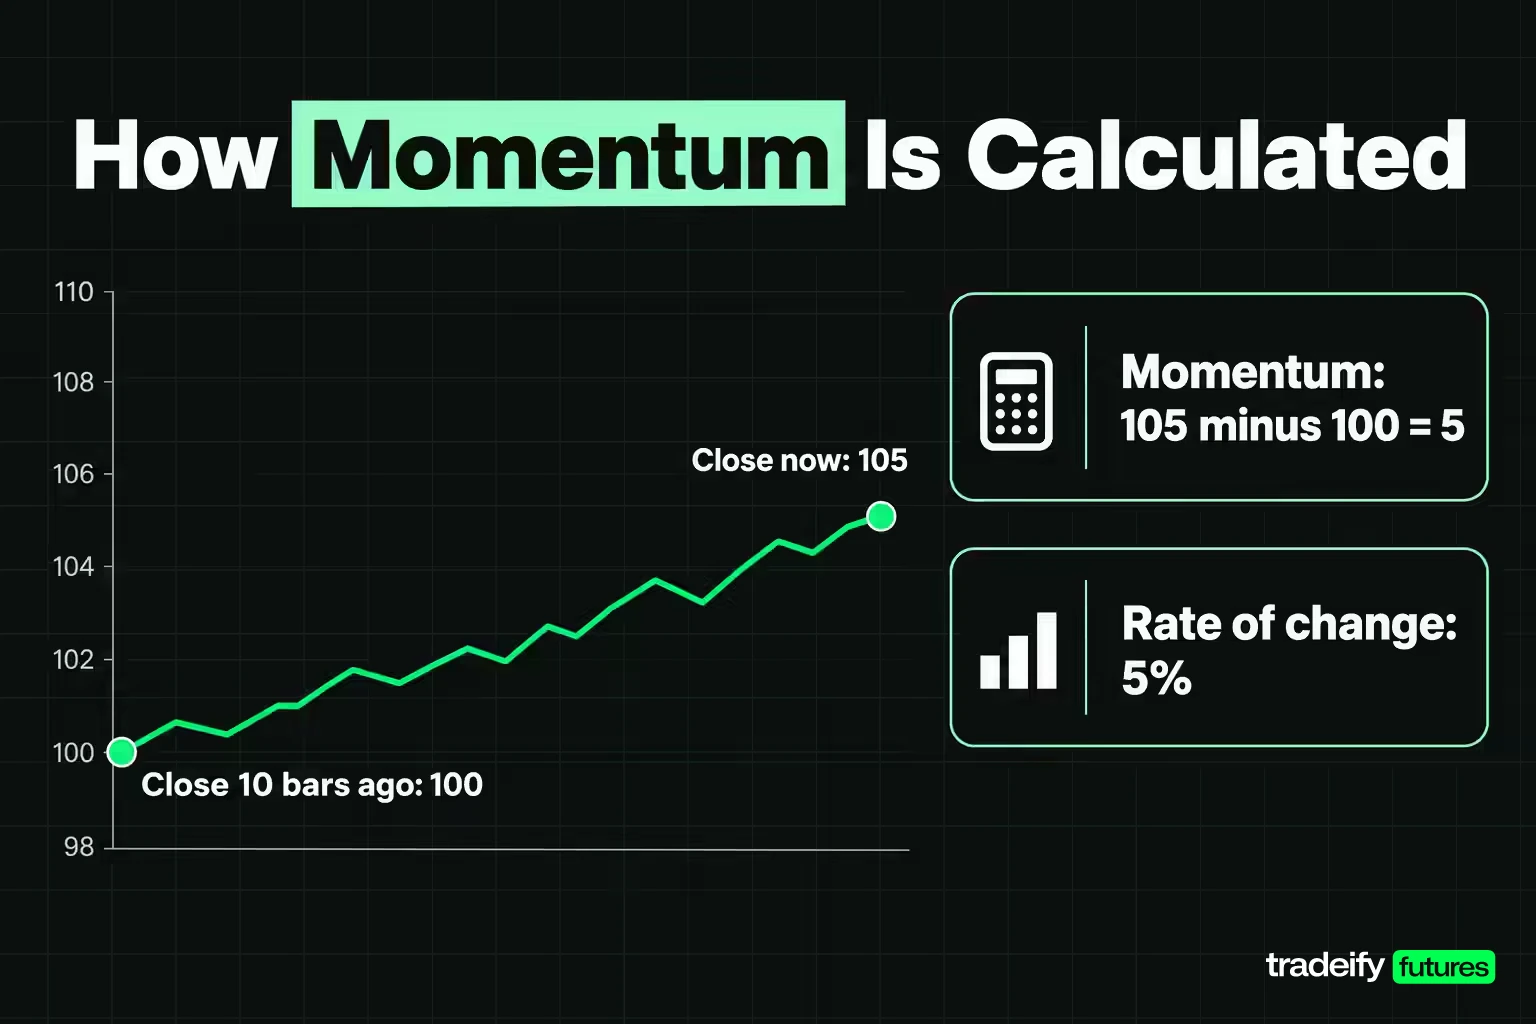
Momentum is calculated as the change in price over a fixed number of periods. There are two common forms.
- Momentum (price change): current close minus the close n periods ago.
- Rate of change (ROC): that difference divided by the old close, times 100, so the result is a percentage.
An illustrative example: if a market closes at 105 now and closed at 100 ten bars ago, momentum is 105 minus 100, or 5, and the 10-period ROC is 5 divided by 100, times 100, or 5%. ROC oscillates around zero. It has no upper limit and cannot fall below -100%.
The lookback n is the real decision. A 12-bar lookback on 5-minute bars measures the last hour. A 20-session lookback on daily bars measures about a month. The academic momentum strategies use months, commonly the past 3 to 12 months, and research groups often rank many assets against each other rather than judging one asset alone.
That distinction has a name. Cross-sectional momentum compares assets to each other and buys the relative winners. Time series momentum looks only at one asset's own past return and goes long when it is positive and short when it is negative. The Moskowitz, Ooi and Pedersen study found the 12-month time series effect lasted about a year and then partially reversed. Jegadeesh and Titman found something similar for stocks: a portfolio formed on six-month returns earned an average cumulative 9.5% over the next 12 months, then lost more than half of it over the following 24.
Momentum Metrics Beyond the Raw Price Change
A raw point change is hard to compare across markets and across quiet and busy weeks, so momentum traders usually normalize it. Three common ways:
- Percent change. On October 20, 2026, ES closed the 9:40 AM bar at 7,713.00 and the 10:40 AM bar at 7,783.75, a 12-bar momentum of 70.75 points and an ROC of about 0.92%.
- Volatility multiple. Divide the move by the instrument's typical move over the same window. In this guide's measurement of 47 ES sessions, the average 60-minute move was 10.58 points, so that 70.75-point hour was about 6.7 typical hours of movement packed into one.
- Percentile rank. Rank today's move against every move in your history and use the rank as the momentum score. A rank adapts automatically when volatility changes, which a fixed point threshold does not.
Some stock-focused articles also mention momentum scores built from several lookbacks, or valuation measures such as the PEG ratio used alongside price momentum. Those are screening tools for stock investors. For a futures trader, the measurement that matters is simpler: rank the move, then record what happened next.
Momentum Indicators and What Each One Measures
Momentum indicators turn price change into a reading that is easier to compare across time. Most of them are some form of the calculation above, smoothed or scaled.
| Indicator | What it measures | Common default | Typical reading |
|---|---|---|---|
| Rate of Change | Percent change versus n periods ago | 12 periods | Above zero rising, below zero falling |
| Relative Strength Index | Average gains versus average losses, scaled 0 to 100 | 14 periods | Above 70 overbought, below 30 oversold |
| Stochastic Oscillator | Close relative to the high-low range | 14 periods, 3-period %D | Above 80 near the range high, below 20 near the low |
| MACD | Gap between a 12-period and 26-period EMA | 12, 26 and 9 signal | Line above signal shows rising momentum |
| Moving averages | Average price over n periods | Varies by timeframe | Price above a rising average shows direction |
| Volume | Contracts or shares traded | Compared with an average | Above average shows participation |
J. Welles Wilder introduced the Relative Strength Index in his 1978 book New Concepts in Technical Trading Systems. George Lane developed the stochastic oscillator in the late 1950s, and Gerald Appel developed MACD in the late 1970s.
The thing to keep straight is that every one of these indicators describes a move that has already happened. An RSI reading of 75 tells you the recent gains have been large relative to the losses. It does not tell you the next hour will pay. A strong reading is an observation, not a confirmation. Whether a high reading pays on your market is something only a recorded sample of signals and outcomes can tell you.
Related lesson: Relative strength index (rsi)
Momentum Trading Strategies and Their Entry Rules
Momentum trading strategies differ mainly in where they enter and what tells them they are wrong. Five common versions:
- Breakout entry. Buy when price closes above a reference level such as the session high, the prior day's high or an opening range. Invalidation: a close back inside the range.
- Pullback entry. Wait for a strong move, then buy a partial retracement with a limit order. Invalidation: the retracement deepens past the start of the impulse.
- Continuation pattern. Buy the break of a tight consolidation, such as a flag, that forms after a sharp move. Invalidation: the flag's low.
- Indicator trigger. Enter when ROC crosses above zero, MACD crosses its signal line, or RSI pushes above a threshold while price is above a rising average. Invalidation: the opposite cross.
- Time series rule. Long when the past n-period return is positive, short when it is negative, rebalanced on a schedule. Invalidation is built in: the sign flips.
People often ask what the top three trading strategies are. There is no official list, but most styles fall into three families: momentum and trend strategies that trade with a move, mean reversion strategies that trade against it, and breakout strategies that trade the escape from a range. Momentum trading overlaps with the first and third.
Whatever the version, write the entry, the stop and the exit before the session. Momentum entries are fast, and a rule invented while price is running is usually the fear of missing out wearing a rule's clothes.
Flag Patterns as Momentum Continuation Setups
A flag is a short, tight pause after a sharp move, usually drifting slightly against it. The sharp move is the pole. The idea is that buyers are resting rather than leaving, and a break out of the flag in the pole's direction resumes the move.
Flags are popular with momentum traders because they give a natural stop at the other side of the pause. They are also easy to see after the fact and much harder to identify in real time, when a flag and the start of a reversal look the same for several bars. Treat the break as the entry and the flag's opposite edge as the invalidation, and judge the pattern by a recorded sample, not by memorable charts.
Related lesson: Flags and pennants
What a 60 Minute Momentum Impulse Paid on ES and NQ
The intraday version of momentum trading asks a narrow question. If the last hour was one of the strongest of the sample, what did the next hour pay?
How the Intraday Momentum Study Was Built
The study used ES and NQ futures, 5-minute bars, regular trading hours from 9:30 AM to 4:00 PM ET, for 47 complete sessions from August 27 to November 4, 2026. Two sessions were removed: September 14, when the continuous series rolled to the next contract mid-session, and October 30, which had a corrupted bar.
At the close of each bar from the 10:30 AM bar through the 2:55 PM bar, the trailing move was the close minus the close 12 bars (60 minutes) earlier. The forward move was the close 12 bars later minus the signal close. That gives 54 signals per session and 2,538 per instrument. Each instrument's signals were ranked into ten equal groups (deciles) by their own trailing move. No commissions or slippage are included unless stated. This is arithmetic on historical bars, not a backtest of a trading system.
Momentum Decile Results for ES and NQ
| Decile in this guide's measurement | ES trailing hour | ES next hour mean | ES next hour higher | NQ trailing hour | NQ next hour mean | NQ next hour higher |
|---|---|---|---|---|---|---|
| 1 weakest | -25.95 | -0.73 | 50.8% | -157.55 | -12.53 | 42.5% |
| 2 | -13.48 | +0.57 | 53.5% | -75.11 | -1.56 | 50.8% |
| 5 | -1.11 | +0.35 | 54.9% | -8.57 | +2.50 | 51.8% |
| 6 | 1.56 | -1.46 | 45.7% | 6.96 | -10.70 | 43.7% |
| 9 | 12.92 | -1.51 | 41.7% | 68.83 | -9.49 | 39.0% |
| 10 strongest | 26.27 | -2.38 | 46.2% | 150.44 | -19.68 | 38.7% |
| All bars | none | -0.60 | 49.1% | none | -5.67 | 47.0% |
All figures are index points from this guide's own measurement on Yahoo Finance bars. In this momentum trading test, the strongest ES decile had already moved between 16.75 and 70.75 points in the trailing hour and then averaged -2.38 points over the next hour, worse than the -0.60 average for every bar. At $50 per point that is -$119 per contract per signal. The strongest NQ decile averaged -19.68 points, or -$393.60 per contract at $20 per point, against -5.67 for all bars.
In this sample, the strongest hour was followed by a weaker than average hour on both instruments. That is the opposite of what the momentum label promises. It fits the academic findings, where very short horizons tend to show reversals and momentum shows up over months, but 47 sessions cannot prove that on their own.
Limits of the Intraday Momentum Study
Three cautions keep this guide's intraday momentum measurement in proportion. First, 47 sessions is one market regime. Second, the strongest hours cluster: ES top-decile signals came from 36 of the 47 sessions, and five sessions held 72 of the 253. Removing October 20, the day with the largest impulses, moves the ES top-decile mean from -2.38 to -1.83 points, still negative.
Third, ES and NQ are not two independent tests. In this guide's measurement their next-hour direction agreed on 87.3% of matched bars, and 74.7% of ES top-decile signals were NQ top-decile signals at the same moment. Buying both does not spread the risk. It doubles it.
Chasing a Momentum Move Versus Waiting for a Pullback
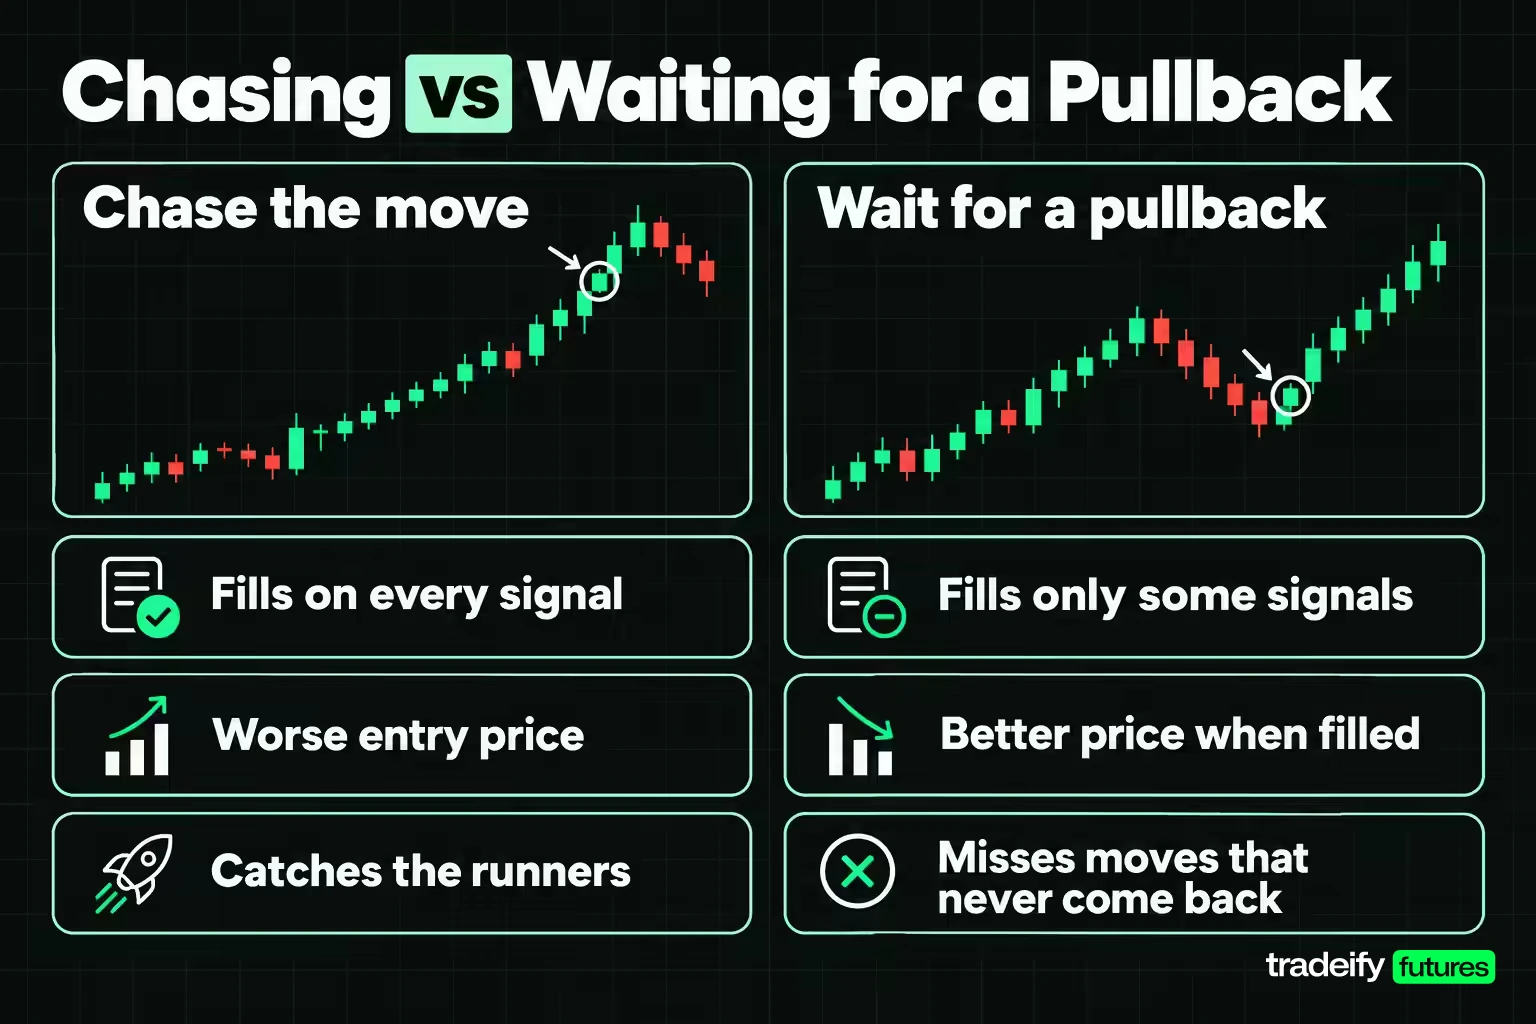
The standard advice after a disappointing chase is to buy better: do not pay the high, place a limit on a pullback and let the market come to you. That advice has a hidden cost, and it shows up in the fill rate.
This guide's momentum trading test on 47 sessions of ES and NQ 5-minute bars placed a buy limit 25% of the trailing move back from the signal close, kept it working for six bars (30 minutes), and held a filled order to the same 60-minute exit.
| Pullback result in this guide's measurement, strongest decile | ES | NQ |
|---|---|---|
| Limit filled | 50.6% | 58.1% |
| Average price improvement when filled | 6.41 points | 35.84 points |
| Mean result of filled pullbacks | -1.39 | -14.51 |
| Chase result on those same signals | -7.80 | -50.35 |
| Chase result on signals that never pulled back | +3.18 | +22.85 |
The pullback improved every filled trade, but look at which trades it filled. The signals that came back 25% were the ones that kept going back: chasing them would have averaged -7.80 points on ES. The signals that never came back were the winners, averaging +3.18 points on ES with 66.4% higher, and the pullback order missed all of them.
That is adverse selection. A pullback limit is not the same trade at a better price. It is a different set of trades, weighted toward failures, at a better price. In the same Yahoo Finance data, applied to every rising bar rather than just the strongest hour, the limit filled 75.8% of the time on ES and still averaged -0.96 points.
Waiting for a pullback is not wrong. It just has to be judged on its own filled sample, with the missed winners counted, rather than on the nicer price it shows when it works. A better fill on a worse trade is still a worse trade.
Related lesson: Pullback trading
How Far a Momentum Trade Moves Against You First
In this guide's measurement of 47 ES and NQ sessions, almost every momentum entry after the strongest trailing hour went against the trader before the next hour was over. On ES, 100% of strongest-decile longs traded below the entry at some point, and 99.2% also traded above it. The median favorable move was 8.25 points and the median adverse move was 9.25 points, about $462.50 per contract. The 90th percentile adverse move was 27.6 points and the worst was 59.0.
NQ was wider in every way in the same measurement: a median adverse move of 62.0 points ($1,240 per contract) against a median favorable move of 41.25, with a 90th percentile of 159.3 points.
That makes the stop the real decision. The ladder below applies a fixed stop to every strongest-decile long and holds the rest to the 60-minute exit.
| ES stop in points, this guide's measurement | Stop touched | Touched trades that closed the hour higher | Mean result with stop |
|---|---|---|---|
| 2 | 88.9% | 40.0% | -0.48 |
| 5 | 72.7% | 29.9% | -1.24 |
| 10 | 46.6% | 16.9% | -1.80 |
| 15 | 32.8% | 14.5% | -2.69 |
| 20 | 21.7% | 9.1% | -2.52 |
| 30 | 7.9% | 0.0% | -2.41 |
A 5-point ES stop was touched on 72.7% of the strongest-hour entries in this guide's data, and 29.9% of the stopped trades would have closed the hour higher. That is the frustrating version of being right: the read was fine and the stop still took you out. A wide stop survives that noise but takes the full reversal when the read is wrong. On NQ a 20-point stop was touched 82.6% of the time and even a 100-point stop was touched 26.5% of the time.
No stop width turned this signal set positive. A stop controls the size of each loss. It cannot create an edge the entry does not have. The useful rule is to measure the normal adverse run of your setup first, then size the position so that a stop beyond that run fits your risk per trade.
Momentum Filters Tested on the Same Signals
Most momentum trading checklists add confirmation: a new high, a volume surge, the right time of day. This guide tested each one on the strongest-decile ES and NQ signals from 47 sessions of Yahoo Finance 5-minute bars, where the strongest trailing hour was ranked against every hour in the sample.
| Momentum filter in this guide's measurement | ES signals | ES next hour mean | NQ signals | NQ next hour mean |
|---|---|---|---|---|
| No filter | 253 | -2.38 | 253 | -19.68 |
| Signal bar at a new session high | 82 | -0.09 | 79 | -4.24 |
| Not at a new session high | 171 | -3.48 | 174 | -26.69 |
| Relative volume 1.0 or higher | 44 | -0.77 | 21 | -20.96 |
| Relative volume below 1.0 | 209 | -2.72 | 232 | -19.57 |
The new session high filter helped the most. Signals that closed at a fresh session high were roughly flat on ES (-0.09 points) and much less negative on NQ, while signals where the trailing hour was strong but the market had already rolled off its high did worst. In plain terms, a strong hour that is still pressing the high is a different situation from a strong hour that has started to fade.
Volume was a weaker filter than its reputation. In this guide's data, the median strongest-hour signal bar traded at 0.74 times the session's running average volume on ES and 0.61 times on NQ, partly because the running average still carries the heavy opening bars. Only 17.4% of ES signals came on above-average volume. Those did better on ES and slightly worse on NQ, on samples of 44 and 21, which is too few to trust.
Time of day mattered too. In the same measurement, most strongest-hour signals came between the 10:30 AM and 11:55 AM bars (167 on ES, averaging -3.07 points), because the trailing hour at that point still includes the opening swing.
A filter earns its place when it removes a failure you have found in your own data, and the new-high filter did that here. Even so, the filtered result was close to zero before costs, not a reliable edge.
Momentum Over 20 Sessions on Daily Bars
The longer momentum clock tells a different story, though not the one most traders expect. For this guide, the ranking method used on intraday bars was applied to Yahoo Finance ES and NQ daily closes from November 5, 2021 to November 4, 2026, 1,257 sessions that include the 2022 decline and the recoveries after it. The trailing return over 20 sessions (about a month) was ranked into deciles and compared with the return over the next 20 sessions.
| ES daily lookback, this guide's measurement | Strongest decile trailing return | Strongest decile next 20 sessions | All windows next 20 sessions | Weakest decile next 20 sessions |
|---|---|---|---|---|
| 20 sessions | +7.71% | +0.44% | +0.91% | +1.40% |
| 60 sessions | +13.32% | +0.98% | +1.05% | +4.64% |
| 120 sessions | +19.75% | +0.04% | +1.26% | +2.15% |
In this guide's daily measurement, the strongest 20-session ES decile was still positive over the next month, with 57.9% of windows higher. But the average window was better (+0.91%, 63.1% higher), and the weakest decile was better still. On NQ the strongest 20-session decile averaged +1.14% against +1.17% for all windows. Simply being invested did as well as picking the strongest month.
The year mattered more than the signal. In the same daily data, the strongest ES 20-session decile averaged -3.40% over the following 20 sessions in 2022 and +3.16% in 2025. NQ showed the same pattern: -5.77% in 2022 and +4.74% in 2025. Momentum in one index paid when the broad market kept rising and failed when rallies were bear-market bounces.
Two cautions apply. The windows overlap, so 1,217 observations are far fewer independent events, and the series is not adjusted for quarterly contract rolls. A single index is also not what the academic momentum studies test, which rank many assets against each other or combine many markets.
The adverse run grew with the clock. In this guide's daily data, the median adverse move inside the next 20 sessions for the strongest ES decile was 2.2%, about 100.2 points or roughly $5,010 per ES contract.
Momentum Trading Across Timeframes and Trading Styles
Momentum trading is not one strategy but a family that changes with the clock.
- Scalping momentum trades bursts lasting seconds to a few minutes. The move is small, so costs and the bid-ask spread take a large share of it.
- Day trading momentum trades intraday impulses that last minutes to hours. In this guide's measurement of 47 ES sessions, an average 60-minute ES move was 10.58 points in either direction, which sets the scale for targets and stops.
- Swing trading momentum holds for days to weeks and needs room for overnight gaps and multi-day pullbacks.
- Position trading momentum holds for months and is where most of the published evidence sits.
The shorter the clock, the less the published research helps you and the more your own measurement matters. The longer the clock, the wider the stop and the more capital the position ties up. In this guide's five-year daily ES data, buying the strongest 20 sessions carried a median adverse run of about 100 points over the next 20 sessions, roughly ten times an average hourly move.
Pick the timeframe first, then the strategy. A momentum rule tested on daily bars tells you nothing about the same rule on 5-minute bars.
Related lesson: Day trading
One Momentum Hour on the E-mini S&P 500 Read Bar by Bar
October 20, 2026 produced the largest ES trailing hour in the sample. It shows every part of the problem in one hour.
ES closed the 9:40 AM bar at 7,713.00. Over the next hour it climbed steadily, closing the 10:25 AM bar at 7,785.00 and printing a high of 7,791.50 in the 10:30 AM bar on 42,041 contracts, roughly three times the session's median bar volume of about 13,000. The 10:40 AM bar closed at 7,783.75, so the trailing hour measured 70.75 points and the signal fired.
The chase bought 7,783.75. Over the next hour price never got far above the entry: the high was 7,790.50, a favorable move of 6.75 points. Then the 11:10 AM bar opened at 7,778.00 and dropped to 7,747.00 on 57,477 contracts. The hour closed at 7,763.50 in the 11:40 AM bar, a loss of 20.25 points, or $1,012.50 per ES contract.
Here is how each choice played out:
- A 5-point stop at 7,778.75 was hit in the 11:00 AM bar, a loss of $250 per contract.
- A 10-point stop at 7,773.75 was hit in the 11:10 AM bar, a loss of $500.
- The 25% pullback limit at about 7,766.06 filled during the 11:10 AM drop and ended the hour 2.56 points lower.
- No stop took the full 20.25-point loss.
The strongest hour of the sample was the hour to stay out of, and nothing on the chart at 10:45 AM said so. Every outcome above was decided by a number chosen before the entry, not by anything the chart showed after it.
Advantages of Momentum Trading
Momentum trading has advantages that hold up even after the measurement above is taken seriously.
- The signal is objective. A price change over a fixed lookback can be measured the same way every time, which makes momentum rules easy to write down and test.
- The invalidation is clear. If you bought because price was rising, a decisive move back through the start of the impulse tells you the premise has failed.
- It works across markets. Moskowitz, Ooi and Pedersen's time series momentum research found 12-month momentum profits positive for every one of the 58 futures and forward contracts examined, across equities, currencies, commodities and bonds.
- It fits liquid futures. Index futures trade nearly around the clock with tight ticks, so momentum trades can be entered and exited quickly.
- It keeps you with the flow. Trading with a move means you are not fighting the market's direction, which avoids catching a falling knife.
The catch is that most of the documented advantage lives at horizons of months. At shorter horizons the benefits above are real, but the edge has to be proven for your market and timeframe.
Risks and Drawbacks of Momentum Trading
The drawbacks of momentum trading come from its structure, so they repeat.
- Late entry. The signal appears after the move, so the reward that is left is smaller than the move you saw, while the risk is not.
- Reversals. In this guide's 47-session measurement of ES and NQ 5-minute bars, the strongest trailing hour was followed by a weaker than average hour on both.
- Momentum crashes. Daniel and Moskowitz documented infrequent but persistent strings of negative momentum returns. They tend to arrive after market declines, when volatility is high, as the market rebounds and recent losers rally hardest.
- Crowding and correlation. Everyone sees the same price move, and correlated markets move together. In this guide's measurement, ES and NQ agreed on the next hour's direction 87.3% of the time.
- Costs on small moves. One tick of slippage per side costs 0.5 points per round turn, $25 on ES and $10 on NQ, before commissions. In this guide's ES measurement, that turned the short-the-weakest-hour result from +0.73 points to +0.23, and to -0.27 at two ticks per side.
- Overtrading. Strong moves feel urgent, and urgency multiplies the number of trades taken on a thin edge.
The emotional trap in momentum trading is the missed move. You watch the impulse go without you, and the next bar starts to look like a second chance. Missing an entry does not make the next price a good entry. It makes it a different trade, usually a later and more expensive one.
Related lesson: Slippage explained
How to Backtest a Momentum Trading Plan
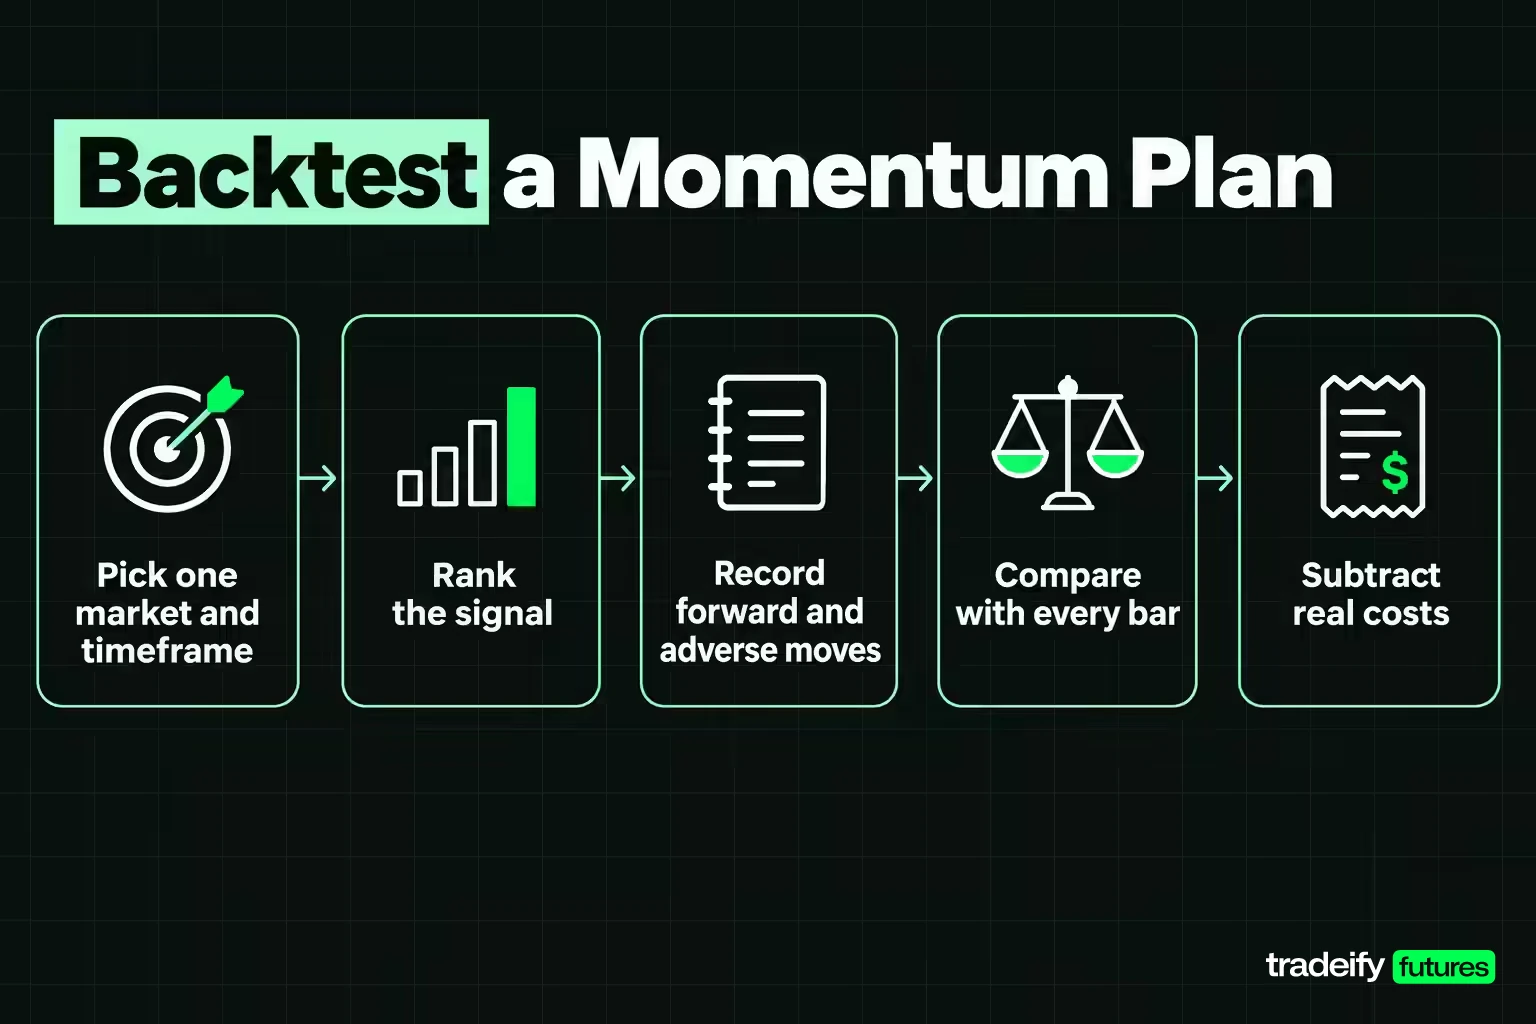
A momentum trading plan is a measurement before it is a trade. This process ranks every bar's trailing move and records what followed, and it can be run on any market with a spreadsheet or a short script.
- Pick one instrument and one timeframe, and write the lookback and holding period in bars.
- Define the signal as a rank rather than a fixed number of points, so the threshold adapts when volatility changes.
- For every signal, record the forward move over the holding period and the largest adverse and favorable moves inside it.
- Compare the signal's result with the result of every bar. A momentum signal that does no better than being in the market has no edge.
- Test any entry refinement, such as a pullback limit, on its fill rate and its filled sample, and count the winners it misses.
- Subtract real costs, commission plus at least one tick of slippage per side, before reading any average.
- Split the sample by period and check whether the result survives in each part, including a falling market.
- Set the stop beyond the normal adverse run and size the position so the stop fits your risk per trade.
Then run it again in a month. The relationship between a strong move and the next one belongs to the market and period you measured, not to markets in general, and it can change without warning.
Related lesson: How to keep a trading journal
Momentum Trading When Positions Close Each Session
Some accounts require every position to be flat by the end of the trading day. That rule decides which momentum horizon is even available. The 20-session and longer versions, where the published evidence is strongest, need overnight holds, so an intraday-only account is limited to momentum that starts and finishes inside one session. That is the shortest horizon, where published evidence is thinnest and costs take the largest share of each move.
On our accounts, all positions must be closed by 4:45 PM ET, and no overnight, weekend or swing holds are allowed on any account type, so momentum trading with us is intraday only. News trading is allowed at your own risk, which matters because many momentum bursts start on economic releases, and our funded accounts are simulated.
Momentum Trading FAQ
What is a momentum investor?
A momentum investor buys stocks or funds that have outperformed over the past several months and sells or avoids recent underperformers. The approach rests on research such as Jegadeesh and Titman's, which found 3- to 12-month winners kept outperforming for a time. It is slower than momentum trading, which works on minutes to weeks.
What is the 7% rule in stocks?
The 7% rule is a stock-selling guideline from Investor's Business Daily: sell a stock if it falls 7% to 8% below your purchase price. It caps the loss on a position that has stopped working. It is a stock rule, and futures traders usually set stops in points or ticks based on the instrument's normal movement.
What are the top 3 trading strategies?
The three most common strategy families are momentum or trend following, mean reversion, and breakout trading. Momentum strategies trade with a move, mean reversion strategies trade against it, and breakout strategies trade the move out of a range. There is no official ranking, and each needs its own test on your market and timeframe.
What is the 3-6-9 rule in trading?
The 3-6-9 rule is an informal risk guideline with no single definition. One common version risks about 3% per trade, caps combined open risk at 6% and targets 9%, while other sources use the numbers as drawdown limits. Treat it as a starting framework, not an established standard.
Does momentum trading work?
Momentum trading works best in the published research at horizons of months, and much less reliably over minutes and hours. The long-horizon effect is documented across stocks and futures, but it also suffers sharp crashes. In this guide's 47-session measurement, buying the strongest hour lost on average over the next hour on both ES and NQ.
Is momentum trading good for beginners?
Momentum trading is usually a hard first strategy, because it is easy to understand but entries are fast and adverse moves tend to come first. A beginner is better served by testing one rule on one market on paper, with a fixed stop and position size, before trading it.
This article is educational and is not investment advice or a recommendation to trade any instrument. Futures are leveraged, and losses can exceed what you expect, especially when fast moves gap through a stop. The studies on this page are arithmetic on historical bars with no fills and limited cost assumptions, so they are not backtests or forecasts, and past results do not predict future ones. Funded and evaluation accounts are simulated and differ from live trading. Confirm current contract specifications, fees and account rules before trading.


